Perdagangan Kuantitatif Cryptocurrency untuk pemula - Membawa anda lebih dekat dengan Kuantitatif Cryptocurrency (5)
Penulis:Lydia, Dicipta: 2022-08-03 16:08:50, Dikemas kini: 2023-09-21 21:07:02
Dalam artikel sebelumnya, kami menerangkan analisis logik perdagangan strategi grid yang mudah.
-
Analisis Logik Dagangan Seperti yang kita sebutkan dalam artikel sebelumnya, anda boleh mencetuskan tindakan perdagangan dengan melintasi setiap garis grid dan menilai harga semasa melintasi di atas atau di bawah.
Rincian pertama yang perlu kita pertimbangkan adalah reka bentuk grid tanpa akhir.
createNetuntuk menjana struktur data grid awal bersama-sama dalam artikel sebelumnya? fungsi ini menjana struktur data grid dengan bilangan garis grid yang terhingga. jadi bagaimana jika harga melampaui sempadan struktur data grid ini (di luar garis grid atas di mana harga adalah tertinggi, dan garis grid bawah di mana harga adalah terendah) apabila strategi berjalan? Jadi kita perlu menambah mekanisme lanjutan kepada struktur data grid terlebih dahulu.Mari kita mula menulis fungsi utama strategi, yang merupakan kod di mana strategi mula dilaksanakan
var diff = 50                                 // Global variables and grid spacing can be designed as parameters for easy explanation. We write this parameter into the code.
function main() {
    // After the real bot starts running, execute the strategy code from here
    var ticker = _C(exchange.GetTicker)       // To get the latest market data ticker, please refer to the FMZ API documentation for the structure of the ticker data: https://www.fmz.com/api#ticker
    var net = createNet(ticker.Last, diff)    // The function we designed in the previous article to construct the grid data structure initially, here we construct a grid data structure net

    while (true) {                            // Then the program logic enters this while infinite loop, and the strategy execution will continue to execute the code within the {} symbol here.
        ticker = _C(exchange.GetTicker)       // The first line of the infinite loop code section, get the latest market data and update it to the ticker variable
        // Check the grid range
        while (ticker.Last >= net[net.length - 1].price) {
            net.push({
                buy : false,
                sell : false,
                price : net[net.length - 1].price + diff,
            })
        }
        while (ticker.Last <= net[0].price) {
            var price = net[0].price - diff
            if (price <= 0) {
                break
            }
            net.unshift({
                buy : false,
                sell : false,
                price : price,
            })
        }

        // There are other codes...
    }
}
Membuat struktur data grid boleh diperluaskan adalah kod ini (dipetik dari kod di atas):
      // Check the grid range
      while (ticker.Last >= net[net.length - 1].price) {   // If the price exceeds the grid line of the highest price of the grid
          net.push({                                       // Just add a new grid line after the grid line with the highest price of the grid
              buy : false,                                 // Initialize sell marker
              sell : false,                                // Initialize buy marker
              price : net[net.length - 1].price + diff,    // dd a grid spacing to the previous highest price
          })
      }
      while (ticker.Last <= net[0].price) {                // If the price is lower than the grid line of the lowest price of the grid
          var price = net[0].price - diff                  // Different from adding upwards, it should be noted that the price of adding new grid lines downwards cannot be less than or equal to 0, so it is necessary to judge here
          if (price <= 0) {                                // Less than or equal to 0 will not be added, jump out of this loop
              break
          }
          net.unshift({                                    // Add a new grid line just before the grid line with the lowest price of the grid
              buy : false,
              sell : false,
              price : price,
          })
      }
Langkah seterusnya adalah untuk mempertimbangkan bagaimana untuk melaksanakan pencetus perdagangan secara khusus.
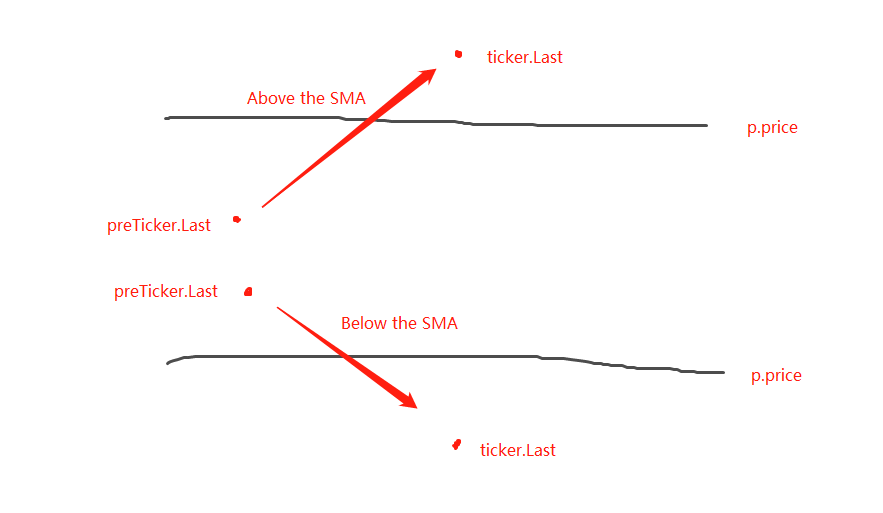
var diff = 50
var amount = 0.002       // Add a global variable, which can also be designed as a parameter. Of course, for the sake of simplicity, we also write it in the strategy code.
                         // This parameter controls the trade volume each time a trade is triggered on the grid line
function main() {
    var ticker = _C(exchange.GetTicker)
    var net = createNet(ticker.Last, diff)
    var preTicker = ticker       // Before the main loop (fixed loop) starts, set a variable to record the last market data
    while (true) {
        ticker = _C(exchange.GetTicker)
        // Check the grid range
        while (ticker.Last >= net[net.length - 1].price) {
            net.push({
                buy : false,
                sell : false,
                price : net[net.length - 1].price + diff,
            })
        }
        while (ticker.Last <= net[0].price) {
            var price = net[0].price - diff
            if (price <= 0) {
                break
            }
            net.unshift({
                buy : false,
                sell : false,
                price : price,
            })
        }

        // Retrieve grid
        for (var i = 0 ; i < net.length ; i++) {     // Iterate over all grid lines in the grid data structure
            var p = net[i]
            if (preTicker.Last < p.price && ticker.Last > p.price) {         // Above the SMA, sell, the current node has already traded, regardless of SELL BUY, it will no longer be traded
                if (i != 0) {
                    var downP = net[i - 1]
                    if (downP.buy) {
                        exchange.Sell(-1, amount, ticker)
                        downP.buy = false
                        p.sell = false
                        continue
                    }
                }
                if (!p.sell && !p.buy) {
                    exchange.Sell(-1, amount, ticker)
                    p.sell = true
                }
            } else if (preTicker.Last > p.price && ticker.Last < p.price) {  // Below the SMA, buy
                if (i != net.length - 1) {
                    var upP = net[i + 1]
                    if (upP.sell) {
                        exchange.Buy(-1, amount * ticker.Last, ticker)
                        upP.sell = false
                        p.buy = false
                        continue
                    }
                }
                if (!p.buy && !p.sell) {
                    exchange.Buy(-1, amount * ticker.Last, ticker)
                    p.buy = true
                }
            }
        }
        preTicker = ticker    // Record the current market data in preTicker, and in the next cycle, use it as a comparison between the "previous" market data and the latest one to judge whether to be above the SMA or below the SMA.
        Sleep(500)
    }
}
Ia boleh dilihat bahawa:
- Syarat untuk melintasi di atas garis grid:
preTicker.Last < p.price && ticker.Last > p.price - Syarat untuk melintasi di bawah garis grid:
preTicker.Last > p.price && ticker.Last < p.price
Inilah yang kami katakan dalam catatan sebelumnya:
- Syarat untuk melintasi di atas garis grid:
Menghakimi sama ada berada di atas SMA atau di bawah SMA hanyalah langkah pertama dalam menilai sama ada pesanan boleh diletakkan, dan juga perlu menilai tanda-tanda dalam data garis grid.
Jika ia di atas SMA, ia dihakimi bahawa harga adalah lebih rendah daripada garis grid semasa dan tanda beli pada garis grid terdekat. Jika nilai tanda beli adalah benar, ini bermakna bahawa garis grid sebelumnya telah dibeli, dan menetapkan semula tanda beli sebelumnya kepada palsu, dan menetapkan semula tanda jual garis grid semasa kepada palsu.
Selepas menilai keadaan, jika tidak ada pencetus, teruskan menilai. Jika tanda beli / jual pada garis grid semasa adalah salah, ini bermakna bahawa garis grid semasa boleh diperdagangkan. Oleh kerana ia di atas SMA, kita akan melakukan operasi jual di sini. Selepas pelaksanaan, tandakan tanda jual garis grid semasa benar.
Logik pemprosesan adalah sama untuk berada di bawah SMA (kiri untuk pemula untuk berfikir tentang di sini).
Ujian belakang strategi lengkap
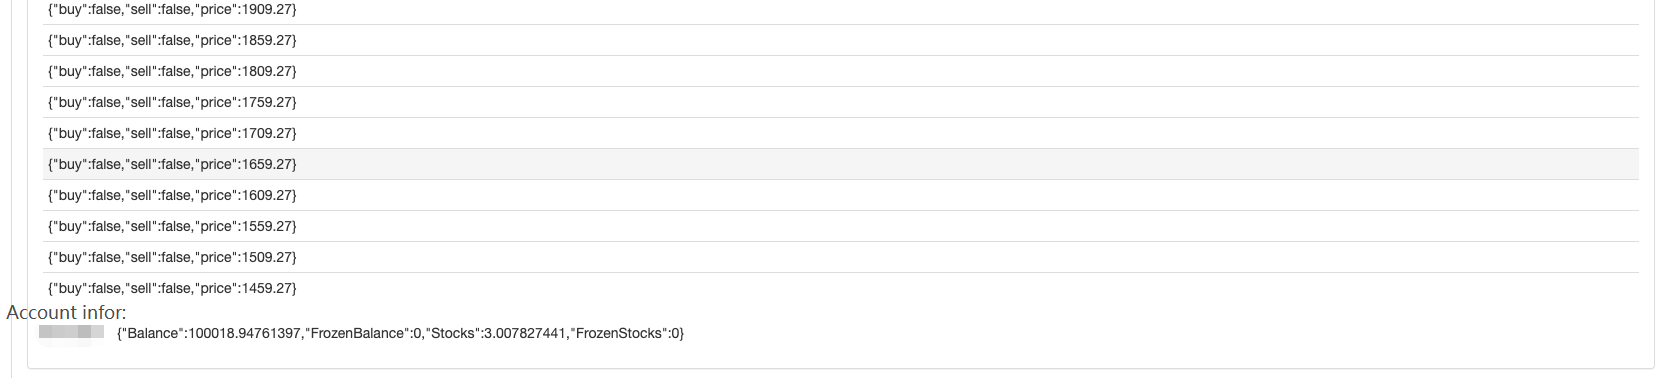
Untuk melihat beberapa data semasa backtesting, fungsishowTblditulis untuk memaparkan data.
function showTbl(arr) {
    var tbl = {
        type : "table",
        title : "grid",
        cols : ["grid information"],
        rows : []
    }
    var arrReverse = arr.slice(0).reverse()
    _.each(arrReverse, function(ele) {
        var color = ""
        if (ele.buy) {
            color = "#FF0000"
        } else if (ele.sell) {
            color = "#00FF00"
        }
        tbl.rows.push([JSON.stringify(ele) + color])
    })
    LogStatus(_D(), "\n`" + JSON.stringify(tbl) + "`", "\n account Information:", exchange.GetAccount())
}
Kod strategi lengkap:
/*backtest
start: 2021-04-01 22:00:00
end: 2021-05-22 00:00:00
period: 1d
basePeriod: 1m
exchanges: [{"eid":"OKEX","currency":"ETH_USDT","balance":100000}]
*/

var diff = 50
var amount = 0.002
function createNet(begin, diff) {
    var oneSideNums = 10
    var up = []
    var down = []
    for (var i = 0 ; i < oneSideNums ; i++) {
        var upObj = {
            buy : false,
            sell : false,
            price : begin + diff / 2 + i * diff,
        }
        up.push(upObj)

        var j = (oneSideNums - 1) - i
        var downObj = {
            buy : false,
            sell : false,
            price : begin - diff / 2 - j * diff,
        }
        if (downObj.price <= 0) {  // The price cannot be less than or equal to 0
            continue
        }
        down.push(downObj)
    }

    return down.concat(up)
}

function showTbl(arr) {
    var tbl = {
        type : "table",
        title : "grid",
        cols : ["grid Information"],
        rows : []
    }
    var arrReverse = arr.slice(0).reverse()
    _.each(arrReverse, function(ele) {
        var color = ""
        if (ele.buy) {
            color = "#FF0000"
        } else if (ele.sell) {
            color = "#00FF00"
        }
        tbl.rows.push([JSON.stringify(ele) + color])
    })
    LogStatus(_D(), "\n`" + JSON.stringify(tbl) + "`", "\n account Information:", exchange.GetAccount())
}

function main() {
    var ticker = _C(exchange.GetTicker)
    var net = createNet(ticker.Last, diff)
    var preTicker = ticker
    while (true) {
        ticker = _C(exchange.GetTicker)
        // Check the grid range
        while (ticker.Last >= net[net.length - 1].price) {
            net.push({
                buy : false,
                sell : false,
                price : net[net.length - 1].price + diff,
            })
        }
        while (ticker.Last <= net[0].price) {
            var price = net[0].price - diff
            if (price <= 0) {
                break
            }
            net.unshift({
                buy : false,
                sell : false,
                price : price,
            })
        }

        // Retrieve grid
        for (var i = 0 ; i < net.length ; i++) {
            var p = net[i]
            if (preTicker.Last < p.price && ticker.Last > p.price) {         // Being above the SMA, sell, the current node has already traded, regardless of SELL BUY, it will no longer be traded
                if (i != 0) {
                    var downP = net[i - 1]
                    if (downP.buy) {
                        exchange.Sell(-1, amount, ticker)
                        downP.buy = false
                        p.sell = false
                        continue
                    }
                }
                if (!p.sell && !p.buy) {
                    exchange.Sell(-1, amount, ticker)
                    p.sell = true
                }
            } else if (preTicker.Last > p.price && ticker.Last < p.price) {  // Being below the SMA, buy
                if (i != net.length - 1) {
                    var upP = net[i + 1]
                    if (upP.sell) {
                        exchange.Buy(-1, amount * ticker.Last, ticker)
                        upP.sell = false
                        p.buy = false
                        continue
                    }
                }
                if (!p.buy && !p.sell) {
                    exchange.Buy(-1, amount * ticker.Last, ticker)
                    p.buy = true
                }
            }
        }

        showTbl(net)
        preTicker = ticker
        Sleep(500)
    }
}
Pengujian strategi:
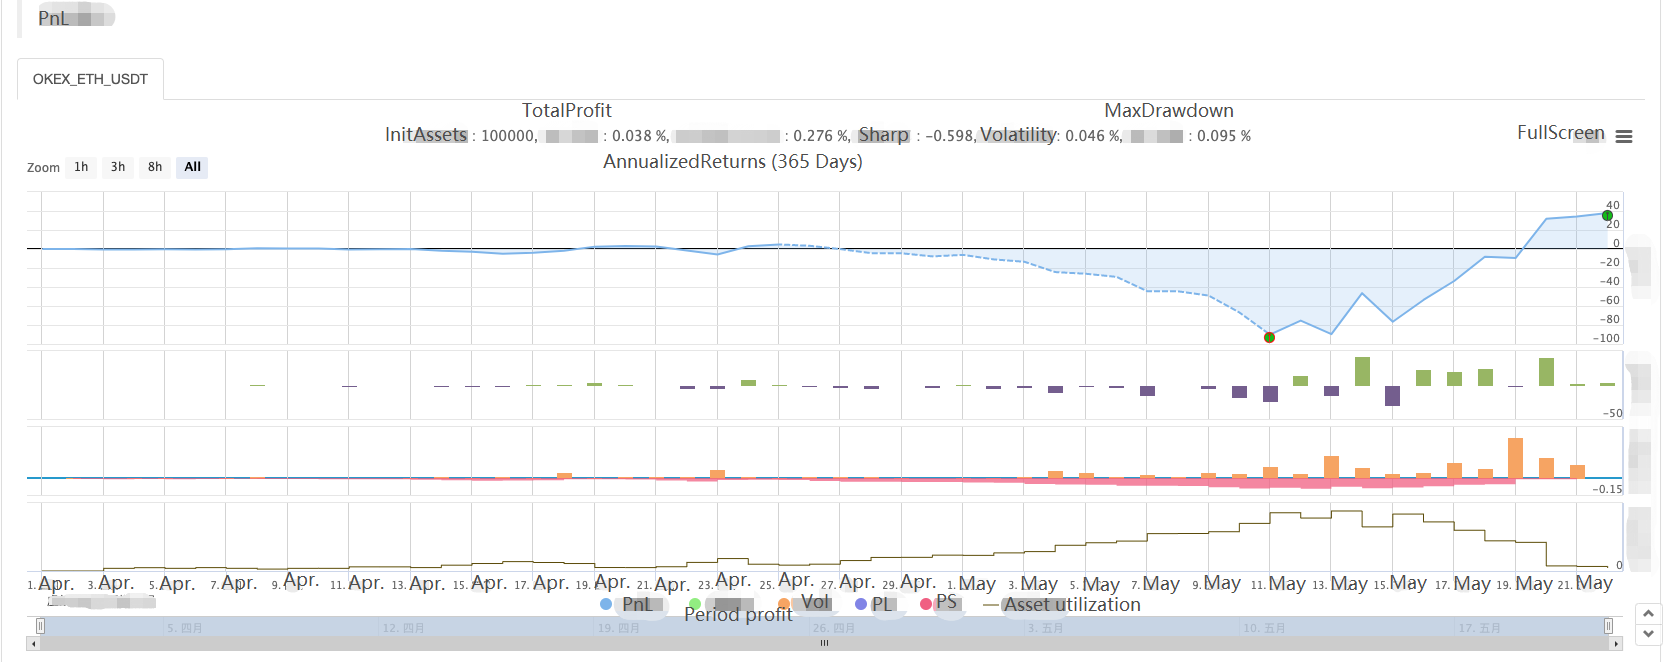
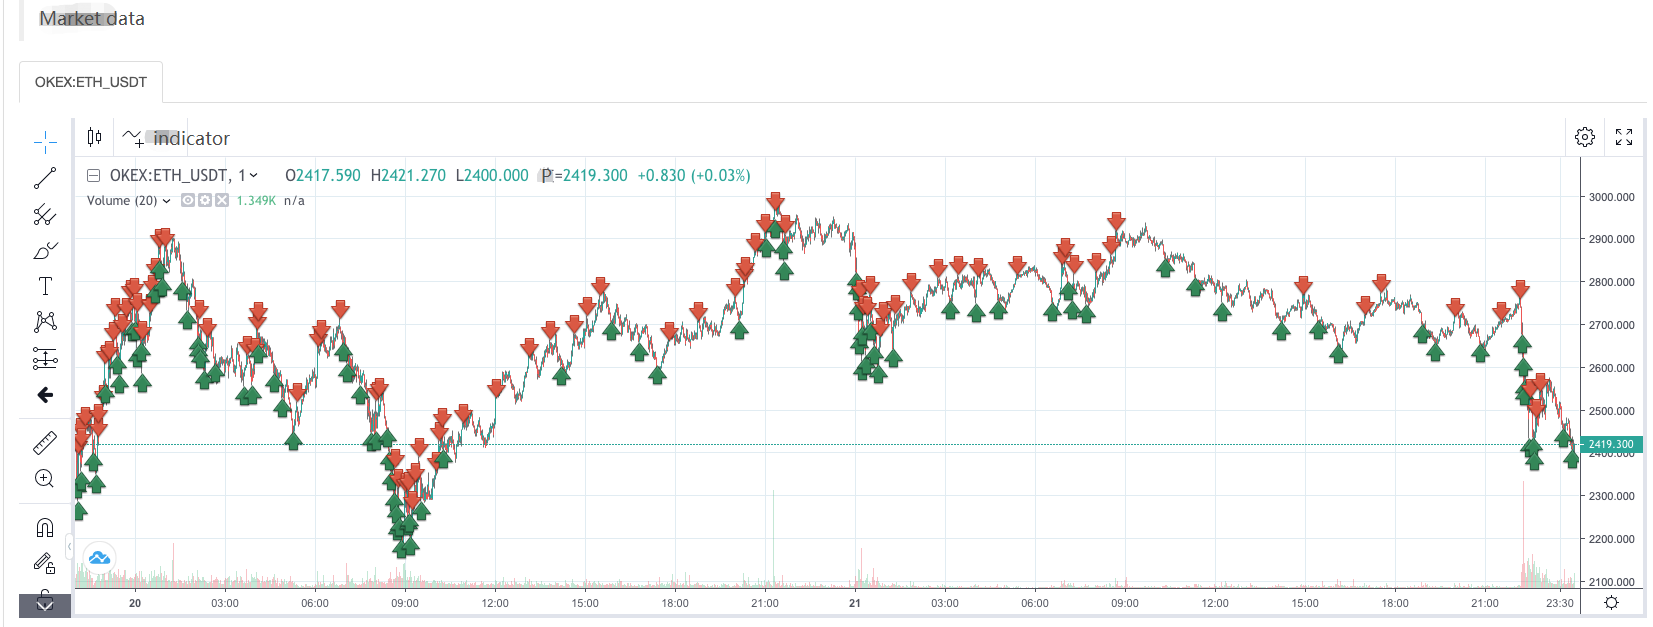
Jadi kita dapat melihat ciri-ciri strategi grid, apabila ada pasaran yang sedang berubah, akan ada kerugian terapung yang besar, dan keuntungan akan bangkit dalam pasaran yang tidak stabil.
Oleh itu, strategi grid tidak bebas risiko. Strategi spot masih boleh
- Mengukur Analisis Dasar di Pasaran Cryptocurrency: Biarkan Data Bercakap Sendiri!
- Perbincangan mengenai kajian kuantitatif asas dalam lingkaran mata wang - jangan mempercayai guru-guru sihir yang bodoh, data adalah objektif!
- Alat penting dalam bidang transaksi kuantitatif - Pencipta modul pencarian data kuantitatif
- Menguasai Semuanya - Pengenalan kepada FMZ Versi Baru Terminal Dagangan (dengan Kod Sumber Arbitraj TRB)
- Menguasai segala-galanya FMZ versi baru terminal perdagangan pengenalan (tambahan kod sumber TRB suite)
- FMZ Quant: Analisis Contoh Reka Bentuk Keperluan Umum di Pasaran Cryptocurrency (II)
- Bagaimana untuk mengeksploitasi bot jualan tanpa otak dengan strategi frekuensi tinggi dalam 80 baris kod
- FMZ Kuantitatif: Penyelesaian contoh reka bentuk permintaan biasa di pasaran mata wang kripto (II)
- Bagaimana untuk mengeksploitasi robot tanpa otak yang dijual dengan strategi frekuensi tinggi 80 baris kod
- FMZ Quant: Analisis Contoh Reka Bentuk Keperluan Umum di Pasaran Cryptocurrency (I)
- FMZ Kuantitatif: Penyelesaian contoh reka bentuk permintaan biasa di pasaran mata wang kripto