Gunakan fungsi KLineChart untuk membuat reka bentuk lukisan strategi lebih mudah
Penulis:Mimpi kecil, Dicipta: 2022-07-05 15:13:55, Dikemas kini: 2023-09-25 19:49:32
Gunakan fungsi KLineChart untuk membuat reka bentuk lukisan strategi lebih mudah
Apabila merancang strategi, ia sering diperlukan untuk merancang carta strategi untuk memaparkan, apabila menulis strategi dalam bahasa JavaScript, bahasa Python, pengguna yang tidak biasa dengan pengaturcaraan atau perpustakaan carta yang digunakan dalam platform FMZ sering bergelut dengan reka bentuk kod untuk menggambar carta tersuai.
Cara menggambar yang mudah dan kuat ini dapat dilihat dalam bahasa Pine, yang terkenal dengan fungsi menggambarnya yang kaya. Jika antara muka menggambar bahasa Pine dapat disambungkan ke strategi bahasa JavaScript dan Python, ia akan memudahkan fungsi menggambar strategi reka bentuk pemaju. Oleh itu, berdasarkan permintaan ini, platform FMZ telah menaik taraf fungsi menggambar tersuai dan memperluaskan cara untuk menggunakan aplikasi ini.KLineChartAnda boleh rujuk dokumentasi API di:https://www.fmz.com/api#klinechart
Mari kita mulakan dengan menulis contoh mudah menggunakan bahasa JavaScript untuk peralihan.
Contoh mudah
/*backtest
start: 2022-03-21 09:00:00
end: 2022-06-21 15:00:00
period: 30m
basePeriod: 15m
exchanges: [{"eid":"Binance","currency":"BTC_USDT"}]
*/

function main() {
    var c = KLineChart()
    while (true) {
        var bars = _C(exchange.GetRecords)
        for (var i = 0 ; i < bars.length ; i++) {
            var bar = bars[i]
            c.begin(bar)
            c.plot(bar.Volume, "Close")
            c.close()
        }
        Sleep(1000)
    }
}
Contoh ini sangat mudah, hanya melukis carta K-garis di kawasan lukisan tersuai strategi, dan melukis lengkung jumlah yang sepadan dengan setiap K-garis BAR di kedudukan sub-grafik carta.
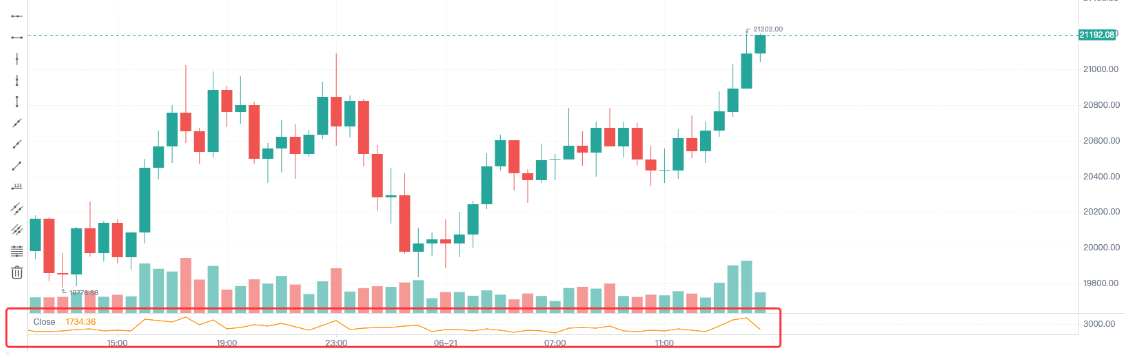
Dalam kod, kita menggunakanvar c = KLineChart()untuk membuat objek carta terlebih dahulu, dan kemudian menggunakan kaedahnya untuk melukis carta. Kemudian dalam gelung, kita mendapatkan data K-garis (struktur array), dan melintasi array K-garis. Ia boleh dilalui dengan menggunakan gelung sederhana seperti dalam contoh, atau ia boleh dilalui dengan cara lain.
Operasi lukisan bermula denganc.begin(bar)fungsi dan berakhir denganc.close()fungsi.begindanclosefungsi adalah semua kaedah objek carta c. Seterusnya, gunakan fungsi lukisan yang paling biasa digunakanplotuntuk melukis lengkung jumlah pada setiap BAR.
Contoh yang lebih kompleks
Katakan kita mahu merancang carta dengan penunjuk Bollinger yang disambungkan dan ia juga datang dengan carta jumlah setiap BAR, yang boleh direka seperti ini:
/*backtest
start: 2022-03-21 09:00:00
end: 2022-06-21 15:00:00
period: 1d
basePeriod: 1h
exchanges: [{"eid":"Binance","currency":"BTC_USDT"}]
*/

function main() {
    var c = KLineChart()

    // main strategy loop
    while(true) {
        // polling interval
        Sleep(500)

        // get K-line data
        let bars = exchange.GetRecords()
        if (!bars || bars.length <= 20) {
            continue
        }

        // calculate the Bollinger indicator
        var boll = TA.BOLL(bars)

        bars.forEach(function(bar, index) {
            c.begin(bar)
            // drawing operation
            c.plot(boll[0][index], "Boll_Up", {overlay: true})     // Draw on the main chart
            c.plot(boll[1][index], "Boll_Mid", {overlay: true})    // Draw on the main chart
            c.plot(boll[2][index], "Boll_Down", {overlay: true})   // Draw on the main chart
            c.plot(bar.Volume, "volume")                           // Draw on the sub-chart
            c.close()
        })

        // Strategy trading logic
        // ...
        // ..
    }
}
Seperti yang kita lihat dalam kod, maklumat konfigurasi backtest kami pada platform FMZ adalah:
/*backtest
start: 2022-03-21 09:00:00
end: 2022-06-21 15:00:00
period: 1d
basePeriod: 1h
exchanges: [{"eid":"Binance","currency":"BTC_USDT"}]
*/
Konfigurasi sedemikian adalah untuk menggunakan ujian backtesting objek pertukaran Binance spot. Kesan backtesting ditunjukkan sebagai berikut:
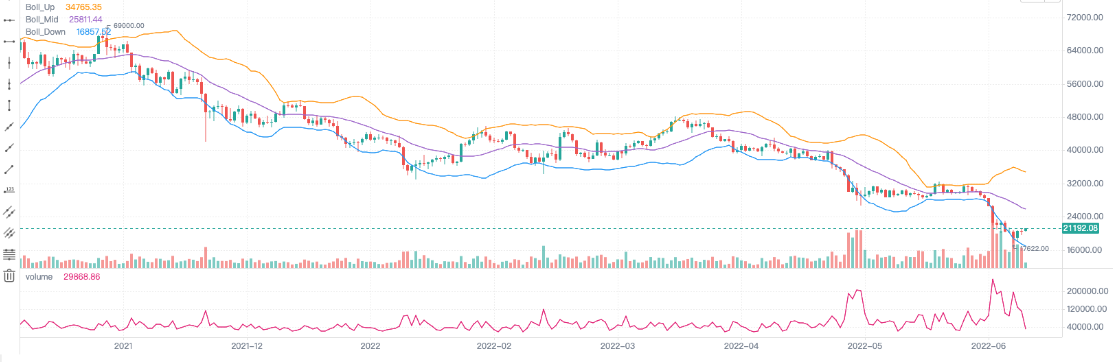
Kita boleh lihat bahawa kita menggunakan kaedah lukisan Pine
Menulis dalam penunjuk dan data lain untuk membuat carta
Operasi untuk mendapatkan data K-line dan mengira penunjuk adalah biasa dan mudah dalam contoh strategi di Platform Strategy Square dan dalam dokumentasi API.
        // obtain K-line data
        let bars = exchange.GetRecords()
        if (!bars || bars.length <= 20) {
            // If the acquisition of the K line fails, that is, if !bar is true, execute continue, ignore the following code, and re-execute the loop
            // If bars.length is less than or equal to 20, that is, the number of K-line BAR (bar) is less than 20, the indicator cannot be calculated, and continue is also executed
            continue
        }

        // Calculate the Bollinger indicator
        var boll = TA.BOLL(bars)
Fungsi pengiraan penunjuk Bollinger TA.BOLL, jika parameter penunjuk Bollinger tidak ditentukan, parameter lalaiBOLL(20, 2)Indikator Bollinger mempunyai tiga baris, jadi data yang dikembalikan oleh fungsi TA.BOLL adalah array dua dimensi. boll[0], boll[1], dan boll[2] adalah tiga elemen array boll, yang masing-masing mewakili garis dan merupakan array.
- boll[0]: Bollinger Bands baris ke atas
- boll[1]: Bollinger Bands midline
- boll[2]: Bollinger Bands garis bawah
Kemudian kita akan melihat bagaimana untuk menarik jumlah data K-garis, iaitu, jumlah, dan data penunjuk Bollinger dikira pada carta.
Kami melukis data K-garis Bar oleh Bar, jadi kita perlu merentasi seluruh K-garis array, iaitu, merentasi bar array dalam kod.forEachkaedah digunakan di sini untuk melintasi, atau loop for boleh digunakan untuk melintasi.
        bars.forEach(function(bar, index) {
            c.begin(bar)
            // Drawing operations
            c.plot(boll[0][index], "Boll_Up", {overlay: true})     // {overlay: true} Parameter control, drawn on the main chart
            c.plot(boll[1][index], "Boll_Mid", {overlay: true})    // Draw on the main chart
            c.plot(boll[2][index], "Boll_Down", {overlay: true})   // Draw on the main chart
            c.plot(bar.Volume, "volume")                           // Draw on the sub-chart
            c.close()
        })
Perlu diperhatikan bahawa setiap kali anda memulakan operasi lukisan carta pada Bar, anda mesti membuatc.begin(bar)panggilan fungsi pertama.beginfungsi adalah salah satu daripada objek carta kita c kaedah.c.close()perlu dipanggil. Antarabeginfungsi danclosefungsi adalah fungsi lukisan yang kita panggil serupa dengan kaedah lukisan bahasa Pine.barcolor bgcolor plot fill hline plotarrow plotshape plotchar plotcandle signal, anda boleh melukis garis, anak panah, tanda maklumat, dan lain-lain. Parameter fungsi ini adalah sama dengan parameter fungsi yang sepadan dengan bahasa Pine, dan fungsi lukisan juga sama.
Tambah lukisan anak panah isyarat dagangan, penanda, garis mendatar, dll.
Tambah beberapa anak panah isyarat perdagangan, penanda, garis mendatar kepada contoh carta Bollinger Bands di atas.
/*backtest
start: 2022-03-21 09:00:00
end: 2022-06-21 15:00:00
period: 1d
basePeriod: 1h
exchanges: [{"eid":"Binance","currency":"BTC_USDT"}]
*/

function main() {
    var c = KLineChart({overlay : true})

    // Strategy main loop
    while(true) {
        // Polling interval
        Sleep(500)

        // Obtain K-line data
        let bars = exchange.GetRecords()
        if (!bars || bars.length <= 20) {
            continue
        }

        // Calculate Bollinger indicator
        var boll = TA.BOLL(bars)

        bars.forEach(function(bar, index) {
            c.begin(bar)
            // Drawing operations
            c.plot(boll[0][index], "Boll_Up", {overlay: true})     // Draw on the main chart
            c.plot(boll[1][index], "Boll_Mid", {overlay: true})    // Draw on the main chart
            c.plot(boll[2][index], "Boll_Down", {overlay: true})   // Draw on the main chart
            c.plot(bar.Volume, "volume", {overlay: false})         // Draw on the sub-chart

            c.hline(bar.Open, {overlay: true})                          // Horizontal line
            c.plotarrow(bar.Close - bar.Open, {overlay: true})          // Arrow
            c.plotshape(bar.Close - bar.Open > 0, {style: 'square'})    // Draw square markers
            c.plotchar(bar.Close - bar.Open < 0, {char: 'X'})           // Draw the character X

            c.close()
        })

        // Strategy trading logic
        // ...
        // ..
    }
}

Objek konfigurasi carta
Struktur boleh diisytiharkan untuk mengkonfigurasi gaya carta. Sebagai contoh, pembolehubah chartCfg berikut mewakili maklumat konfigurasi garis grid.
    var chartCfg = {
        grid: {
            show: true,
            // Grid horizontal line
            horizontal: {
                show: true,
                size: 2,
                color: '#FF0000',    // Color of horizontal grid line
                // 'solid'|'dash'
                style: 'dash',       // Type of line
                dashValue: [2, 2]
            },
   	        // Grid vertical line
            vertical: {
                show: true,
                size: 2,
                color: '#32CD32',
                // 'solid'|'dash'
                style: 'solid',
                dashValue: [2, 2]
            }
        },
    }
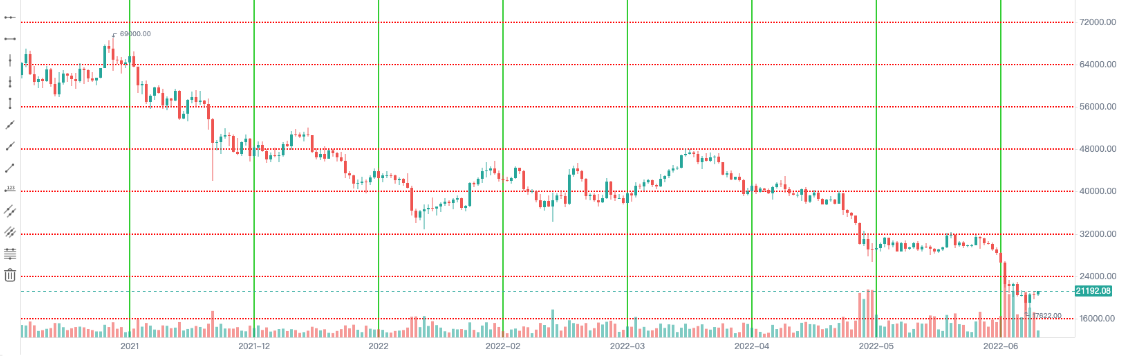
Objek konfigurasi carta adalah struktur data yang menetapkan beberapa sifat dan penampilan carta. Sebagai contoh, konfigurasi gaya garisan grid digunakan dalam contoh. Terdapat juga banyak pilihan yang boleh dikonfigurasi dan diubah suai, seperti tetikus X, tetikus Y yang berkaitan dengan tetapan, tetapan garis kursor, tetapan mesej amaran, tetapan gaya penunjuk teknikal, tetapan gaya BAR K-line, dll.
Sudah tentu, jika anda tidak biasa dengan ini, anda tidak boleh lulus dalam objek konfigurasi carta apabila memanggilKLineChartfungsi untuk mencipta objek carta. Kemudian carta yang dicipta adalah gaya lalai. Gunakan fungsi APIKLineChartfungsi platform FMZ untuk membuat objek carta:
var c = KLineChart(chartCfg)
Kod ujian untuk melukis garis grid:
/*backtest
start: 2022-03-21 09:00:00
end: 2022-06-21 15:00:00
period: 1d
basePeriod: 1h
exchanges: [{"eid":"Binance","currency":"BTC_USDT"}]
*/

function main() {
    var chartCfg = {
        grid: {
            show: true,
            // Grid horizontal line
            horizontal: {
                show: true,
                size: 2,
                color: '#FF0000',
                // 'solid'|'dash'
                style: 'dash',
                dashValue: [2, 2]
            },
   	        // Grid vertical line
            vertical: {
                show: true,
                size: 2,
                color: '#32CD32',
                // 'solid'|'dash'
                style: 'solid',
                dashValue: [2, 2]
            }
        },
    }

    var c = KLineChart(chartCfg)

    // Strategy main loop
    while(true) {
        // Polling interval
        Sleep(500)

        // Obtain K-line data
        var bars = _C(exchange.GetRecords)
        bars.forEach(function(bar, index) {
            c.begin(bar)
            c.close()
        })

        // Strategy trading logic
        // ...
        // ..
    }
}
Contoh gaya konfigurasi carta
Ia boleh digunakan untuk merujuk kepada tetapan gaya konfigurasi carta.
{
// Gridlines
grid: {
show: true,
// Grid horizontal line
horizontal: {
show: true,
size: 1,
color: '#393939',
// 'solid'|'dash'
style: 'dash',
dashValue: [2, 2]
},
// Grid vertical line
vertical: {
show: false,
size: 1,
color: '#393939',
// 'solid'|'dash'
style: 'dash',
dashValue: [2, 2]
}
},
// Candlestick chart
candle: {
// The distance between the top and bottom of the candlestick chart, greater than 1 is the absolute value, greater than 0, and 1 is the proportion
margin: {
top: 0.2,
bottom: 0.1
},
// Type of Candlestick Charts 'candle_solid'|'candle_stroke'|'candle_up_stroke'|'candle_down_stroke'|'ohlc'|'area'
type: 'candle_solid',
// Candle pillar
bar: {
upColor: '#26A69A',
downColor: '#EF5350',
noChangeColor: '#888888'
},
// Area map
area: {
lineSize: 2,
lineColor: '#2196F3',
value: 'close',
backgroundColor: [{
offset: 0,
color: 'rgba(33, 150, 243, 0.01)'
}, {
offset: 1,
color: 'rgba(33, 150, 243, 0.2)'
}]
},
priceMark: {
show: true,
// Highest price marker
high: {
show: true,
color: '#D9D9D9',
textMargin: 5,
textSize: 10,
textFamily: 'Helvetica Neue',
textWeight: 'normal'
},
// Lowest price marker
low: {
show: true,
color: '#D9D9D9',
textMargin: 5,
textSize: 10,
textFamily: 'Helvetica Neue',
textWeight: 'normal',
},
// Latest price marker
last: {
show: true,
upColor: '#26A69A',
downColor: '#EF5350',
noChangeColor: '#888888',
line: {
show: true,
// 'solid'|'dash'
style: 'dash',
dashValue: [4, 4],
size: 1
},
text: {
show: true,
size: 12,
paddingLeft: 2,
paddingTop: 2,
paddingRight: 2,
paddingBottom: 2,
color: '#FFFFFF',
family: 'Helvetica Neue',
weight: 'normal',
borderRadius: 2
}
}
},
// Tips
tooltip: {
// 'always' | 'follow_cross' | 'none'
showRule: 'always',
// 'standard' | 'rect'
showType: 'standard',
labels: ['time', 'open', 'close', 'high', 'low', 'volume'],
values: null,
defaultValue: 'n/a',
rect: {
paddingLeft: 0,
paddingRight: 0,
paddingTop: 0,
paddingBottom: 6,
offsetLeft: 8,
offsetTop: 8,
offsetRight: 8,
borderRadius: 4,
borderSize: 1,
borderColor: '#3f4254',
backgroundColor: 'rgba(17, 17, 17, .3)'
},
text: {
size: 12,
family: 'Helvetica Neue',
weight: 'normal',
color: '#D9D9D9',
marginLeft: 8,
marginTop: 6,
marginRight: 8,
marginBottom: 0
}
}
},
// Technical indicators
technicalIndicator: {
margin: {
top: 0.2,
bottom: 0.1
},
bar: {
upColor: '#26A69A',
downColor: '#EF5350',
noChangeColor: '#888888'
},
line: {
size: 1,
colors: ['#FF9600', '#9D65C9', '#2196F3', '#E11D74', '#01C5C4']
},
circle: {
upColor: '#26A69A',
downColor: '#EF5350',
noChangeColor: '#888888'
},
// Latest value marker
lastValueMark: {
show: false,
text: {
show: false,
color: '#ffffff',
size: 12,
family: 'Helvetica Neue',
weight: 'normal',
paddingLeft: 3,
paddingTop: 2,
paddingRight: 3,
paddingBottom: 2,
borderRadius: 2
}
},
// Tips
tooltip: {
// 'always' | 'follow_cross' | 'none'
showRule: 'always',
// 'standard' | 'rect'
showType: 'standard',
showName: true,
showParams: true,
defaultValue: 'n/a',
text: {
size: 12,
family: 'Helvetica Neue',
weight: 'normal',
color: '#D9D9D9',
marginTop: 6,
marginRight: 8,
marginBottom: 0,
marginLeft: 8
}
}
},
// x-axis
xAxis: {
show: true,
height: null,
// x-axis line
axisLine: {
show: true,
color: '#888888',
size: 1
},
// x-axis split text
tickText: {
show: true,
color: '#D9D9D9',
family: 'Helvetica Neue',
weight: 'normal',
size: 12,
paddingTop: 3,
paddingBottom: 6
},
// x-axis split line
tickLine: {
show: true,
size: 1,
length: 3,
color: '#888888'
}
},
// y-axis
yAxis: {
show: true,
width: null,
// 'left' | 'right'
position: 'right',
// 'normal' | 'percentage' | 'log'
type: 'normal',
inside: false,
reverse: false,
// y-axis line
axisLine: {
show: true,
color: '#888888',
size: 1
},
// y-axis split text
tickText: {
show: true,
color: '#D9D9D9',
family: 'Helvetica Neue',
weight: 'normal',
size: 12,
paddingLeft: 3,
paddingRight: 6
},
// y-axis split line
tickLine: {
show: true,
size: 1,
length: 3,
color: '#888888'
}
},
// Split line between charts
separator: {
size: 1,
color: '#888888',
fill: true,
activeBackgroundColor: 'rgba(230, 230, 230, .15)'
},
// Crosshair
crosshair: {
show: true,
// Horizontal line and text of crosshair
horizontal: {
show: true,
line: {
show: true,
// 'solid'|'dash'
style: 'dash',
dashValue: [4, 2],
size: 1,
color: '#888888'
},
text: {
show: true,
color: '#D9D9D9',
size: 12,
family: 'Helvetica Neue',
weight: 'normal',
paddingLeft: 2,
paddingRight: 2,
paddingTop: 2,
paddingBottom: 2,
borderSize: 1,
borderColor: '#505050',
borderRadius: 2,
backgroundColor: '#505050'
}
},
// Vertical line and text of crosshair
vertical: {
show: true,
line: {
show: true,
// 'solid'|'dash'
style: 'dash',
dashValue: [4, 2],
size: 1,
color: '#888888'
},
text: {
show: true,
color: '#D9D9D9',
size: 12,
family: 'Helvetica Neue',
weight: 'normal',
paddingLeft: 2,
paddingRight: 2,
paddingTop: 2,
paddingBottom: 2,
borderSize: 1,
borderColor: '#505050',
borderRadius: 2,
backgroundColor: '#505050'
}
}
},
// Graph
shape: {
point: {
backgroundColor: '#2196F3',
borderColor: '#2196F3',
borderSize: 1,
radius: 4,
activeBackgroundColor: '#2196F3',
activeBorderColor: '#2196F3',
activeBorderSize: 1,
activeRadius: 6
},
line: {
// 'solid'|'dash'
style: 'solid'
color: '#2196F3',
size: 1,
dashValue: [2, 2]
},
polygon: {
// 'stroke'|'fill'
style: 'stroke',
stroke: {
// 'solid'|'dash'
style: 'solid',
size: 1,
color: '#2196F3',
dashValue: [2, 2]
},
fill: {
color: 'rgba(33, 150, 243, 0.1)'
}
},
arc: {
// 'stroke'|'fill'
style: 'stroke',
stroke: {
// 'solid'|'dash'
style: 'solid',
size: 1,
color: '#2196F3',
dashValue: [2, 2]
},
fill: {
color: '#2196F3'
}
},
text: {
style: 'fill',
color: '#2196F3',
size: 12,
family: 'Helvetica Neue',
weight: 'normal',
offset: [0, 0]
}
},
annotation: {
// 'top' | 'bottom' | 'point'
position: 'top',
offset: [20, 0]
symbol: {
// 'diamond' | 'circle' | 'rect' | 'triangle' | 'custom' | 'none'
type: 'diamond',
size: 8,
color: '#2196F3',
activeSize: 10,
activeColor: '#FF9600'
}
},
tag: {
// 'top' | 'bottom' | 'point'
position: 'point',
offset: 0,
line: {
show: true,
style: LineStyle.DASH,
dashValue: [4, 2],
size: 1,
color: '#2196F3'
},
text: {
color: '#FFFFFF',
backgroundColor: '#2196F3',
size: 12,
family: 'Helvetica Neue',
weight: 'normal',
paddingLeft: 2,
paddingRight: 2,
paddingTop: 2,
paddingBottom: 2,
borderRadius: 2,
borderSize: 1,
borderColor: '#2196F3'
},
mark: {
offset: 0,
color: '#FFFFFF',
backgroundColor: '#2196F3',
size: 12,
family: 'Helvetica Neue',
weight: 'normal',
paddingLeft: 2,
paddingRight: 2,
paddingTop: 2,
paddingBottom: 2,
borderRadius: 2,
borderSize: 1,
borderColor: '#2196F3'
}
}
}
Bukankah ini menjadikan reka bentuk strategi yang lebih mudah?
- Mengukur Analisis Dasar di Pasaran Cryptocurrency: Biarkan Data Bercakap Sendiri!
- Perbincangan mengenai kajian kuantitatif asas dalam lingkaran mata wang - jangan mempercayai guru-guru sihir yang bodoh, data adalah objektif!
- Alat penting dalam bidang transaksi kuantitatif - Pencipta modul pencarian data kuantitatif
- Menguasai Semuanya - Pengenalan kepada FMZ Versi Baru Terminal Dagangan (dengan Kod Sumber Arbitraj TRB)
- Menguasai segala-galanya FMZ versi baru terminal perdagangan pengenalan (tambahan kod sumber TRB suite)
- FMZ Quant: Analisis Contoh Reka Bentuk Keperluan Umum di Pasaran Cryptocurrency (II)
- Bagaimana untuk mengeksploitasi bot jualan tanpa otak dengan strategi frekuensi tinggi dalam 80 baris kod
- FMZ Kuantitatif: Penyelesaian contoh reka bentuk permintaan biasa di pasaran mata wang kripto (II)
- Bagaimana untuk mengeksploitasi robot tanpa otak yang dijual dengan strategi frekuensi tinggi 80 baris kod
- FMZ Quant: Analisis Contoh Reka Bentuk Keperluan Umum di Pasaran Cryptocurrency (I)
- FMZ Kuantitatif: Penyelesaian contoh reka bentuk permintaan biasa di pasaran mata wang kripto