"Magic Double EMA Strategy" daripada Veteran YouTube
Penulis:Lydia, Dicipta: 2022-11-07 12:02:31, Dikemas kini: 2023-09-15 20:51:23
Magic Double EMA Strategy daripada Veteran YouTube
Dalam isu ini, kami akan membincangkan
Penunjuk yang digunakan oleh strategi
- Indikator EMA
Demi kesederhanaan reka bentuk, kita tidak akan menggunakan Eksponensial Purata Bergerak yang disenaraikan dalam video, kita akan menggunakan ta.ema terbina dalam pandangan perdagangan sebaliknya (ia sebenarnya sama).
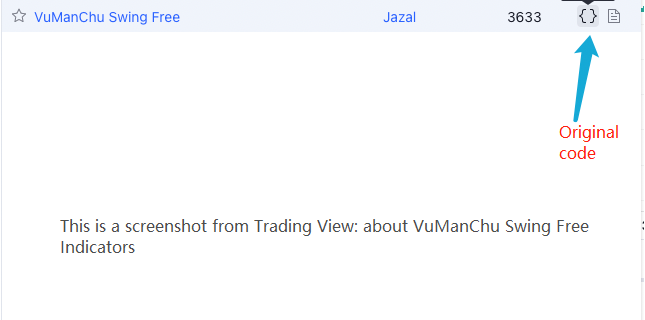
- VuManChu Swing Free Indikator
Ini adalah penunjuk pada Trading View, kita perlu pergi ke Trading View dan mengambil kod sumber.
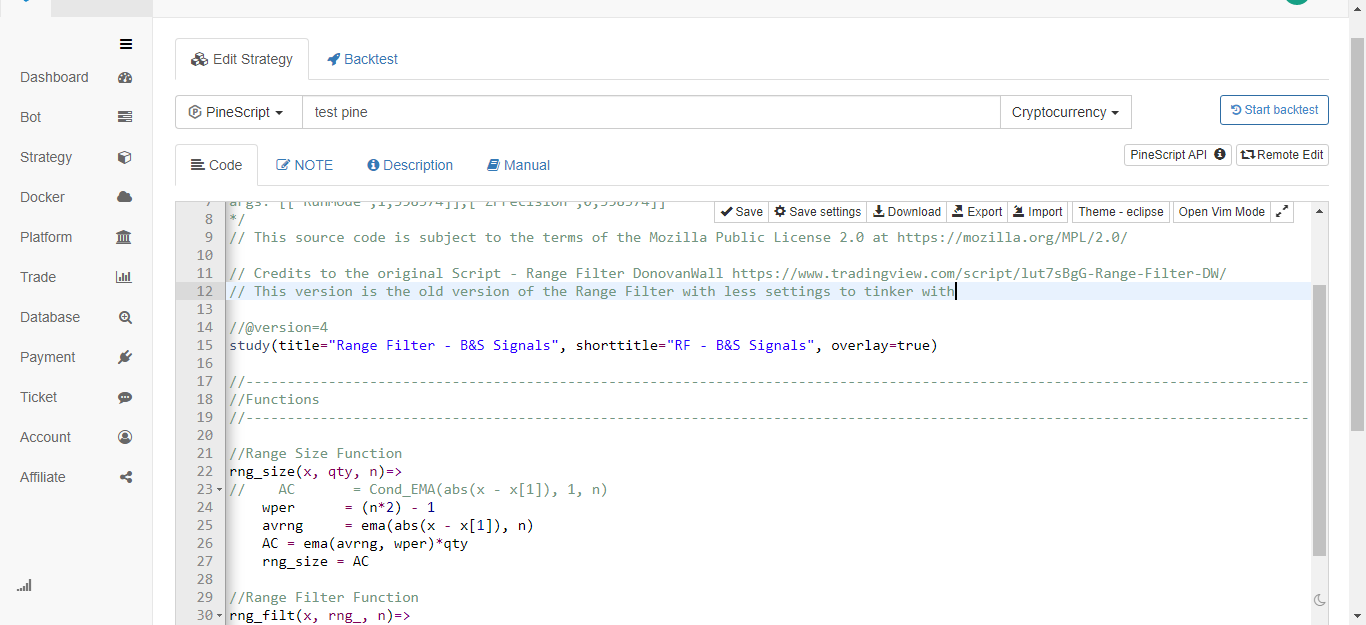
Kod VuManChu Swing Free:
// This source code is subject to the terms of the Mozilla Public License 2.0 at https://mozilla.org/MPL/2.0/

// Credits to the original Script - Range Filter DonovanWall https://www.tradingview.com/script/lut7sBgG-Range-Filter-DW/
// This version is the old version of the Range Filter with less settings to tinker with

//@version=4
study(title="Range Filter - B&S Signals", shorttitle="RF - B&S Signals", overlay=true)

//-----------------------------------------------------------------------------------------------------------------------------------------------------------------
//Functions
//-----------------------------------------------------------------------------------------------------------------------------------------------------------------

//Range Size Function
rng_size(x, qty, n)=>
//    AC       = Cond_EMA(abs(x - x[1]), 1, n)
    wper      = (n*2) - 1
    avrng     = ema(abs(x - x[1]), n)
    AC = ema(avrng, wper)*qty
    rng_size = AC

//Range Filter Function
rng_filt(x, rng_, n)=>
    r          = rng_
    var rfilt  = array.new_float(2, x)
    array.set(rfilt, 1, array.get(rfilt, 0))
    if x - r > array.get(rfilt, 1)
        array.set(rfilt, 0, x - r)
    if x + r < array.get(rfilt, 1)
        array.set(rfilt, 0, x + r)
    rng_filt1 = array.get(rfilt, 0)

    hi_band   = rng_filt1 + r
    lo_band   = rng_filt1 - r
    rng_filt  = rng_filt1
    [hi_band, lo_band, rng_filt]

//-----------------------------------------------------------------------------------------------------------------------------------------------------------------
//Inputs
//-----------------------------------------------------------------------------------------------------------------------------------------------------------------

//Range Source
rng_src = input(defval=close, type=input.source, title="Swing Source")

//Range Period
rng_per = input(defval=20, minval=1, title="Swing Period")

//Range Size Inputs
rng_qty   = input(defval=3.5, minval=0.0000001, title="Swing Multiplier")

//Bar Colors
use_barcolor = input(defval=false, type=input.bool, title="Bar Colors On/Off")

//-----------------------------------------------------------------------------------------------------------------------------------------------------------------
//Definitions
//-----------------------------------------------------------------------------------------------------------------------------------------------------------------

//Range Filter Values
[h_band, l_band, filt] = rng_filt(rng_src, rng_size(rng_src, rng_qty, rng_per), rng_per)

//Direction Conditions
var fdir = 0.0
fdir    := filt > filt[1] ? 1 : filt < filt[1] ? -1 : fdir
upward   = fdir==1 ? 1 : 0
downward = fdir==-1 ? 1 : 0

//Trading Condition
longCond = rng_src > filt and rng_src > rng_src[1] and upward > 0 or rng_src > filt and rng_src < rng_src[1] and upward > 0
shortCond = rng_src < filt and rng_src < rng_src[1] and downward > 0 or rng_src < filt and rng_src > rng_src[1] and downward > 0

CondIni = 0
CondIni := longCond ? 1 : shortCond ? -1 : CondIni[1]
longCondition = longCond and CondIni[1] == -1
shortCondition = shortCond and CondIni[1] == 1

//Colors
filt_color = upward ? #05ff9b : downward ? #ff0583 : #cccccc
bar_color  = upward and (rng_src > filt) ? (rng_src > rng_src[1] ? #05ff9b : #00b36b) :
             downward and (rng_src < filt) ? (rng_src < rng_src[1] ? #ff0583 : #b8005d) : #cccccc

//-----------------------------------------------------------------------------------------------------------------------------------------------------------------
//Outputs
//-----------------------------------------------------------------------------------------------------------------------------------------------------------------

//Filter Plot
filt_plot = plot(filt, color=filt_color, transp=67, linewidth=3, title="Filter")

//Band Plots
h_band_plot = plot(h_band, color=color.new(#05ff9b, 100), title="High Band")
l_band_plot = plot(l_band, color=color.new(#ff0583, 100), title="Low Band")

//Band Fills
fill(h_band_plot, filt_plot, color=color.new(#00b36b, 92), title="High Band Fill")
fill(l_band_plot, filt_plot, color=color.new(#b8005d, 92), title="Low Band Fill")

//Bar Color
barcolor(use_barcolor ? bar_color : na)

//Plot Buy and Sell Labels
plotshape(longCondition, title = "Buy Signal", text ="BUY", textcolor = color.white, style=shape.labelup, size = size.normal, location=location.belowbar, color = color.new(color.green, 0))
plotshape(shortCondition, title = "Sell Signal", text ="SELL", textcolor = color.white, style=shape.labeldown, size = size.normal, location=location.abovebar, color = color.new(color.red, 0))

//Alerts
alertcondition(longCondition, title="Buy Alert", message = "BUY")
alertcondition(shortCondition, title="Sell Alert", message = "SELL")
Logika Strategi
Indikator EMA: strategi menggunakan dua EMA, satu adalah garis cepat (parameter tempoh kecil) dan yang lain adalah garis perlahan (parameter tempoh besar).
-
perjanjian kedudukan panjang Garis cepat berada di atas garis perlahan.
-
perjanjian kedudukan pendek Garis laju berada di bawah garis perlahan.
Indikator VuManChu Swing Free: Indikator VuManChu Swing Free digunakan untuk menghantar isyarat dan menilai sama ada untuk meletakkan pesanan dalam kombinasi dengan keadaan lain. Ia dapat dilihat dari kod sumber indikator VuManChu Swing Free bahawa pembolehubah longCondition mewakili isyarat membeli dan pembolehubah shortCondition mewakili isyarat menjual. Kedua-dua pembolehubah ini akan digunakan untuk penulisan keadaan pesanan seterusnya.
Sekarang mari kita bercakap tentang keadaan pencetus khusus isyarat perdagangan:
-
Peraturan untuk memasuki kedudukan panjang: Harga penutupan garis K positif harus berada di atas garis cepat EMA, kedua-dua EMA harus menjadi kedudukan panjang (garis cepat di atas garis perlahan), dan penunjuk VuManChu Swing Free harus menunjukkan isyarat beli (longCondition adalah benar).
-
Peraturan untuk memasuki kedudukan pendek (berbeza dengan kedudukan panjang): Harga penutupan garis K negatif harus berada di bawah garis pantas EMA, kedua-dua EMA harus menjadi kedudukan pendek (garis pantas di bawah garis perlahan), dan penunjuk VuManChu Swing Free harus menunjukkan isyarat jual (shortCondition adalah benar).
Adakah logik perdagangan sangat mudah? Oleh kerana video sumber tidak menentukan profit stop dan loss stop, saya akan menggunakan moderat profit stop dan loss stop kaedah bebas, menggunakan titik tetap untuk stop loss, dan mengesan profit stop.
Reka bentuk kod
Kod untuk indikator VuManChu Swing Free, kami masukkan ke dalam kod strategi kami secara langsung tanpa sebarang perubahan.
Kemudian sejurus selepas itu, kita menulis sekeping kod bahasa Pine yang melaksanakan fungsi perdagangan:
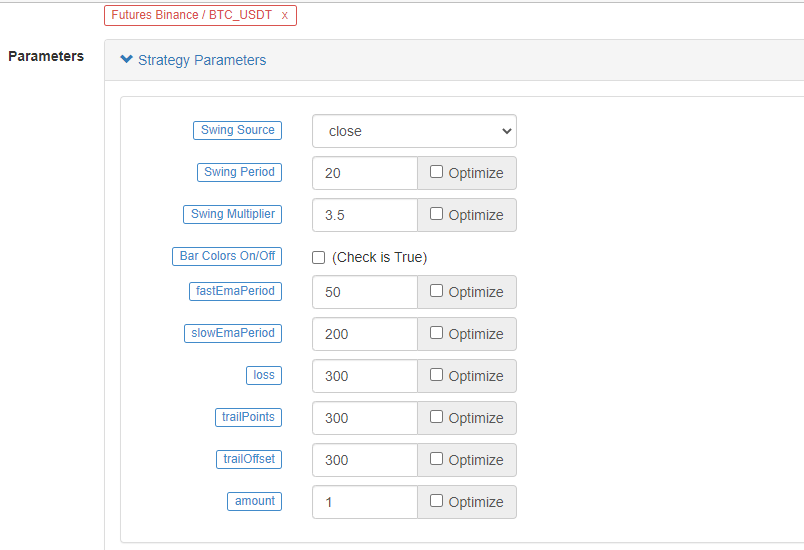
// extend
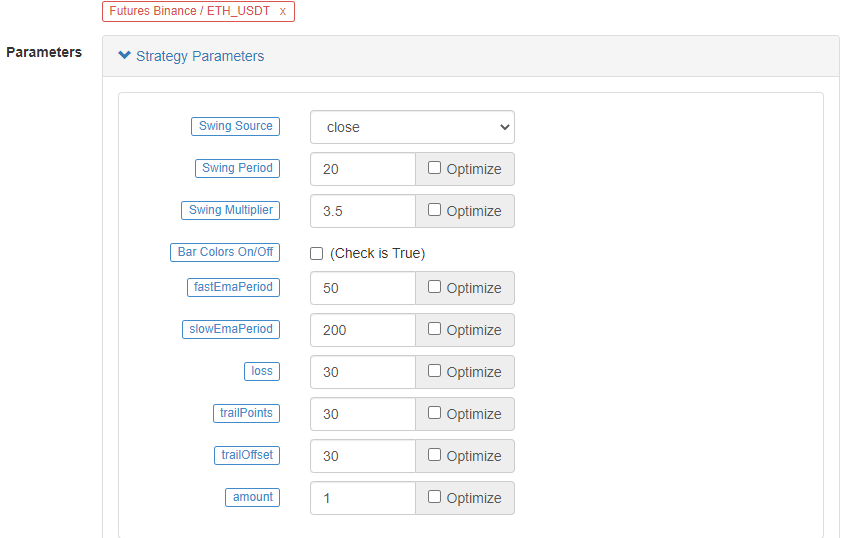
fastEmaPeriod = input(50, "fastEmaPeriod") // fast line period
slowEmaPeriod = input(200, "slowEmaPeriod") // slow line period
loss = input(30, "loss") // stop loss points
trailPoints = input(30, "trailPoints") // number of trigger points for moving stop loss
trailOffset = input(30, "trailOffset") // moving stop profit offset (points)
amount = input(1, "amount") // order amount
emaFast = ta.ema(close, fastEmaPeriod) // calculate the fast line EMA
emaSlow = ta.ema(close, slowEmaPeriod) // calculate the slow line EMA
buyCondition = longCondition and emaFast > emaSlow and close > open and close > emaFast // entry conditions for long positions
sellCondition = shortCondition and emaFast < emaSlow and close < open and close < emaFast // entry conditions for short positions
if buyCondition and strategy.position_size == 0
strategy.entry("long", strategy.long, amount)
strategy.exit("exit_long", "long", amount, loss=loss, trail_points=trailPoints, trail_offset=trailOffset)
if sellCondition and strategy.position_size == 0
strategy.entry("short", strategy.short, amount)
strategy.exit("exit_short", "short", amount, loss=loss, trail_points=trailPoints, trail_offset=trailOffset)
A.Itdapat dilihat bahawa apabila buyCondition adalah benar, iaitu:
- Variabel longCondition benar (Penunjuk VuManChu Swing Free menghantar isyarat kedudukan panjang).
- emaFast > emaSlow (penyesuaian kedudukan panjang EMA).
- close > open (bererti BAR semasa positif), close > emaFast (bererti harga penutupan di atas garis pantas EMA).
Tiga syarat untuk bertahan lama.
B.Apabila sellCondition adalah benar, tiga syarat untuk membuat kedudukan pendek berlaku (tidak diulangi di sini).
Kemudian kita menggunakan fungsi strategi.entry untuk memasuki dan membuka kedudukan dalam kes jika keadaan penghakiman isyarat pencetus, dan menetapkanstrategy.exitfungsi untuk menghentikan kerugian dan jejak keuntungan pada masa yang sama.
Kod Lengkap
/*backtest
start: 2022-01-01 00:00:00
end: 2022-10-08 00:00:00
period: 15m
basePeriod: 5m
exchanges: [{"eid":"Futures_Binance","currency":"ETH_USDT"}]
args: [["ZPrecision",0,358374]]
*/

// This source code is subject to the terms of the Mozilla Public License 2.0 at https://mozilla.org/MPL/2.0/

// Credits to the original Script - Range Filter DonovanWall https://www.tradingview.com/script/lut7sBgG-Range-Filter-DW/
// This version is the old version of the Range Filter with less settings to tinker with

//@version=4
study(title="Range Filter - B&S Signals", shorttitle="RF - B&S Signals", overlay=true)

//-----------------------------------------------------------------------------------------------------------------------------------------------------------------
//Functions
//-----------------------------------------------------------------------------------------------------------------------------------------------------------------

//Range Size Function
rng_size(x, qty, n)=>
//    AC       = Cond_EMA(abs(x - x[1]), 1, n)
    wper      = (n*2) - 1
    avrng     = ema(abs(x - x[1]), n)
    AC = ema(avrng, wper)*qty
    rng_size = AC

//Range Filter Function
rng_filt(x, rng_, n)=>
    r          = rng_
    var rfilt  = array.new_float(2, x)
    array.set(rfilt, 1, array.get(rfilt, 0))
    if x - r > array.get(rfilt, 1)
        array.set(rfilt, 0, x - r)
    if x + r < array.get(rfilt, 1)
        array.set(rfilt, 0, x + r)
    rng_filt1 = array.get(rfilt, 0)

    hi_band   = rng_filt1 + r
    lo_band   = rng_filt1 - r
    rng_filt  = rng_filt1
    [hi_band, lo_band, rng_filt]

//-----------------------------------------------------------------------------------------------------------------------------------------------------------------
//Inputs
//-----------------------------------------------------------------------------------------------------------------------------------------------------------------

//Range Source
rng_src = input(defval=close, type=input.source, title="Swing Source")

//Range Period
rng_per = input(defval=20, minval=1, title="Swing Period")

//Range Size Inputs
rng_qty   = input(defval=3.5, minval=0.0000001, title="Swing Multiplier")

//Bar Colors
use_barcolor = input(defval=false, type=input.bool, title="Bar Colors On/Off")

//-----------------------------------------------------------------------------------------------------------------------------------------------------------------
//Definitions
//-----------------------------------------------------------------------------------------------------------------------------------------------------------------

//Range Filter Values
[h_band, l_band, filt] = rng_filt(rng_src, rng_size(rng_src, rng_qty, rng_per), rng_per)

//Direction Conditions
var fdir = 0.0
fdir    := filt > filt[1] ? 1 : filt < filt[1] ? -1 : fdir
upward   = fdir==1 ? 1 : 0
downward = fdir==-1 ? 1 : 0

//Trading Condition
longCond = rng_src > filt and rng_src > rng_src[1] and upward > 0 or rng_src > filt and rng_src < rng_src[1] and upward > 0
shortCond = rng_src < filt and rng_src < rng_src[1] and downward > 0 or rng_src < filt and rng_src > rng_src[1] and downward > 0

CondIni = 0
CondIni := longCond ? 1 : shortCond ? -1 : CondIni[1]
longCondition = longCond and CondIni[1] == -1
shortCondition = shortCond and CondIni[1] == 1

//Colors
filt_color = upward ? #05ff9b : downward ? #ff0583 : #cccccc
bar_color  = upward and (rng_src > filt) ? (rng_src > rng_src[1] ? #05ff9b : #00b36b) :
             downward and (rng_src < filt) ? (rng_src < rng_src[1] ? #ff0583 : #b8005d) : #cccccc

//-----------------------------------------------------------------------------------------------------------------------------------------------------------------
//Outputs
//-----------------------------------------------------------------------------------------------------------------------------------------------------------------

//Filter Plot
filt_plot = plot(filt, color=filt_color, transp=67, linewidth=3, title="Filter")

//Band Plots
h_band_plot = plot(h_band, color=color.new(#05ff9b, 100), title="High Band")
l_band_plot = plot(l_band, color=color.new(#ff0583, 100), title="Low Band")

//Band Fills
fill(h_band_plot, filt_plot, color=color.new(#00b36b, 92), title="High Band Fill")
fill(l_band_plot, filt_plot, color=color.new(#b8005d, 92), title="Low Band Fill")

//Bar Color
barcolor(use_barcolor ? bar_color : na)

//Plot Buy and Sell Labels
plotshape(longCondition, title = "Buy Signal", text ="BUY", textcolor = color.white, style=shape.labelup, size = size.normal, location=location.belowbar, color = color.new(color.green, 0))
plotshape(shortCondition, title = "Sell Signal", text ="SELL", textcolor = color.white, style=shape.labeldown, size = size.normal, location=location.abovebar, color = color.new(color.red, 0))

//Alerts
alertcondition(longCondition, title="Buy Alert", message = "BUY")
alertcondition(shortCondition, title="Sell Alert", message = "SELL")


// extend
fastEmaPeriod = input(50, "fastEmaPeriod")
slowEmaPeriod = input(200, "slowEmaPeriod")
loss = input(30, "loss")
trailPoints = input(30, "trailPoints")
trailOffset = input(30, "trailOffset")
amount = input(1, "amount")

emaFast = ta.ema(close, fastEmaPeriod)
emaSlow = ta.ema(close, slowEmaPeriod)

buyCondition = longCondition and emaFast > emaSlow and close > open and close > emaFast
sellCondition = shortCondition and emaFast < emaSlow and close < open and close < emaFast

if buyCondition and strategy.position_size == 0
    strategy.entry("long", strategy.long, amount)
    strategy.exit("exit_long", "long", amount, loss=loss, trail_points=trailPoints, trail_offset=trailOffset)
if sellCondition and strategy.position_size == 0
    strategy.entry("short", strategy.short, amount)
    strategy.exit("exit_short", "short", amount, loss=loss, trail_points=trailPoints, trail_offset=trailOffset)
Ujian belakang
Julat masa ujian belakang adalah dari Januari 2022 hingga Oktober 2022. Tempoh garis K adalah 15 minit dan model harga penutupan digunakan untuk ujian belakang. Pasaran memilih kontrak kekal Binance ETH_USDT. Parameter ditetapkan mengikut 50 tempoh garis pantas dan 200 tempoh garis perlahan dalam video sumber. Parameter lain tetap tidak berubah secara lalai. Saya menetapkan titik stop loss dan penjejakan titik stop profit kepada 30 mata secara subjektif.
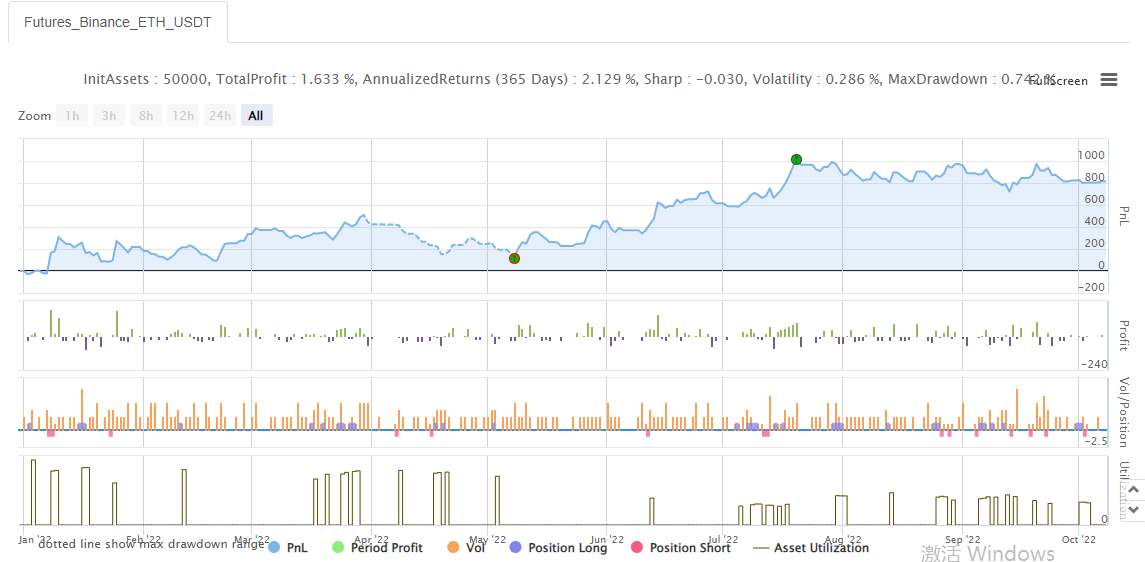
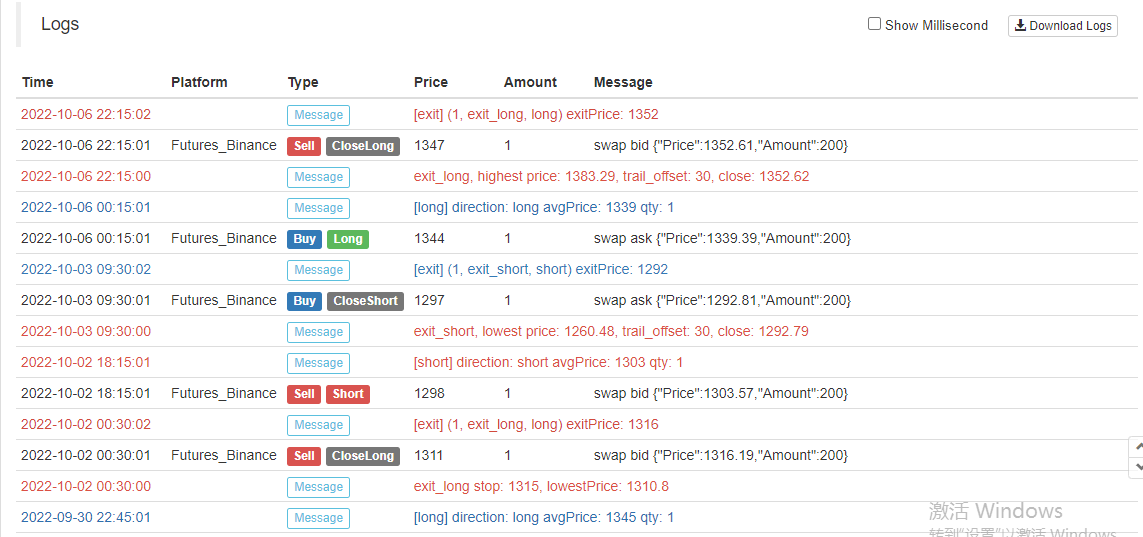
Hasil backtesting adalah biasa, dan nampaknya parameter stop-loss mempunyai beberapa pengaruh terhadap hasil backtesting. Saya merasakan bahawa aspek ini masih perlu dioptimumkan dan direka. Walau bagaimanapun, selepas isyarat strategik mencetuskan perdagangan, kadar kemenangan masih OK.
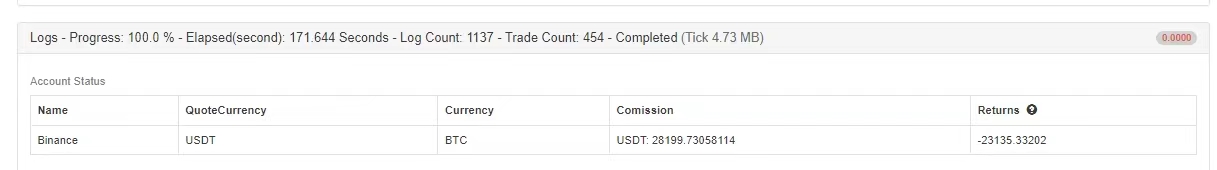
Mari kita cuba kontrak kekal BTC_USDT yang berbeza:
Hasil backtest pada BTC juga sangat menguntungkan:
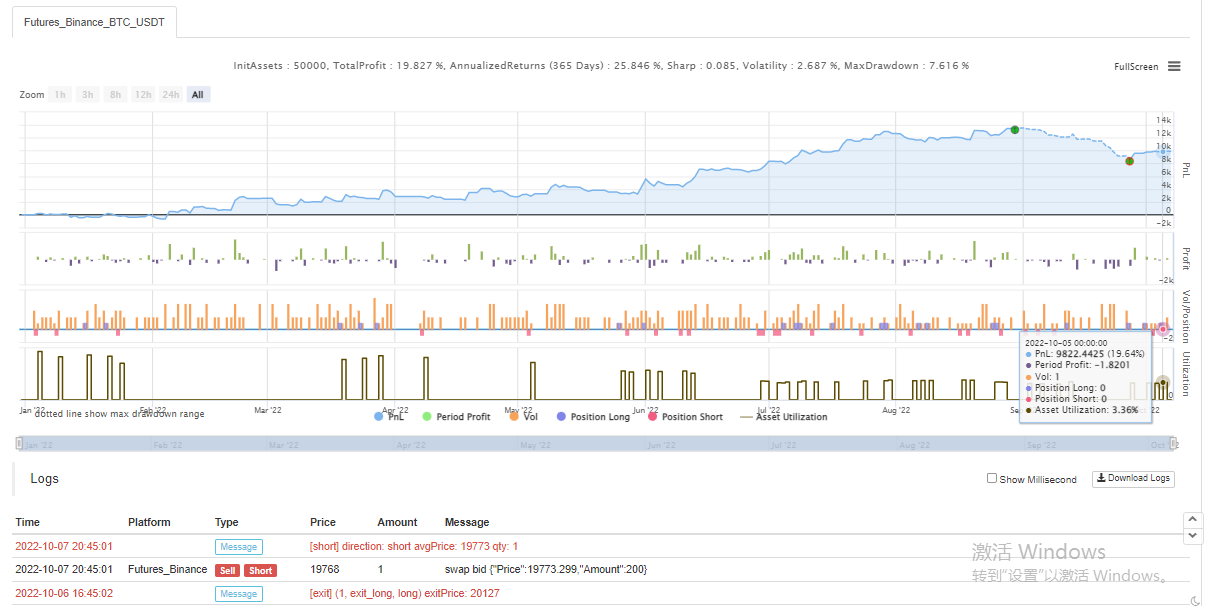
Strategi daripada:https://www.fmz.com/strategy/385745
Nampaknya kaedah perdagangan ini agak boleh dipercayai untuk memahami trend, anda boleh terus mengoptimumkan reka bentuk mengikut idea ini. Dalam artikel ini, kita tidak hanya belajar tentang idea strategi purata bergerak berganda, tetapi juga belajar bagaimana memproses dan mempelajari strategi veteran di YouTube. OK, kod strategi di atas hanya bata dan mortar saya, hasil backtest tidak mewakili hasil bot sebenar tertentu, kod strategi, reka bentuk hanya untuk rujukan. Terima kasih atas sokongan anda, kami akan melihat anda lain kali!
- Mengukur Analisis Dasar di Pasaran Cryptocurrency: Biarkan Data Bercakap Sendiri!
- Perbincangan mengenai kajian kuantitatif asas dalam lingkaran mata wang - jangan mempercayai guru-guru sihir yang bodoh, data adalah objektif!
- Alat penting dalam bidang transaksi kuantitatif - Pencipta modul pencarian data kuantitatif
- Menguasai Semuanya - Pengenalan kepada FMZ Versi Baru Terminal Dagangan (dengan Kod Sumber Arbitraj TRB)
- Menguasai segala-galanya FMZ versi baru terminal perdagangan pengenalan (tambahan kod sumber TRB suite)
- FMZ Quant: Analisis Contoh Reka Bentuk Keperluan Umum di Pasaran Cryptocurrency (II)
- Bagaimana untuk mengeksploitasi bot jualan tanpa otak dengan strategi frekuensi tinggi dalam 80 baris kod
- FMZ Kuantitatif: Penyelesaian contoh reka bentuk permintaan biasa di pasaran mata wang kripto (II)
- Bagaimana untuk mengeksploitasi robot tanpa otak yang dijual dengan strategi frekuensi tinggi 80 baris kod
- FMZ Quant: Analisis Contoh Reka Bentuk Keperluan Umum di Pasaran Cryptocurrency (I)
- FMZ Kuantitatif: Penyelesaian contoh reka bentuk permintaan biasa di pasaran mata wang kripto