Strategi ATR berjangka mata wang digital pelbagai spesies (tutorial)
Penulis:Lydia, Dicipta: 2022-11-08 10:34:22, Dikemas kini: 2023-09-15 20:55:33
Baru-baru ini, beberapa pengguna platform kami berharap untuk memindahkan strategi MyLanguage ke dalam strategi JavaScript, yang dapat menambah banyak idea pengoptimuman dengan fleksibel. Malah mengembangkan strategi ke versi pelbagai spesies. Kerana strategi MyLanguage biasanya merupakan strategi trend, dan banyak daripadanya dilaksanakan berdasarkan model harga penutupan. Antarmuka API pertukaran permintaan strategi tidak terlalu kerap, yang sesuai untuk pemindahan ke versi strategi pelbagai spesies. Dalam artikel ini, kami akan mengambil strategi MyLanguage yang mudah sebagai contoh untuk memindahkannya ke dalam versi bahasa JavaScript yang mudah. Tujuan utama adalah pengajaran dan penyelidikan sokongan.
Strategi MyLanguage untuk Dipindahkan
TR:=MAX(MAX((H-L),ABS(REF(C,1)-H)),ABS(REF(C,1)-L));
ATR:=EMA(TR,LENGTH2);

MIDLINE^^EMA((H + L + C)/3,LENGTH1);
UPBAND^^MIDLINE + N*ATR;
DOWNBAND^^MIDLINE - N*ATR;


BKVOL=0 AND C>=UPBAND AND REF(C,1)<REF(UPBAND,1),BPK;
SKVOL=0 AND C<=DOWNBAND AND REF(C,1)>REF(DOWNBAND,1),SPK;

BKVOL>0 AND C<=MIDLINE,SP(BKVOL);
SKVOL>0 AND C>=MIDLINE,BP(SKVOL);
// stop loss
// stop loss
C>=SKPRICE*(1+SLOSS*0.01),BP;
C<=BKPRICE*(1-SLOSS*0.01),SP;
AUTOFILTER;
Logik perdagangan strategi ini adalah mudah. Pertama, mengira ATR mengikut parameter, kemudian mengira purata harga tertinggi, terendah dan penutupan semua BAR K-line, dan kemudian mengira penunjuk EMA mengikut data purata. Akhirnya, menggabungkan ATR dan pekali N dalam parameter untuk mengira upBand dan downBand.
Posisi pembukaan dan jualan adalah berdasarkan harga penutupan. Buka kedudukan panjang apabila ia mengatasi upBand dan menjual kedudukan pembukaan (apabila memegang kedudukan pendek). Buka kedudukan pendek apabila ia mengatasi downBand dan menjual kedudukan pembukaan. Apabila harga penutupan mencapai garis tengah, kedudukan akan ditutup, dan apabila harga penutupan mencapai harga stop loss, kedudukan juga akan ditutup (stop loss mengikut SLOSS, SLOSS adalah 1, iaitu 0.01, iaitu 1%). Strategi ini dilaksanakan dalam model harga penutupan.
OK, jika kita memahami keperluan strategik dan idea MyLanguage, kita boleh mula menanamkan mereka.
Prototaip Strategi Pemindahan dan Reka Bentuk
Tidak banyak kod prototaip strategi, dari 1 hingga 200 baris. Untuk memudahkan pembelajaran idea-idea penulisan strategi, komen ditulis secara langsung dalam kod strategi.
// parse params parameters, and parse strings as objects
var arrParam = JSON.parse(params)

// this function creates a chart configuration
function createChartConfig(symbol, atrPeriod, emaPeriod, index) {   // symbol : trading pair, atrPeriod : ATR parameter period , emaPeriod : EMA parameter period, exchange object index corresponding to index
    var chart = {
        __isStock: true,
        extension: {
                layout: 'single',
                height: 600,
        },
        title : { text : symbol},
        xAxis: { type: 'datetime'},
        series : [
            {
                type: 'candlestick',    // K-line data series
                name: symbol,
                id: symbol + "-" + index,
                data: []
            }, {
                type: 'line',           // EMA
                name: symbol + ',EMA:' + emaPeriod,
                data: [],
            }, {
                type: 'line',           // upBand
                name: symbol + ',upBand' + atrPeriod,
                data: []
            }, {
                type: 'line',           // downBand
                name: symbol + ',downBand' + atrPeriod,
                data: []
            }, {
                type: 'flags',
                onSeries: symbol + "-" + index,
                data: [],
            }
        ]
    }
    return chart
}

// main Logic
function process(e, kIndex, c) {    // e is the exchange object, exchanges [0]..., kIndex is the K-line data series in the chart, and c is the chart object
    // obtain K-line data
    var r = e.GetRecords(e.param.period)
    if (!r || r.length < e.param.atrPeriod + 2 || r.length < e.param.emaPeriod + 2) {
        // if the K-line data length is insufficient, return
        return
    }

    // calculate ATR indicators
    var atr = TA.ATR(r, e.param.atrPeriod)
    var arrAvgPrice = []
    _.each(r, function(bar) {
        arrAvgPrice.push((bar.High + bar.Low + bar.Close) / 3)
    })
    // calculate EMA indicators
    var midLine = TA.EMA(arrAvgPrice, e.param.emaPeriod)
    // calculate upBand and downBand
    var upBand = []
    var downBand = []
    _.each(midLine, function(mid, index) {
        if (index < e.param.emaPeriod - 1 || index < e.param.atrPeriod - 1) {
            upBand.push(NaN)
            downBand.push(NaN)
            return
        }
        upBand.push(mid + e.param.trackRatio * atr[index])
        downBand.push(mid - e.param.trackRatio * atr[index])
    })

    // draw the chart
    for (var i = 0 ; i < r.length ; i++) {
        if (r[i].Time == e.state.lastBarTime) {
            // update
            c.add(kIndex, [r[i].Time, r[i].Open, r[i].High, r[i].Low, r[i].Close], -1)
            c.add(kIndex + 1, [r[i].Time, midLine[i]], -1)
            c.add(kIndex + 2, [r[i].Time, upBand[i]], -1)
            c.add(kIndex + 3, [r[i].Time, downBand[i]], -1)
        } else if (r[i].Time > e.state.lastBarTime) {
            // add
            e.state.lastBarTime = r[i].Time
            c.add(kIndex, [r[i].Time, r[i].Open, r[i].High, r[i].Low, r[i].Close])
            c.add(kIndex + 1, [r[i].Time, midLine[i]])
            c.add(kIndex + 2, [r[i].Time, upBand[i]])
            c.add(kIndex + 3, [r[i].Time, downBand[i]])
        }
    }

    // check the position
    var pos = e.GetPosition()
    if (!pos) {
        return
    }
    var holdAmount = 0
    var holdPrice = 0
    if (pos.length > 1) {
        throw "long and short positions are checked at the same time!"
    } else if (pos.length != 0) {
        holdAmount = pos[0].Type == PD_LONG ? pos[0].Amount : -pos[0].Amount
        holdPrice = pos[0].Price
    }

    if (e.state.preBar == -1) {
        e.state.preBar = r[r.length - 1].Time
    }
    // check the signal
    if (e.state.preBar != r[r.length - 1].Time) {   // closing price model
        if (holdAmount <= 0 && r[r.length - 3].Close < upBand[upBand.length - 3] && r[r.length - 2].Close > upBand[upBand.length - 2]) {   // the closing price cross over the upBand
            if (holdAmount < 0) {   // hold a short positions, close them
                Log(e.GetCurrency(), "close short positions", "#FF0000")
                $.CoverShort(e, e.param.symbol, Math.abs(holdAmount))
                c.add(kIndex + 4, {x: r[r.length - 2].Time, color: 'red', shape: 'flag', title: 'close', text: "close short positions"})
            }
            // open long positions
            Log(e.GetCurrency(), "open long positions", "#FF0000")
            $.OpenLong(e, e.param.symbol, 10)
            c.add(kIndex + 4, {x: r[r.length - 2].Time, color: 'red', shape: 'flag', title: 'long', text: "open long positions"})
        } else if (holdAmount >= 0 && r[r.length - 3].Close > downBand[downBand.length - 3] && r[r.length - 2].Close < downBand[downBand.length - 2]) {  // the closing price cross down the downBand
            if (holdAmount > 0) {   // hold long positions, close them
                Log(e.GetCurrency(), "close long positions", "#FF0000")
                $.CoverLong(e, e.param.symbol, Math.abs(holdAmount))
                c.add(kIndex + 4, {x: r[r.length - 2].Time, color: 'green', shape: 'flag', title: 'close', text: "close long positions"})
            }
            // open short positions
            Log(e.GetCurrency(), "open short positions", "#FF0000")
            $.OpenShort(e, e.param.symbol, 10)
            c.add(kIndex + 4, {x: r[r.length - 2].Time, color: 'green', shape: 'flag', title: 'short', text: "open short positions"})
        } else {
            // close positions
            if (holdAmount > 0 && (r[r.length - 2].Close <= holdPrice * (1 - e.param.stopLoss) || r[r.length - 2].Close <= midLine[midLine.length - 2])) {   // Hold a long position, the closing price is less than or equal to the midline, stop loss at the opening price
                Log(e.GetCurrency(), "trigger midline or stop loss, close long positions", "#FF0000")
                $.CoverLong(e, e.param.symbol, Math.abs(holdAmount))
                c.add(kIndex + 4, {x: r[r.length - 2].Time, color: 'green', shape: 'flag', title: 'close', text: "close long positions"})
            } else if (holdAmount < 0 && (r[r.length - 2].Close >= holdPrice * (1 + e.param.stopLoss) || r[r.length - 2].Close >= midLine[midLine.length - 2])) {  // Hold a short position, the closing price is greater than or equal to the midline, stop loss at the opening price
                Log(e.GetCurrency(), "trigger midline or stop loss, close short positions", "#FF0000")
                $.CoverShort(e, e.param.symbol, Math.abs(holdAmount))
                c.add(kIndex + 4, {x: r[r.length - 2].Time, color: 'red', shape: 'flag', title: 'close', text: "close short positions"})
            }
        }
        e.state.preBar = r[r.length - 1].Time
    }
}

function main() {
    var arrChartConfig = []
    if (arrParam.length != exchanges.length) {
        throw "Parameters and exchange objects do not match!"
    }
    var arrState = _G("arrState")
    _.each(exchanges, function(e, index) {
        if (e.GetName() != "Futures_Binance") {
            throw "The exchange is not supported!"
        }
        e.param = arrParam[index]
        e.state = {lastBarTime: 0, symbol: e.param.symbol, currency: e.GetCurrency()}
        if (arrState) {
            if (arrState[index].symbol == e.param.symbol && arrState[index].currency == e.GetCurrency()) {
                Log("restore:", e.state)
                e.state = arrState[index]
            } else {
                throw "The restored data does not match the current settings!"
            }
        }
        e.state.preBar = -1   // initial setting -1
        e.SetContractType(e.param.symbol)
        Log(e.GetName(), e.GetLabel(), "set contracts:", e.param.symbol)
        arrChartConfig.push(createChartConfig(e.GetCurrency(), e.param.atrPeriod, e.param.emaPeriod, index))
    })
    var chart = Chart(arrChartConfig)
    chart.reset()

    while (true) {
        _.each(exchanges, function(e, index) {
            process(e, index + index * 4, chart)
            Sleep(500)
        })
    }
}

function onexit() {
    // record e.state
    var arrState = []
    _.each(exchanges, function(e) {
        arrState.push(e.state)
    })
    Log("record:", arrState)
    _G("arrState", arrState)
}
Parameter strategi:
var params = '[{
        "symbol" : "swap",    // contract code
        "period" : 86400,     // K-line period, 86,400 seconds is a day
        "stopLoss" : 0.07,    // stop loss factor, 0.07 or 7%
        "atrPeriod" : 10,     // ATR indicator parameters
        "emaPeriod" : 10,     // EMA indicator parameters
        "trackRatio" : 1,     // upBand and downBand coefficients
        "openRatio" : 0.1     // The reserved opening percentage, which is not supported for now
    }, {
        "symbol" : "swap",
        "period" : 86400,
        "stopLoss" : 0.07,
        "atrPeriod" : 10,
        "emaPeriod" : 10,
        "trackRatio" : 1,
        "openRatio" : 0.1
    }]'
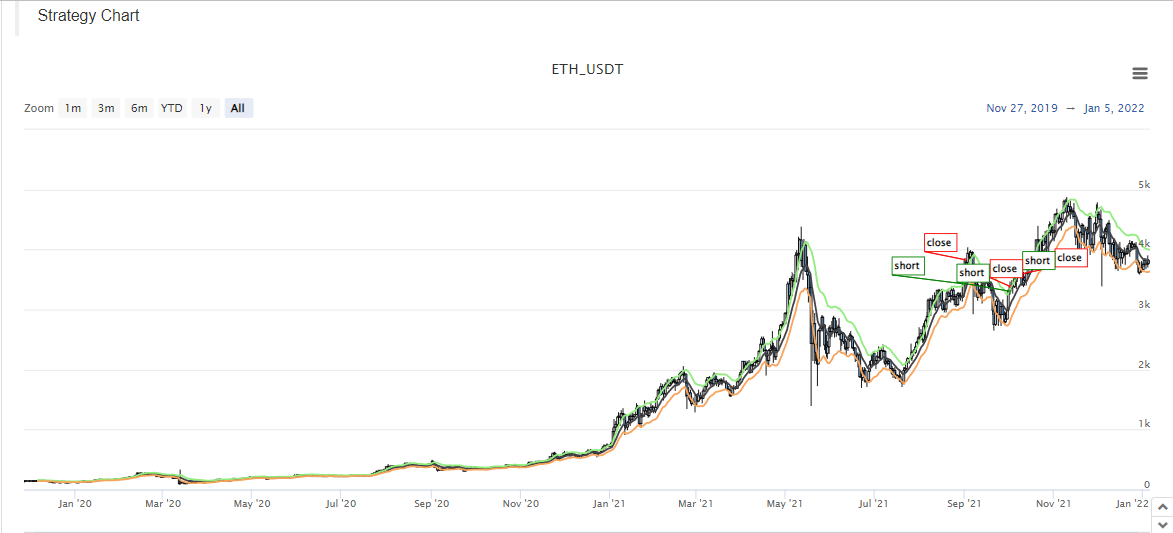
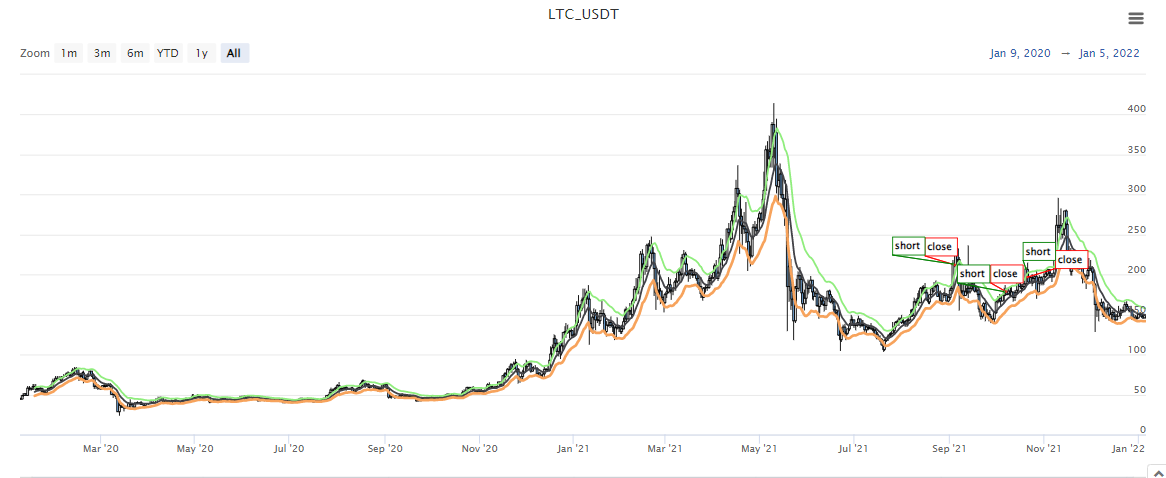
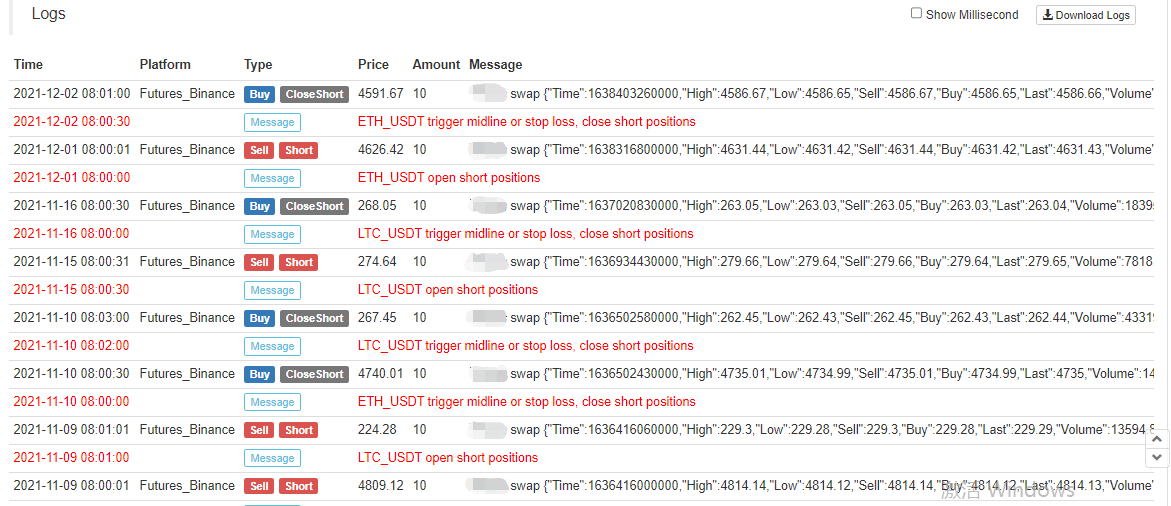
Tangkapan skrin ujian belakang:
Kod sumber strategi:https://www.fmz.com/strategy/339344
Strategi adalah untuk backtesting dan pembelajaran penyelidikan sahaja. sila ubah, mengoptimumkan, dan merujuk kepada bot sebenar sendiri.
- Mengukur Analisis Dasar di Pasaran Cryptocurrency: Biarkan Data Bercakap Sendiri!
- Perbincangan mengenai kajian kuantitatif asas dalam lingkaran mata wang - jangan mempercayai guru-guru sihir yang bodoh, data adalah objektif!
- Alat penting dalam bidang transaksi kuantitatif - Pencipta modul pencarian data kuantitatif
- Menguasai Semuanya - Pengenalan kepada FMZ Versi Baru Terminal Dagangan (dengan Kod Sumber Arbitraj TRB)
- Menguasai segala-galanya FMZ versi baru terminal perdagangan pengenalan (tambahan kod sumber TRB suite)
- FMZ Quant: Analisis Contoh Reka Bentuk Keperluan Umum di Pasaran Cryptocurrency (II)
- Bagaimana untuk mengeksploitasi bot jualan tanpa otak dengan strategi frekuensi tinggi dalam 80 baris kod
- FMZ Kuantitatif: Penyelesaian contoh reka bentuk permintaan biasa di pasaran mata wang kripto (II)
- Bagaimana untuk mengeksploitasi robot tanpa otak yang dijual dengan strategi frekuensi tinggi 80 baris kod
- FMZ Quant: Analisis Contoh Reka Bentuk Keperluan Umum di Pasaran Cryptocurrency (I)
- FMZ Kuantitatif: Penyelesaian contoh reka bentuk permintaan biasa di pasaran mata wang kripto