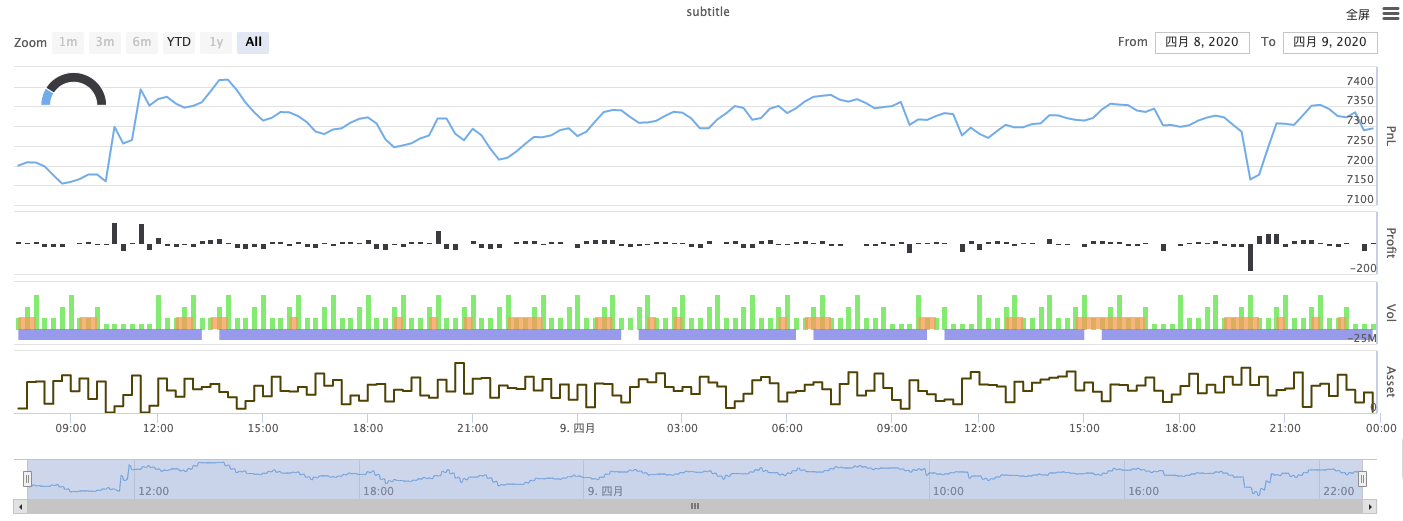
Satu contoh rumit grafik campuran
Penulis:Sifar, Tarikh: 2020-04-11 12:15:25Tag:Jadual
Permintaan lebih lanjut boleh dihubungiHighchart RasmiatauHighchart: Dokumen Bahasa Cina Pihak Ketiga
/*backtest
start: 2020-03-11 00:00:00
end: 2020-04-09 23:59:00
period: 1d
exchanges: [{"eid":"Bitfinex","currency":"BTC_USD"}]
*/

var chartCfg = {
    subtitle: {
        text: "subtitle",
    },
    yAxis: [{
        height: "40%",
        lineWidth: 2,
        title: {
            text: 'PnL',
        },
        tickPixelInterval: 20,
        minorGridLineWidth: 1,
        minorTickWidth: 0,
        opposite: true,
        labels: {
            align: "right",
            x: -3,
        }
    }, {
        title: {
            text: 'Profit',
        },
        top: "42%",
        height: "18%",
        offset: 0,
        lineWidth: 2
    }, {
        title: {
            text: 'Vol',
        },
        top: '62%',
        height: '18%',
        offset: 0,
        lineWidth: 2
    }, {
        title: {
            text: 'Asset',
        },
        top: '82%',
        height: '18%',
        offset: 0,
        lineWidth: 2
    }],
    series: [{
        name: 'PnL',
        data: [],
        id: 'primary',
        tooltip: {
            xDateFormat: '%Y-%m-%d %H:%M:%S'
        },
        yAxis: 0
    }, {
        type: 'column',
        lineWidth: 2,
        name: 'Profit',
        data: [],
        yAxis: 1,
    }, {
        type: 'column',
        name: 'Trade',
        data: [],
        yAxis: 2
    }, {
        type: 'area',
        step: true,
        lineWidth: 0,
        name: 'Long',
        data: [],
        yAxis: 2
    }, {
        type: 'area',
        step: true,
        lineWidth: 0,
        name: 'Short',
        data: [],
        yAxis: 2
    }, {
        type: 'line',
        step: true,
        color: '#5b4b00',
        name: 'Asset',
        data: [],
        yAxis: 3
    }, {
        type: 'pie',
        innerSize: '70%',
        name: 'Random',
        data: [],
        center: ['3%', '6%'],
        size: '15%',
        dataLabels: {
            enabled: false
        },
        startAngle: -90,
        endAngle: 90,
    }],
};

function main() {
    let c = Chart(chartCfg);
    let preTicker = null;
    while (true) {
        let t = exchange.GetTicker();

        c.add(0, [t.Time, t.Last]); // PnL
        c.add(1, [t.Time, preTicker ? t.Last - preTicker.Last : 0]); // profit
        let r = Math.random();
        var pos = parseInt(t.Time/86400);
        c.add(2, [t.Time, pos/2]); // Vol
        c.add(3, [t.Time, r > 0.8 ? pos : null]); // Long
        c.add(4, [t.Time, r < 0.8 ? -pos : null]); // Short
        c.add(5, [t.Time, Math.random() * 100]); // Asset
        // update pie
        chartCfg.series[chartCfg.series.length-1].data = [
            ["A", Math.random()*100],
            ["B", Math.random()*100],
         ];
        c.update(chartCfg)
        preTicker = t;
    }
}
Berkaitan
- Pencipta APP Strategi ujian carta
- Versi ujian grafik rakaman kompleks
- Ujian pelbagai grafik versi C++
- Python versi MACD contoh gambar petunjuk
- Contoh grafik MACD
- python status bar tables menunjukkan contoh butang
- Contoh carta berbilang
- Menggunakan perpustakaan kelas garis gambar untuk menggambar garis K dan contoh grafik garis rata
- Uji pelbagai grafik menunjukkan versi Python
- TableTemplate
Lebih lanjut
- Strategi pelaksanaan isyarat TradingViewWebHook
- Pertukaran harga membeli dan menjual
- Strategi lindung nilai multi mata wang yang berkekalan (buat banyak overfall jadi kosong overhang)
- Strategi SuperTrend (Pengajaran)
- Tiga baris kod mewujudkan Algorithm pembelajaran mesin untuk membaca berita industri dengan cepat
- Simpan di tempat
- Strategi membuang syiling (●'
'●) - SuperTrend V1
- Yang Tuhan, strategi mudah turun naik
- RecordsCollecter (Pengajaran)
- Superfall, Superbull dan Superbull
- Strategi Binance 2: Hapus Nilai Tinggi dan Rendah
- Pendaftaran kontrak
- Binance Strategy Hedging Multi-currency yang Berkelanjutan (Binance) Modul Stop Loss Terbaru pada 13 April
- Strategi Hedging Multi-mata wang Binance yang Berkelanjutan (Indeks Mata Wang Binance) 10 April Diperbaiki Bug, perlu dikemas kini
- MACD jual beli rendah jual jual rendah automatik
- Robot pertama kali memetik wang baru di bursa
- Hedging Platform Berbilang untuk Meningkatkan Kepelbagaian
- Satu garisan lurus Demo trend
- Pantai
SifarPeriksa semula, tidak ada cakera sebenar
Johnny.Adakah terdapat had maksimum nilai kemasukan? Jika anda ke bawah, anda hanya boleh memaparkan maksimum data hari.
FmzeroAdakah grafik mempunyai API untuk mengawal corak / grafik yang dipaparkan dan disembunyikan