Implementação da linguagem JavaScript dos indicadores de Fisher e desenho no FMZ
Autora:Lydia., Criado: 2022-11-07 11:37:48, Atualizado: 2023-09-15 21:05:55
Durante a análise técnica da negociação, os comerciantes analisam e estudam os dados do preço das ações como os dados da distribuição normal.Fisher Transformationé um método que pode transformar dados de preços em distribuição normal.Fisher TransformationOs sinais de negociação podem ser enviados utilizando os indicadores do dia em curso e do dia anterior.
Há muitos conteúdos sobre oFisher TransformEm Baidu, Zhihu, aqui não vamos repetir.
Algoritmo do indicador:
-
Preço médio hoje:
mid=(low + high) / 2 -
Julgue o período de cálculo, que pode ser de 10 dias.
lowestLow = lowest price in the period,highestHigh = highest price in the period. -
Definir o parâmetro de variação de preço (o parâmetro de variação de preço)
ratioé uma constante entre 0 e 1, por exemplo, 0,5 ou 0,33):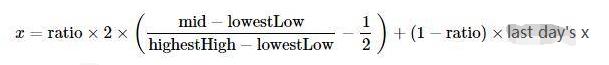
-
Utilizando o
Fishertransformação no parâmetro de variação de preçox, oFisherO indicador é obtido: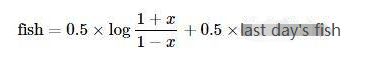
Implementar o algoritmo usando a linguagem JavaScript
É implementado passo a passo de acordo com o algoritmo do indicador.preXepreFish, eles foram definidos para 0 no início.Math LogAlém disso, o algoritmo acima não mencionou a correção de x, que eu quase ignorei quando escrevi:
Corrigir o valor de x, forçá-lo a ser 0,999 se for maior que 0,99.
        if (x > 0.99) {
            x = 0.999
        } else if (x < -0.99) {
            x = -0.999
        }
A primeira vez que vi o algoritmo e os indicadores, eu os transplantei de acordo com o algoritmo. Eu não verifiquei essa implementação, e alguns que estão interessados em pesquisa podem verificar se há erros.
Fisher TransformCódigo de origem do algoritmo do indicador:
function getHighest(arr, period) {
    if (arr.length == 0 || arr.length - period < 0) {
        return null
    }
    var beginIndex = arr.length - period
    var ret = arr[beginIndex].High
    for (var i = 0 ; i < arr.length - 1 ; i++) {
        if (arr[i + 1].High > ret) {
            ret = arr[i + 1].High
        }
    }
    return ret
}

function getLowest(arr, period) {
    if (arr.length == 0 || arr.length - period < 0) {
        return null
    }
    var beginIndex = arr.length - period
    var ret = arr[beginIndex].Low
    for (var i = 0 ; i < arr.length - 1 ; i++) {
        if (arr[i + 1].Low < ret) {
            ret = arr[i + 1].Low
        }
    }
    return ret
}

function calcFisher(records, ratio, period) {
    var preFish = 0
    var preX = 0
    var arrFish = []
    // When the length of K-line is not enough to meet the period
    if (records.length < period) {
        for (var i = 0 ; i < records.length ; i++) {
            arrFish.push(0)
        }
        return arrFish
    }

    // traverse the K-line
    for (var i = 0 ; i < records.length ; i++) {
        var fish = 0
        var x = 0
        var bar = records[i]
        var mid = (bar.High + bar.Low) / 2
        // When the current BAR is insufficient in period calculation
        if (i < period - 1) {
            fish = 0
            preFish = 0
            arrFish.push(fish)
            continue
        }

        // Calculate the highest and lowest price in the period
        var bars = []
        for (var j = 0 ; j <= i ; j++) {
            bars.push(records[j])
        }
        var lowestLow = getLowest(bars, period)
        var highestHigh = getHighest(bars, period)

        // price change parameters
        x = ratio * 2 * ((mid - lowestLow) / (highestHigh - lowestLow) - 0.5) + (1 - ratio) * preX
        if (x > 0.99) {
            x = 0.999
        } else if (x < -0.99) {
            x = -0.999
        }
        preX = x
        fish = 0.5 * Math.log((1 + x) / (1 - x)) + 0.5 * preFish
        preFish = fish
        arrFish.push(fish)
    }
    return arrFish
}
Diagrama de desenho
É fácil desenhar no FMZ, na Praça da Estratégia:https://www.fmz.com/squaretem um grande número de exemplos para referência, você pode pesquisar neles.
var cfg = {    // The object used to initialize chart settings (i.e. chart settings)
    plotOptions: {
        candlestick: {
            color: '#d75442',  // color value
            upColor: '#6ba583' // color value
        }
    },
    title: { text: 'Fisher Transform'},     //title
    subtitle: {text: ''},     //sub-title
    plotOptions: {
        candlestick: {
        tooltip: {
            pointFormat:
            '<span style="color:{point.color}">\u25CF</span> <b> {series.name}</b><br/>' +
            'opening quotation: {point.open}<br/>' +
            'the highest: {point.high}<br/>' +
            'the lowest: {point.low}<br/>' +
            'closing quotation: {point.close}<br/>'
            }
        }
    },
    yAxis: [{
        title: {
            text: 'K-line market'
        },
        height: '70%',
        lineWidth: 1
    }, {
        title: {
            text: 'Fisher Transform'
        },
        top: '75%',
        height: '30%',
        offset: 0,
        lineWidth: 1
    }],
    series: [//series
        {
            type: 'candlestick',
            yAxis: 0,
            name: 'K-line',
            id: 'KLine',
            // Control the candle color with downward trend
            color: 'green',
            lineColor: 'green',
            // Control the candle color with upward trend
            upColor: 'red',
            upLineColor: 'red',
            data: []
        },{
            type: 'line',         // Set the current data series type as line
            yAxis: 1,             // The y-axis used as the y-axis with the index of 0 (a highcharts chart can have multiple y-axes, and the y-axis with the index of 0 is specified here)
            showInLegend: true,   //
            name: 'fish',          // Set it according to the parameter label passed in by the function
            lineWidth: 1,
            data: [],             // Data items of data series
            tooltip: {            // Tooltip
                valueDecimals: 2  // The decimal point of the value is reserved for 5 digits
            }
        },{
            type: 'line',         // Set the current data series type as line
            yAxis: 1,             // The y-axis used as the y-axis with the index of 0 (a highcharts chart can have multiple y-axes, and the y-axis with the index of 0 is specified here)
            showInLegend: true,   //
            name: 'preFish',      // Set it according to the parameter label passed in by the function
            lineWidth: 1,
            data: [],             // Data items of data series
            tooltip: {            // Tooltip
                valueDecimals: 2  // The decimal point of the value is reserved for 5 digits
            }
        }
    ]
}

var chart = Chart(cfg)
function main() {
    var ts = 0
    chart.reset()
    while (true) {
        var r = exchange.GetRecords()
        var fisher = calcFisher(r, 0.33, 10)
        if (!r || !fisher) {
            Sleep(500)
            continue
        }

        for (var i = 0; i < r.length; i++){
            if (ts == r[i].Time) {
                chart.add([0,[r[i].Time, r[i].Open, r[i].High, r[i].Low, r[i].Close], -1])
                chart.add([1,[r[i].Time, fisher[i]], -1])
                if (i - 1 >= 0) {
                    chart.add([2,[r[i].Time, fisher[i - 1]], -1])
                }
            }else if (ts < r[i].Time) {
                chart.add([0,[r[i].Time, r[i].Open, r[i].High, r[i].Low, r[i].Close]])
                chart.add([1,[r[i].Time, fisher[i]]])
                if (i - 1 >= 0) {
                    chart.add([2,[r[i].Time, fisher[i - 1]]])
                }
                ts = r[i].Time
            }
        }
    }
}
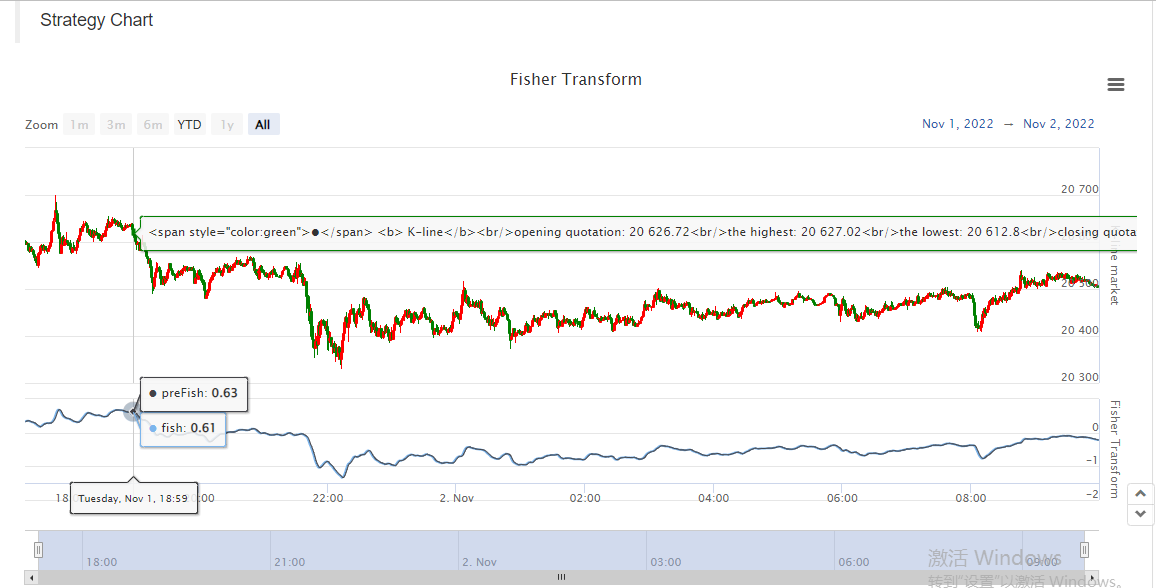
Portanto, é muito conveniente estudar dados, gráfico de exibição e estratégia de design no FMZ. Aqui acabamos de demonstrar um exemplo, vocês são todos bem-vindos a deixar uma mensagem.
- Quantificar a análise fundamental no mercado de criptomoedas: deixe os dados falarem por si mesmos!
- A pesquisa quantitativa básica do círculo monetário - deixe de acreditar em todos os professores de matemática loucos, os dados são objetivos!
- Uma ferramenta indispensável no campo da transação quantitativa - inventor do módulo de exploração de dados quantitativos
- Dominar tudo - Introdução ao FMZ Nova versão do Terminal de Negociação (com TRB Arbitrage Source Code)
- Conheça tudo sobre a nova versão do terminal de negociação da FMZ
- FMZ Quant: Análise de Exemplos de Design de Requisitos Comuns no Mercado de Criptomoedas (II)
- Como explorar robôs de venda sem cérebro com uma estratégia de alta frequência em 80 linhas de código
- Quantificação FMZ: Análise de casos de design de necessidades comuns do mercado de criptomoedas (II)
- Como usar estratégias de 80 linhas de código de alta frequência para explorar robôs sem cérebro para venda
- FMZ Quant: Análise de Exemplos de Design de Requisitos Comuns no Mercado de Criptomoedas (I)
- Quantificação FMZ: Análise de casos de design de necessidades comuns do mercado de criptomoedas (I)