A "Magic Double EMA Strategy" dos Veteranos do YouTube
Autora:Lydia., Criado: 2022-11-07 12:02:31, Atualizado: 2023-09-15 20:51:23
A Magic Double EMA Strategy dos Veteranos do YouTube
Nesta edição, vamos discutir uma
Indicadores utilizados pela estratégia
- Indicadores da EMA
Por uma questão de simplicidade de design, nós não vamos usar o Moving Average Exponential listado no vídeo, vamos usar o built-in ta.ema da visão de negociação em vez disso (é realmente o mesmo).
- Indicadores VuManChu de balanço livre
Este é um indicador no Trading View, precisamos de ir ao Trading View e pegar o código fonte.
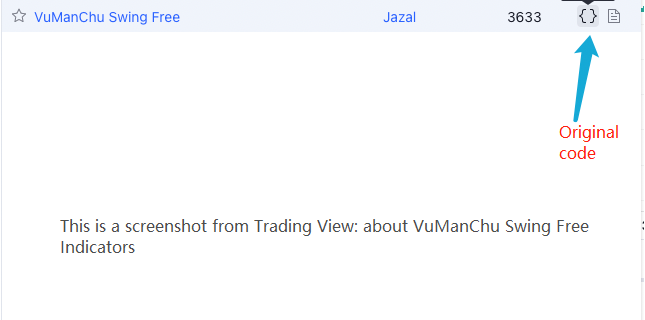
Código do VuManChu Swing Free:
// This source code is subject to the terms of the Mozilla Public License 2.0 at https://mozilla.org/MPL/2.0/

// Credits to the original Script - Range Filter DonovanWall https://www.tradingview.com/script/lut7sBgG-Range-Filter-DW/
// This version is the old version of the Range Filter with less settings to tinker with

//@version=4
study(title="Range Filter - B&S Signals", shorttitle="RF - B&S Signals", overlay=true)

//-----------------------------------------------------------------------------------------------------------------------------------------------------------------
//Functions
//-----------------------------------------------------------------------------------------------------------------------------------------------------------------

//Range Size Function
rng_size(x, qty, n)=>
//    AC       = Cond_EMA(abs(x - x[1]), 1, n)
    wper      = (n*2) - 1
    avrng     = ema(abs(x - x[1]), n)
    AC = ema(avrng, wper)*qty
    rng_size = AC

//Range Filter Function
rng_filt(x, rng_, n)=>
    r          = rng_
    var rfilt  = array.new_float(2, x)
    array.set(rfilt, 1, array.get(rfilt, 0))
    if x - r > array.get(rfilt, 1)
        array.set(rfilt, 0, x - r)
    if x + r < array.get(rfilt, 1)
        array.set(rfilt, 0, x + r)
    rng_filt1 = array.get(rfilt, 0)

    hi_band   = rng_filt1 + r
    lo_band   = rng_filt1 - r
    rng_filt  = rng_filt1
    [hi_band, lo_band, rng_filt]

//-----------------------------------------------------------------------------------------------------------------------------------------------------------------
//Inputs
//-----------------------------------------------------------------------------------------------------------------------------------------------------------------

//Range Source
rng_src = input(defval=close, type=input.source, title="Swing Source")

//Range Period
rng_per = input(defval=20, minval=1, title="Swing Period")

//Range Size Inputs
rng_qty   = input(defval=3.5, minval=0.0000001, title="Swing Multiplier")

//Bar Colors
use_barcolor = input(defval=false, type=input.bool, title="Bar Colors On/Off")

//-----------------------------------------------------------------------------------------------------------------------------------------------------------------
//Definitions
//-----------------------------------------------------------------------------------------------------------------------------------------------------------------

//Range Filter Values
[h_band, l_band, filt] = rng_filt(rng_src, rng_size(rng_src, rng_qty, rng_per), rng_per)

//Direction Conditions
var fdir = 0.0
fdir    := filt > filt[1] ? 1 : filt < filt[1] ? -1 : fdir
upward   = fdir==1 ? 1 : 0
downward = fdir==-1 ? 1 : 0

//Trading Condition
longCond = rng_src > filt and rng_src > rng_src[1] and upward > 0 or rng_src > filt and rng_src < rng_src[1] and upward > 0
shortCond = rng_src < filt and rng_src < rng_src[1] and downward > 0 or rng_src < filt and rng_src > rng_src[1] and downward > 0

CondIni = 0
CondIni := longCond ? 1 : shortCond ? -1 : CondIni[1]
longCondition = longCond and CondIni[1] == -1
shortCondition = shortCond and CondIni[1] == 1

//Colors
filt_color = upward ? #05ff9b : downward ? #ff0583 : #cccccc
bar_color  = upward and (rng_src > filt) ? (rng_src > rng_src[1] ? #05ff9b : #00b36b) :
             downward and (rng_src < filt) ? (rng_src < rng_src[1] ? #ff0583 : #b8005d) : #cccccc

//-----------------------------------------------------------------------------------------------------------------------------------------------------------------
//Outputs
//-----------------------------------------------------------------------------------------------------------------------------------------------------------------

//Filter Plot
filt_plot = plot(filt, color=filt_color, transp=67, linewidth=3, title="Filter")

//Band Plots
h_band_plot = plot(h_band, color=color.new(#05ff9b, 100), title="High Band")
l_band_plot = plot(l_band, color=color.new(#ff0583, 100), title="Low Band")

//Band Fills
fill(h_band_plot, filt_plot, color=color.new(#00b36b, 92), title="High Band Fill")
fill(l_band_plot, filt_plot, color=color.new(#b8005d, 92), title="Low Band Fill")

//Bar Color
barcolor(use_barcolor ? bar_color : na)

//Plot Buy and Sell Labels
plotshape(longCondition, title = "Buy Signal", text ="BUY", textcolor = color.white, style=shape.labelup, size = size.normal, location=location.belowbar, color = color.new(color.green, 0))
plotshape(shortCondition, title = "Sell Signal", text ="SELL", textcolor = color.white, style=shape.labeldown, size = size.normal, location=location.abovebar, color = color.new(color.red, 0))

//Alerts
alertcondition(longCondition, title="Buy Alert", message = "BUY")
alertcondition(shortCondition, title="Sell Alert", message = "SELL")
Estratégia lógica
Indicador EMA: a estratégia utiliza duas EMAs, uma é a linha rápida (parâmetro de período pequeno) e a outra é a linha lenta (parâmetro de período grande).
-
acordo de posição longa A linha rápida está acima da linha lenta.
-
acordo de posição curta A linha rápida está abaixo da linha lenta.
Indicador livre de fluxo de VuManChu: O indicador livre de fluxo de VuManChu é usado para enviar sinais e julgar se deve colocar uma ordem em combinação com outras condições.
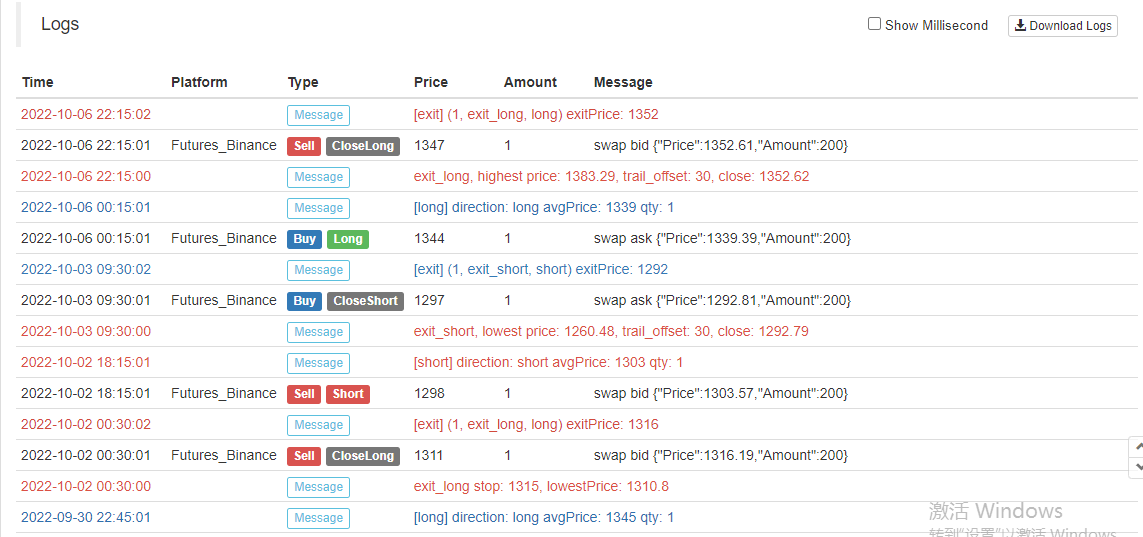
Agora vamos falar sobre as condições específicas de gatilho do sinal de negociação:
-
Regras de entrada em posição longa: O preço de fechamento da linha K positiva deve estar acima da linha rápida da EMA, as duas EMA devem ser uma posição longa (linha rápida acima da linha lenta) e o indicador VuManChu Swing Free deve mostrar um sinal de compra (longCondition é verdadeiro).
-
Regras de entrada na posição curta (ao contrário da posição longa): O preço de fechamento da linha K negativa deve estar abaixo da linha rápida da EMA, as duas EMA devem ser uma posição curta (linha rápida abaixo da linha lenta) e o indicador VuManChu Swing Free deve mostrar um sinal de venda (shortCondition é verdade).
A lógica de negociação é muito simples? uma vez que o vídeo de origem não especifica o stop de lucro e stop de perda, eu vou usar um método moderado de stop de lucro e stop de perda livremente, usando pontos fixos para parar a perda, e rastreando o stop de lucro.
Projeto do código
O código do indicador VuManChu Swing Free, colocamo-lo no nosso código de estratégia diretamente sem qualquer alteração.
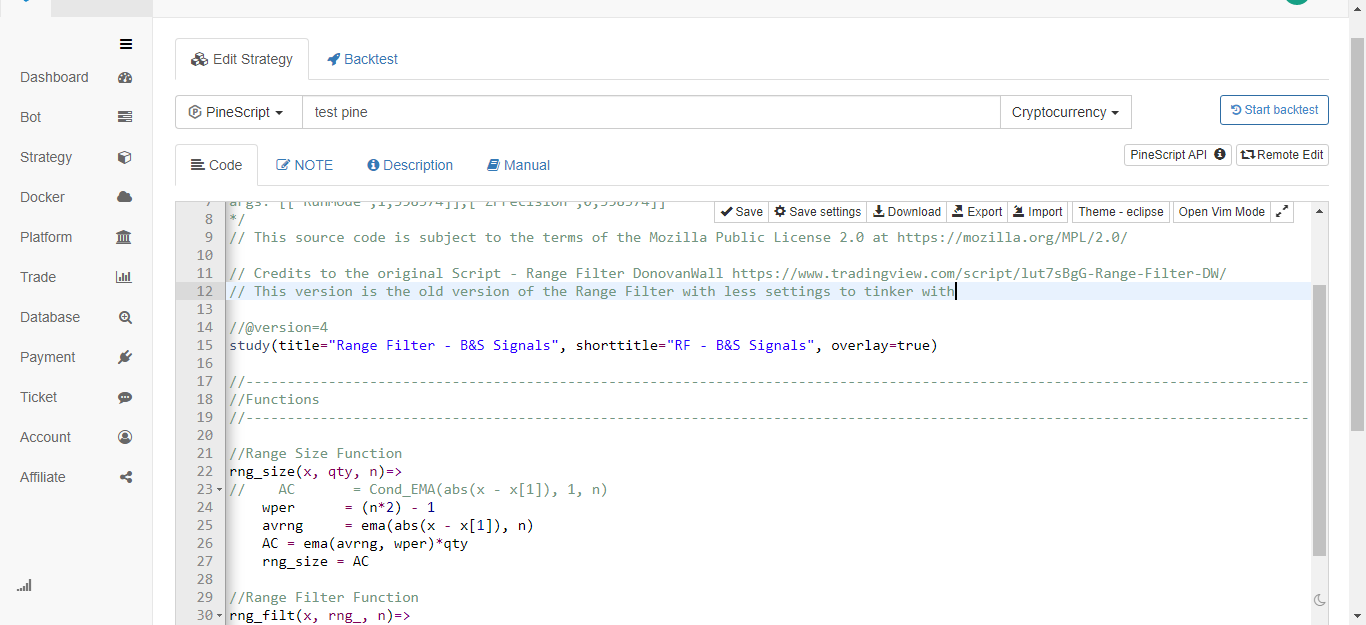
Então, imediatamente depois, escrevemos um pedaço de código da linguagem Pine que implementa a função de negociação:
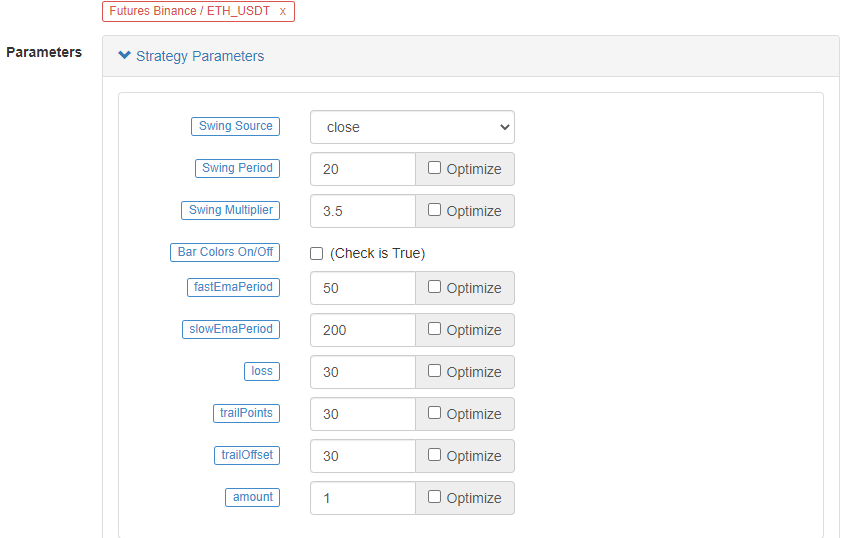
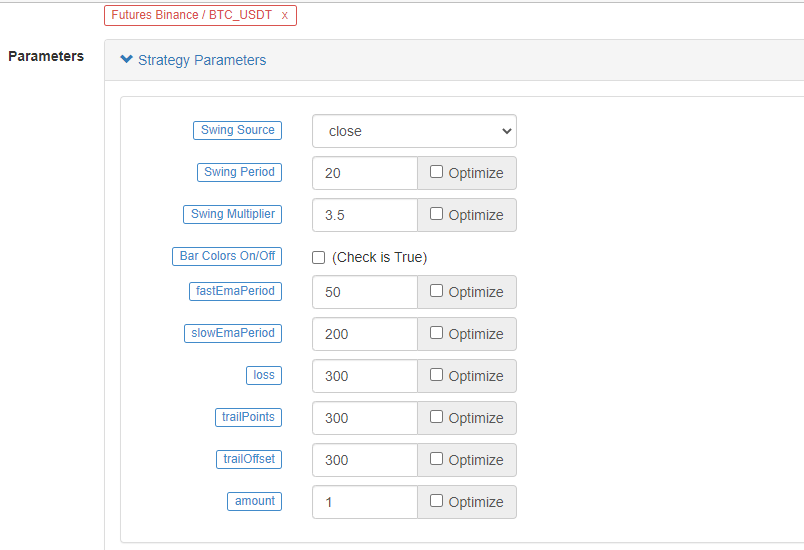
// extend
fastEmaPeriod = input(50, "fastEmaPeriod")         // fast line period
slowEmaPeriod = input(200, "slowEmaPeriod")        // slow line period
loss = input(30, "loss")                           // stop loss points
trailPoints = input(30, "trailPoints")             // number of trigger points for moving stop loss
trailOffset = input(30, "trailOffset")             // moving stop profit offset (points)
amount = input(1, "amount")                        // order amount

emaFast = ta.ema(close, fastEmaPeriod)             // calculate the fast line EMA
emaSlow = ta.ema(close, slowEmaPeriod)             // calculate the slow line EMA

buyCondition = longCondition and emaFast > emaSlow and close > open and close > emaFast         // entry conditions for long positions
sellCondition = shortCondition and emaFast < emaSlow and close < open and close < emaFast       // entry conditions for short positions

if buyCondition and strategy.position_size == 0
    strategy.entry("long", strategy.long, amount)
    strategy.exit("exit_long", "long", amount, loss=loss, trail_points=trailPoints, trail_offset=trailOffset)
if sellCondition and strategy.position_size == 0
    strategy.entry("short", strategy.short, amount)
    strategy.exit("exit_short", "short", amount, loss=loss, trail_points=trailPoints, trail_offset=trailOffset)
A.Itpode ser visto que quando buyCondition é verdade, isto é:
- Variavel longCondition true (O indicador VuManChu Swing Free envia um sinal de posição longa).
- EmaFast > emaSlow (alinhamento da posição longa da EMA).
- fechar > abrir (significa que o BAR actual é positivo), fechar > emaFast (significa que o preço de fechamento está acima da linha rápida da EMA).
As três condições para continuar.
B.Quando a condição de venda for verdadeira, as três condições para fazer uma posição curta são válidas (não repetidas aqui).
Em seguida, usamos a função strategy.entry para entrar e abrir uma posição no caso de um se condição sinal de julgamento gatilho, e definir ostrategy.exitFunção para parar perdas e rastrear lucros ao mesmo tempo.
Código completo
/*backtest
start: 2022-01-01 00:00:00
end: 2022-10-08 00:00:00
period: 15m
basePeriod: 5m
exchanges: [{"eid":"Futures_Binance","currency":"ETH_USDT"}]
args: [["ZPrecision",0,358374]]
*/

// This source code is subject to the terms of the Mozilla Public License 2.0 at https://mozilla.org/MPL/2.0/

// Credits to the original Script - Range Filter DonovanWall https://www.tradingview.com/script/lut7sBgG-Range-Filter-DW/
// This version is the old version of the Range Filter with less settings to tinker with

//@version=4
study(title="Range Filter - B&S Signals", shorttitle="RF - B&S Signals", overlay=true)

//-----------------------------------------------------------------------------------------------------------------------------------------------------------------
//Functions
//-----------------------------------------------------------------------------------------------------------------------------------------------------------------

//Range Size Function
rng_size(x, qty, n)=>
//    AC       = Cond_EMA(abs(x - x[1]), 1, n)
    wper      = (n*2) - 1
    avrng     = ema(abs(x - x[1]), n)
    AC = ema(avrng, wper)*qty
    rng_size = AC

//Range Filter Function
rng_filt(x, rng_, n)=>
    r          = rng_
    var rfilt  = array.new_float(2, x)
    array.set(rfilt, 1, array.get(rfilt, 0))
    if x - r > array.get(rfilt, 1)
        array.set(rfilt, 0, x - r)
    if x + r < array.get(rfilt, 1)
        array.set(rfilt, 0, x + r)
    rng_filt1 = array.get(rfilt, 0)

    hi_band   = rng_filt1 + r
    lo_band   = rng_filt1 - r
    rng_filt  = rng_filt1
    [hi_band, lo_band, rng_filt]

//-----------------------------------------------------------------------------------------------------------------------------------------------------------------
//Inputs
//-----------------------------------------------------------------------------------------------------------------------------------------------------------------

//Range Source
rng_src = input(defval=close, type=input.source, title="Swing Source")

//Range Period
rng_per = input(defval=20, minval=1, title="Swing Period")

//Range Size Inputs
rng_qty   = input(defval=3.5, minval=0.0000001, title="Swing Multiplier")

//Bar Colors
use_barcolor = input(defval=false, type=input.bool, title="Bar Colors On/Off")

//-----------------------------------------------------------------------------------------------------------------------------------------------------------------
//Definitions
//-----------------------------------------------------------------------------------------------------------------------------------------------------------------

//Range Filter Values
[h_band, l_band, filt] = rng_filt(rng_src, rng_size(rng_src, rng_qty, rng_per), rng_per)

//Direction Conditions
var fdir = 0.0
fdir    := filt > filt[1] ? 1 : filt < filt[1] ? -1 : fdir
upward   = fdir==1 ? 1 : 0
downward = fdir==-1 ? 1 : 0

//Trading Condition
longCond = rng_src > filt and rng_src > rng_src[1] and upward > 0 or rng_src > filt and rng_src < rng_src[1] and upward > 0
shortCond = rng_src < filt and rng_src < rng_src[1] and downward > 0 or rng_src < filt and rng_src > rng_src[1] and downward > 0

CondIni = 0
CondIni := longCond ? 1 : shortCond ? -1 : CondIni[1]
longCondition = longCond and CondIni[1] == -1
shortCondition = shortCond and CondIni[1] == 1

//Colors
filt_color = upward ? #05ff9b : downward ? #ff0583 : #cccccc
bar_color  = upward and (rng_src > filt) ? (rng_src > rng_src[1] ? #05ff9b : #00b36b) :
             downward and (rng_src < filt) ? (rng_src < rng_src[1] ? #ff0583 : #b8005d) : #cccccc

//-----------------------------------------------------------------------------------------------------------------------------------------------------------------
//Outputs
//-----------------------------------------------------------------------------------------------------------------------------------------------------------------

//Filter Plot
filt_plot = plot(filt, color=filt_color, transp=67, linewidth=3, title="Filter")

//Band Plots
h_band_plot = plot(h_band, color=color.new(#05ff9b, 100), title="High Band")
l_band_plot = plot(l_band, color=color.new(#ff0583, 100), title="Low Band")

//Band Fills
fill(h_band_plot, filt_plot, color=color.new(#00b36b, 92), title="High Band Fill")
fill(l_band_plot, filt_plot, color=color.new(#b8005d, 92), title="Low Band Fill")

//Bar Color
barcolor(use_barcolor ? bar_color : na)

//Plot Buy and Sell Labels
plotshape(longCondition, title = "Buy Signal", text ="BUY", textcolor = color.white, style=shape.labelup, size = size.normal, location=location.belowbar, color = color.new(color.green, 0))
plotshape(shortCondition, title = "Sell Signal", text ="SELL", textcolor = color.white, style=shape.labeldown, size = size.normal, location=location.abovebar, color = color.new(color.red, 0))

//Alerts
alertcondition(longCondition, title="Buy Alert", message = "BUY")
alertcondition(shortCondition, title="Sell Alert", message = "SELL")


// extend
fastEmaPeriod = input(50, "fastEmaPeriod")
slowEmaPeriod = input(200, "slowEmaPeriod")
loss = input(30, "loss")
trailPoints = input(30, "trailPoints")
trailOffset = input(30, "trailOffset")
amount = input(1, "amount")

emaFast = ta.ema(close, fastEmaPeriod)
emaSlow = ta.ema(close, slowEmaPeriod)

buyCondition = longCondition and emaFast > emaSlow and close > open and close > emaFast
sellCondition = shortCondition and emaFast < emaSlow and close < open and close < emaFast

if buyCondition and strategy.position_size == 0
    strategy.entry("long", strategy.long, amount)
    strategy.exit("exit_long", "long", amount, loss=loss, trail_points=trailPoints, trail_offset=trailOffset)
if sellCondition and strategy.position_size == 0
    strategy.entry("short", strategy.short, amount)
    strategy.exit("exit_short", "short", amount, loss=loss, trail_points=trailPoints, trail_offset=trailOffset)
Teste de retrocesso
O intervalo de tempo do backtest é de janeiro de 2022 a outubro de 2022. O período de linha K é de 15 minutos e o modelo de preço de fechamento é usado para o backtest. O mercado escolhe o contrato perpétuo Binance ETH_USDT. Os parâmetros são definidos de acordo com os 50 períodos de linha rápida e 200 períodos de linha lenta no vídeo da fonte. Outros parâmetros permanecem inalterados por padrão. Eu defino pontos de stop loss e rastreamento de stop profit para 30 pontos subjetivamente.
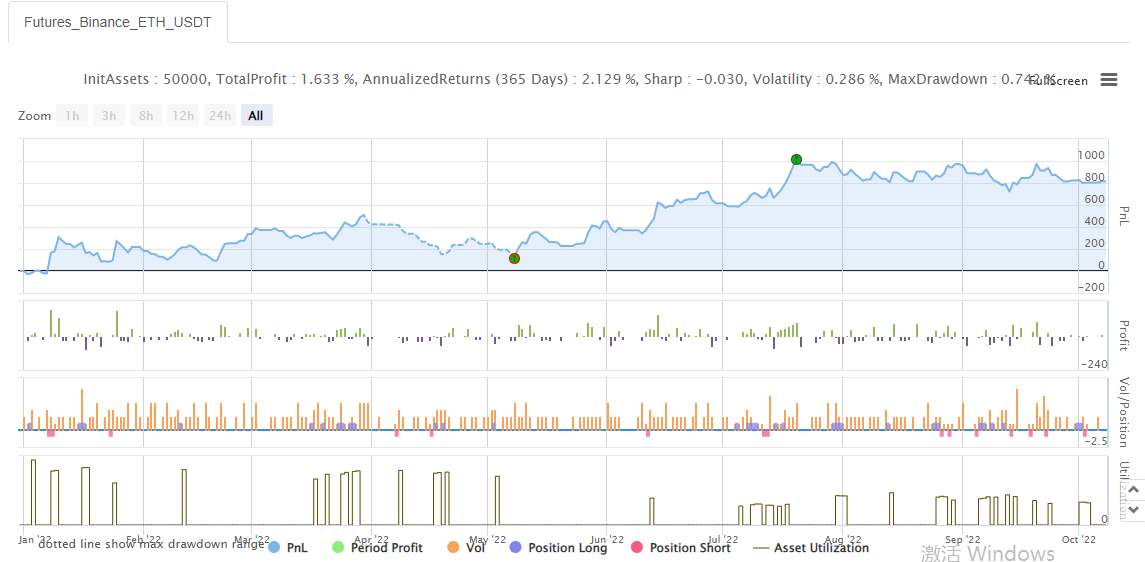
Os resultados do backtesting são comuns, e parece que os parâmetros de stop-loss têm alguma influência nos resultados do backtesting.
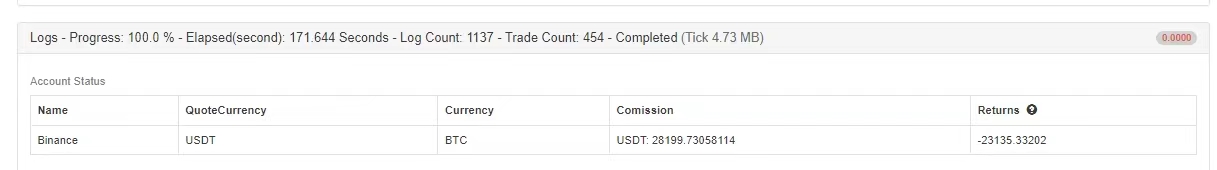
Vamos tentar um contrato perpétuo BTC_USDT diferente:
O resultado do backtest no BTC também foi muito lucrativo:
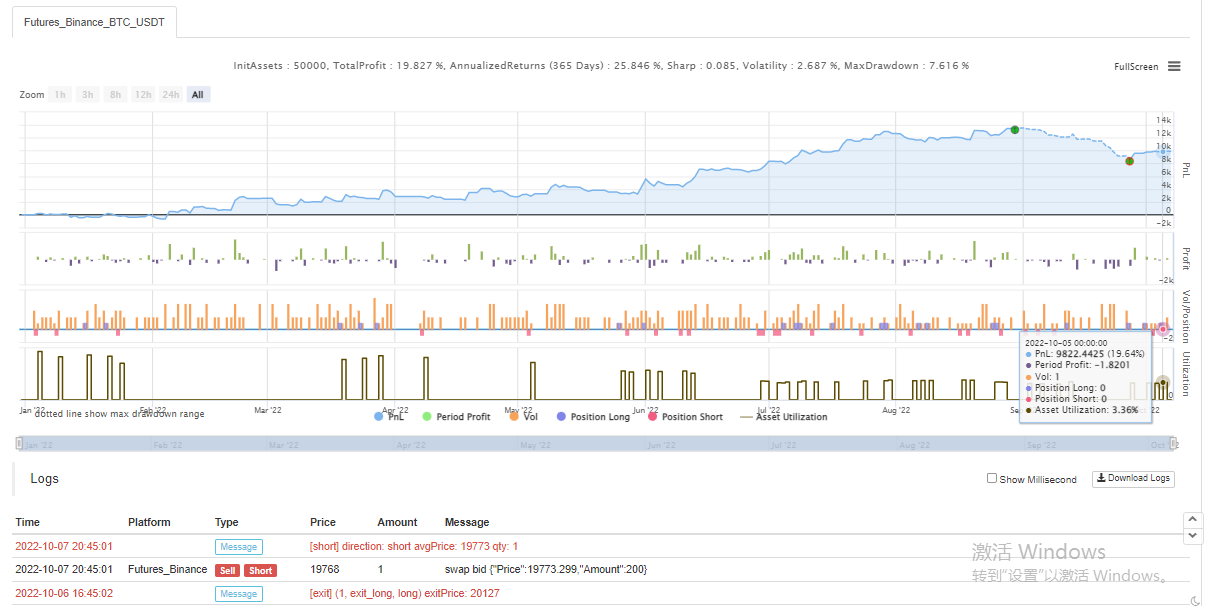
Estratégia de:https://www.fmz.com/strategy/385745
Parece que este método de negociação é relativamente confiável para entender a tendência, você pode continuar a otimizar o design de acordo com essa idéia. Neste artigo, não só aprendemos sobre a idéia de uma estratégia de média móvel dupla, mas também aprendemos como processar e aprender a estratégia dos veteranos no YouTube. OK, o código de estratégia acima é apenas meu tijolo e argamassa, os resultados do backtest não representam os resultados específicos do real-bot, o código de estratégia, o design são apenas para referência. Obrigado pelo seu apoio, veremos na próxima vez!
- Quantificar a análise fundamental no mercado de criptomoedas: deixe os dados falarem por si mesmos!
- A pesquisa quantitativa básica do círculo monetário - deixe de acreditar em todos os professores de matemática loucos, os dados são objetivos!
- Uma ferramenta indispensável no campo da transação quantitativa - inventor do módulo de exploração de dados quantitativos
- Dominar tudo - Introdução ao FMZ Nova versão do Terminal de Negociação (com TRB Arbitrage Source Code)
- Conheça tudo sobre a nova versão do terminal de negociação da FMZ
- FMZ Quant: Análise de Exemplos de Design de Requisitos Comuns no Mercado de Criptomoedas (II)
- Como explorar robôs de venda sem cérebro com uma estratégia de alta frequência em 80 linhas de código
- Quantificação FMZ: Análise de casos de design de necessidades comuns do mercado de criptomoedas (II)
- Como usar estratégias de 80 linhas de código de alta frequência para explorar robôs sem cérebro para venda
- FMZ Quant: Análise de Exemplos de Design de Requisitos Comuns no Mercado de Criptomoedas (I)
- Quantificação FMZ: Análise de casos de design de necessidades comuns do mercado de criptomoedas (I)