Количественная торговля криптовалютами для новичков - приближает вас к количественной криптовалюте (5)
Автор:Лидия., Создано: 2022-08-03 16:08:50, Обновлено: 2023-09-21 21:07:02
В предыдущей статье мы объяснили анализ логики торговли простой сетевой стратегии.
-
Анализ логики торговли Как мы упоминали в предыдущей статье, вы можете запустить торговое действие, пересекая каждую линию сетки и оценивая текущее пересечение цены выше или ниже.
Первая деталь, которую мы должны рассмотреть, это дизайн бесконечной сетки.
createNetЭта функция генерирует структуру данных сетки с конечным количеством линий сетки. Так что, если цена выходит за пределы этой структуры данных сетки (за пределы верхней линии сетки, где цена самая высокая, и нижней линии сетки, где цена самая низкая), когда стратегия работает? Так что сначала нам нужно добавить механизм расширения в структуру данных сетки.Давайте начнем писать стратегию главная функция, которая является кодом, где стратегия начинает выполнять
var diff = 50                                 // Global variables and grid spacing can be designed as parameters for easy explanation. We write this parameter into the code.
function main() {
    // After the real bot starts running, execute the strategy code from here
    var ticker = _C(exchange.GetTicker)       // To get the latest market data ticker, please refer to the FMZ API documentation for the structure of the ticker data: https://www.fmz.com/api#ticker
    var net = createNet(ticker.Last, diff)    // The function we designed in the previous article to construct the grid data structure initially, here we construct a grid data structure net

    while (true) {                            // Then the program logic enters this while infinite loop, and the strategy execution will continue to execute the code within the {} symbol here.
        ticker = _C(exchange.GetTicker)       // The first line of the infinite loop code section, get the latest market data and update it to the ticker variable
        // Check the grid range
        while (ticker.Last >= net[net.length - 1].price) {
            net.push({
                buy : false,
                sell : false,
                price : net[net.length - 1].price + diff,
            })
        }
        while (ticker.Last <= net[0].price) {
            var price = net[0].price - diff
            if (price <= 0) {
                break
            }
            net.unshift({
                buy : false,
                sell : false,
                price : price,
            })
        }

        // There are other codes...
    }
}
Для расширения структуры данных сетки используется следующий код (выдержанный из вышеперечисленного кода):
      // Check the grid range
      while (ticker.Last >= net[net.length - 1].price) {   // If the price exceeds the grid line of the highest price of the grid
          net.push({                                       // Just add a new grid line after the grid line with the highest price of the grid
              buy : false,                                 // Initialize sell marker
              sell : false,                                // Initialize buy marker
              price : net[net.length - 1].price + diff,    // dd a grid spacing to the previous highest price
          })
      }
      while (ticker.Last <= net[0].price) {                // If the price is lower than the grid line of the lowest price of the grid
          var price = net[0].price - diff                  // Different from adding upwards, it should be noted that the price of adding new grid lines downwards cannot be less than or equal to 0, so it is necessary to judge here
          if (price <= 0) {                                // Less than or equal to 0 will not be added, jump out of this loop
              break
          }
          net.unshift({                                    // Add a new grid line just before the grid line with the lowest price of the grid
              buy : false,
              sell : false,
              price : price,
          })
      }
Следующим шагом является рассмотрение того, как конкретно реализовать триггер торговли.
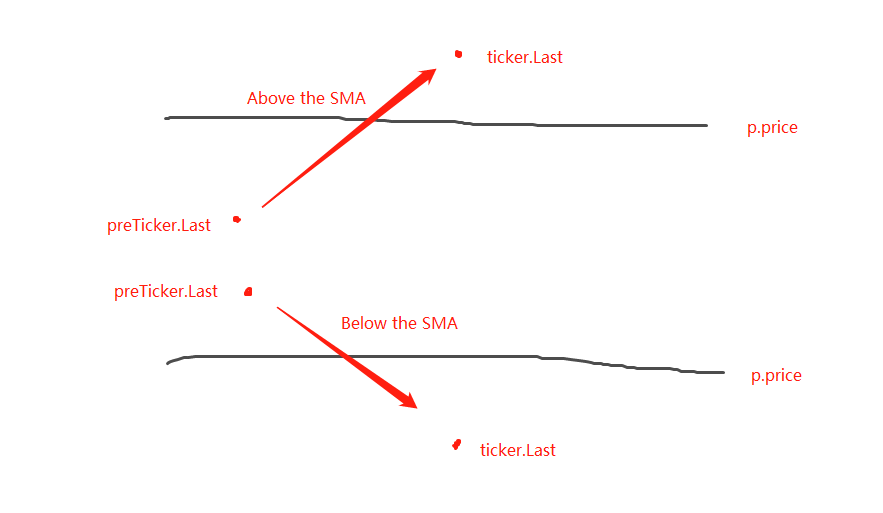
var diff = 50
var amount = 0.002       // Add a global variable, which can also be designed as a parameter. Of course, for the sake of simplicity, we also write it in the strategy code.
                         // This parameter controls the trade volume each time a trade is triggered on the grid line
function main() {
    var ticker = _C(exchange.GetTicker)
    var net = createNet(ticker.Last, diff)
    var preTicker = ticker       // Before the main loop (fixed loop) starts, set a variable to record the last market data
    while (true) {
        ticker = _C(exchange.GetTicker)
        // Check the grid range
        while (ticker.Last >= net[net.length - 1].price) {
            net.push({
                buy : false,
                sell : false,
                price : net[net.length - 1].price + diff,
            })
        }
        while (ticker.Last <= net[0].price) {
            var price = net[0].price - diff
            if (price <= 0) {
                break
            }
            net.unshift({
                buy : false,
                sell : false,
                price : price,
            })
        }

        // Retrieve grid
        for (var i = 0 ; i < net.length ; i++) {     // Iterate over all grid lines in the grid data structure
            var p = net[i]
            if (preTicker.Last < p.price && ticker.Last > p.price) {         // Above the SMA, sell, the current node has already traded, regardless of SELL BUY, it will no longer be traded
                if (i != 0) {
                    var downP = net[i - 1]
                    if (downP.buy) {
                        exchange.Sell(-1, amount, ticker)
                        downP.buy = false
                        p.sell = false
                        continue
                    }
                }
                if (!p.sell && !p.buy) {
                    exchange.Sell(-1, amount, ticker)
                    p.sell = true
                }
            } else if (preTicker.Last > p.price && ticker.Last < p.price) {  // Below the SMA, buy
                if (i != net.length - 1) {
                    var upP = net[i + 1]
                    if (upP.sell) {
                        exchange.Buy(-1, amount * ticker.Last, ticker)
                        upP.sell = false
                        p.buy = false
                        continue
                    }
                }
                if (!p.buy && !p.sell) {
                    exchange.Buy(-1, amount * ticker.Last, ticker)
                    p.buy = true
                }
            }
        }
        preTicker = ticker    // Record the current market data in preTicker, and in the next cycle, use it as a comparison between the "previous" market data and the latest one to judge whether to be above the SMA or below the SMA.
        Sleep(500)
    }
}
Можно заметить, что:
- Условия пересечения над линиями сетки:
preTicker.Last < p.price && ticker.Last > p.price - Условия для пересечения ниже линий сетки:
preTicker.Last > p.price && ticker.Last < p.price
Вот что мы сказали в предыдущем посте:
- Условия пересечения над линиями сетки:
Суждение о том, следует ли быть выше SMA или ниже SMA, является лишь первым шагом в определении возможности размещения заказа, и также необходимо судить о знаках в данных сетевой линии.
Если он выше SMA, то считается, что цена ниже текущей сетевой линии и знака покупки на ближайшей сетевой линии. Если значение знака покупки верно, это означает, что предыдущая сетевая линия была куплена, а предыдущая сетевая линия продана.
После оценки условий, если нет триггера, продолжайте судить. Если знаки покупки/продажи на текущей линии сетки являются ложными, это означает, что текущая линия сетки может быть торговаться. Поскольку она находится выше SMA, мы будем выполнять операцию продажи здесь. После выполнения маркируйте текущую линию сетки как истинную.
Логика обработки одинакова для того, чтобы быть ниже SMA (оставьте для начинающих думать здесь).
Полная обратная проверка стратегии
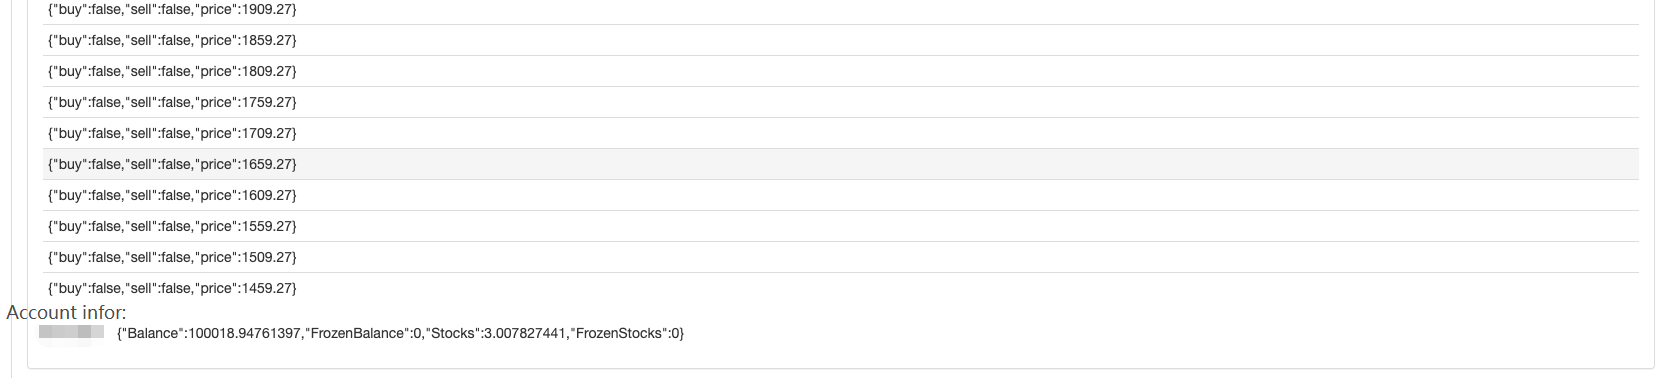
Для того, чтобы увидеть некоторые данные во время обратного тестирования, функцияshowTblнаписано для отображения данных.
function showTbl(arr) {
    var tbl = {
        type : "table",
        title : "grid",
        cols : ["grid information"],
        rows : []
    }
    var arrReverse = arr.slice(0).reverse()
    _.each(arrReverse, function(ele) {
        var color = ""
        if (ele.buy) {
            color = "#FF0000"
        } else if (ele.sell) {
            color = "#00FF00"
        }
        tbl.rows.push([JSON.stringify(ele) + color])
    })
    LogStatus(_D(), "\n`" + JSON.stringify(tbl) + "`", "\n account Information:", exchange.GetAccount())
}
Полный код стратегии:
/*backtest
start: 2021-04-01 22:00:00
end: 2021-05-22 00:00:00
period: 1d
basePeriod: 1m
exchanges: [{"eid":"OKEX","currency":"ETH_USDT","balance":100000}]
*/

var diff = 50
var amount = 0.002
function createNet(begin, diff) {
    var oneSideNums = 10
    var up = []
    var down = []
    for (var i = 0 ; i < oneSideNums ; i++) {
        var upObj = {
            buy : false,
            sell : false,
            price : begin + diff / 2 + i * diff,
        }
        up.push(upObj)

        var j = (oneSideNums - 1) - i
        var downObj = {
            buy : false,
            sell : false,
            price : begin - diff / 2 - j * diff,
        }
        if (downObj.price <= 0) {  // The price cannot be less than or equal to 0
            continue
        }
        down.push(downObj)
    }

    return down.concat(up)
}

function showTbl(arr) {
    var tbl = {
        type : "table",
        title : "grid",
        cols : ["grid Information"],
        rows : []
    }
    var arrReverse = arr.slice(0).reverse()
    _.each(arrReverse, function(ele) {
        var color = ""
        if (ele.buy) {
            color = "#FF0000"
        } else if (ele.sell) {
            color = "#00FF00"
        }
        tbl.rows.push([JSON.stringify(ele) + color])
    })
    LogStatus(_D(), "\n`" + JSON.stringify(tbl) + "`", "\n account Information:", exchange.GetAccount())
}

function main() {
    var ticker = _C(exchange.GetTicker)
    var net = createNet(ticker.Last, diff)
    var preTicker = ticker
    while (true) {
        ticker = _C(exchange.GetTicker)
        // Check the grid range
        while (ticker.Last >= net[net.length - 1].price) {
            net.push({
                buy : false,
                sell : false,
                price : net[net.length - 1].price + diff,
            })
        }
        while (ticker.Last <= net[0].price) {
            var price = net[0].price - diff
            if (price <= 0) {
                break
            }
            net.unshift({
                buy : false,
                sell : false,
                price : price,
            })
        }

        // Retrieve grid
        for (var i = 0 ; i < net.length ; i++) {
            var p = net[i]
            if (preTicker.Last < p.price && ticker.Last > p.price) {         // Being above the SMA, sell, the current node has already traded, regardless of SELL BUY, it will no longer be traded
                if (i != 0) {
                    var downP = net[i - 1]
                    if (downP.buy) {
                        exchange.Sell(-1, amount, ticker)
                        downP.buy = false
                        p.sell = false
                        continue
                    }
                }
                if (!p.sell && !p.buy) {
                    exchange.Sell(-1, amount, ticker)
                    p.sell = true
                }
            } else if (preTicker.Last > p.price && ticker.Last < p.price) {  // Being below the SMA, buy
                if (i != net.length - 1) {
                    var upP = net[i + 1]
                    if (upP.sell) {
                        exchange.Buy(-1, amount * ticker.Last, ticker)
                        upP.sell = false
                        p.buy = false
                        continue
                    }
                }
                if (!p.buy && !p.sell) {
                    exchange.Buy(-1, amount * ticker.Last, ticker)
                    p.buy = true
                }
            }
        }

        showTbl(net)
        preTicker = ticker
        Sleep(500)
    }
}
Опрос стратегии:
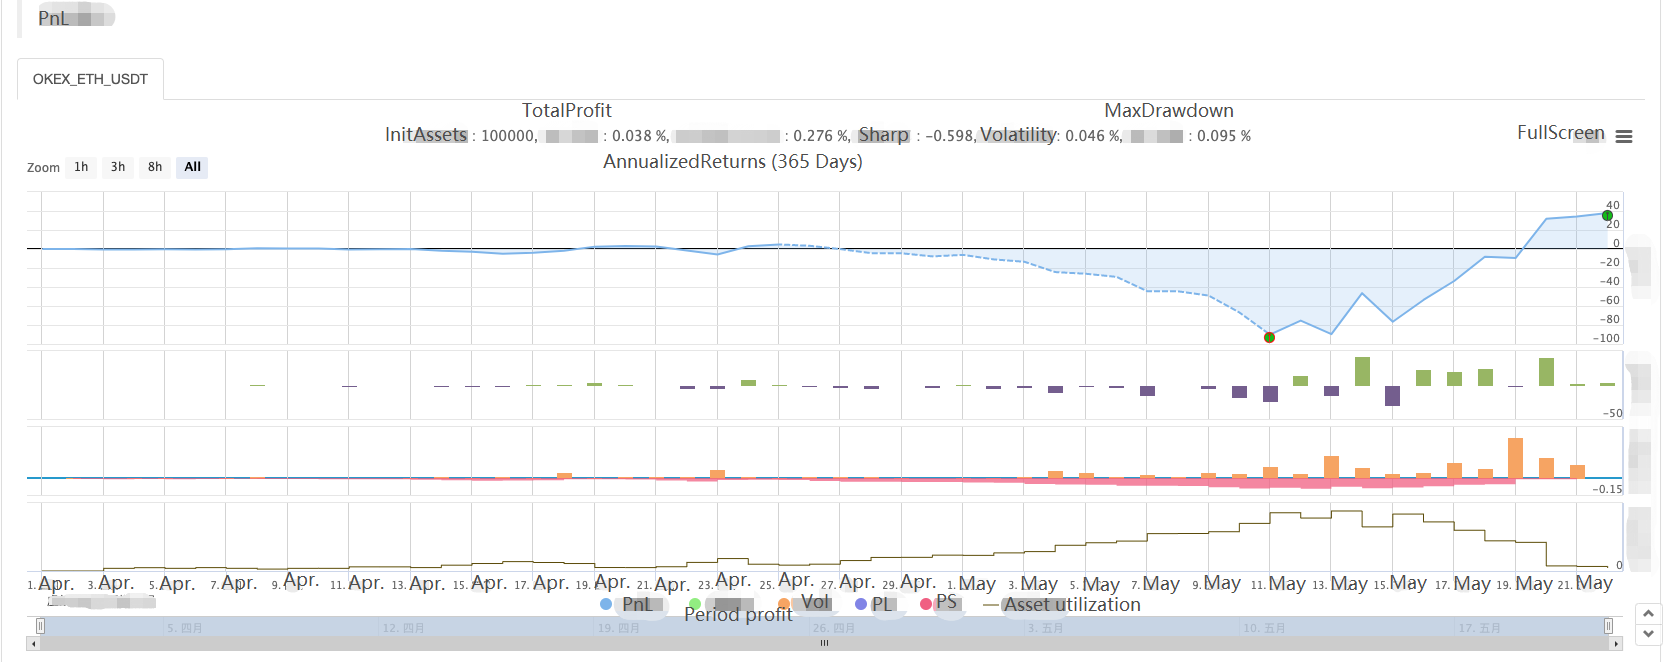
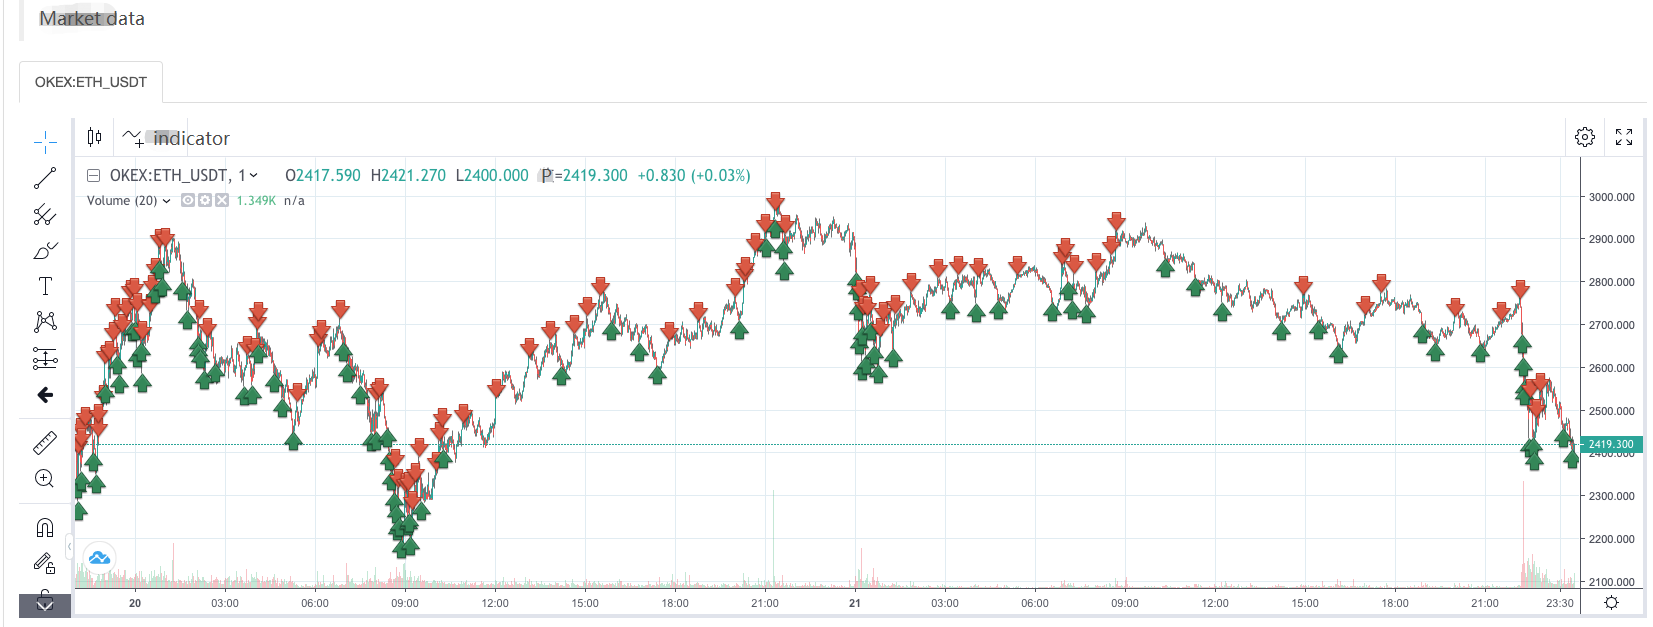
Таким образом, мы можем увидеть характеристики стратегии сети, когда есть трендовый рынок, будет большой плавающий убыток, и прибыль восстановится на волатильном рынке.
Таким образом, сетевая стратегия не является безрисковой. Спотная стратегия все еще может быть
- Количественный анализ фундаментального анализа на рынке криптовалют: пусть данные говорят сами за себя!
- Не стоит больше верить всяким хитроумным учителям, которые говорят, что данные объективны.
- Необходимый инструмент для количественной торговли - изобретатель модуля количественного исследования данных
- Освоение всего - Введение в FMZ Новая версия торгового терминала (с TRB Arbitrage Source Code)
- Ознакомьтесь с новым типом терминала FMZ (с кодом TRB)
- FMZ Quant: Анализ общих требований Примеры проектирования на рынке криптовалют (II)
- Как использовать бесмозговых роботов с высокочастотной стратегией в 80 строках кода
- Квалификация FMZ: Анализ примеров дизайна общих потребностей на рынке криптовалют (II)
- Как использовать высокочастотную стратегию 80-линейного кода для эксплуатации безмозговых роботов
- FMZ Quant: Анализ общих требований Примеры проектирования на рынке криптовалют (I)
- Квалификация FMZ: Анализ примеров дизайна общих потребностей на рынке криптовалют (1)