"Волшебная двойная стратегия EMA" от ветеранов YouTube
Автор:Лидия., Создано: 2022-11-07 12:02:31, Обновлено: 2023-09-15 20:51:23
"Волшебная двойная стратегия EMA" ветеранов YouTube
В этом выпуске мы собираемся обсудить
Показатели, используемые в стратегии
- Показатели EMA
Ради простоты дизайна, мы не будем использовать экспоненциал скользящей средней, перечисленный в видео, мы будем использовать встроенный ta.ema торгового вида вместо этого (это на самом деле то же самое).
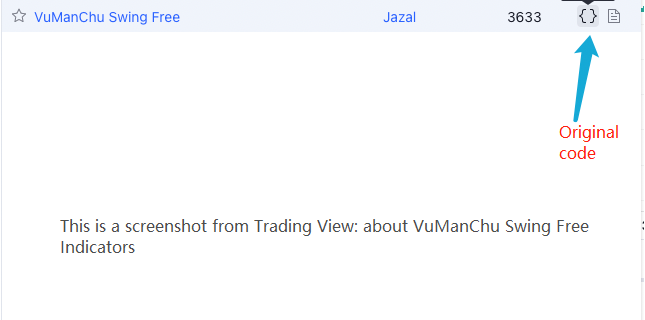
- Индикаторы свободного колебания VuManChu
Это индикатор на Trading View, нам нужно перейти на Trading View и забрать исходный код.
Код VuManChu Swing Free:
// This source code is subject to the terms of the Mozilla Public License 2.0 at https://mozilla.org/MPL/2.0/

// Credits to the original Script - Range Filter DonovanWall https://www.tradingview.com/script/lut7sBgG-Range-Filter-DW/
// This version is the old version of the Range Filter with less settings to tinker with

//@version=4
study(title="Range Filter - B&S Signals", shorttitle="RF - B&S Signals", overlay=true)

//-----------------------------------------------------------------------------------------------------------------------------------------------------------------
//Functions
//-----------------------------------------------------------------------------------------------------------------------------------------------------------------

//Range Size Function
rng_size(x, qty, n)=>
//    AC       = Cond_EMA(abs(x - x[1]), 1, n)
    wper      = (n*2) - 1
    avrng     = ema(abs(x - x[1]), n)
    AC = ema(avrng, wper)*qty
    rng_size = AC

//Range Filter Function
rng_filt(x, rng_, n)=>
    r          = rng_
    var rfilt  = array.new_float(2, x)
    array.set(rfilt, 1, array.get(rfilt, 0))
    if x - r > array.get(rfilt, 1)
        array.set(rfilt, 0, x - r)
    if x + r < array.get(rfilt, 1)
        array.set(rfilt, 0, x + r)
    rng_filt1 = array.get(rfilt, 0)

    hi_band   = rng_filt1 + r
    lo_band   = rng_filt1 - r
    rng_filt  = rng_filt1
    [hi_band, lo_band, rng_filt]

//-----------------------------------------------------------------------------------------------------------------------------------------------------------------
//Inputs
//-----------------------------------------------------------------------------------------------------------------------------------------------------------------

//Range Source
rng_src = input(defval=close, type=input.source, title="Swing Source")

//Range Period
rng_per = input(defval=20, minval=1, title="Swing Period")

//Range Size Inputs
rng_qty   = input(defval=3.5, minval=0.0000001, title="Swing Multiplier")

//Bar Colors
use_barcolor = input(defval=false, type=input.bool, title="Bar Colors On/Off")

//-----------------------------------------------------------------------------------------------------------------------------------------------------------------
//Definitions
//-----------------------------------------------------------------------------------------------------------------------------------------------------------------

//Range Filter Values
[h_band, l_band, filt] = rng_filt(rng_src, rng_size(rng_src, rng_qty, rng_per), rng_per)

//Direction Conditions
var fdir = 0.0
fdir    := filt > filt[1] ? 1 : filt < filt[1] ? -1 : fdir
upward   = fdir==1 ? 1 : 0
downward = fdir==-1 ? 1 : 0

//Trading Condition
longCond = rng_src > filt and rng_src > rng_src[1] and upward > 0 or rng_src > filt and rng_src < rng_src[1] and upward > 0
shortCond = rng_src < filt and rng_src < rng_src[1] and downward > 0 or rng_src < filt and rng_src > rng_src[1] and downward > 0

CondIni = 0
CondIni := longCond ? 1 : shortCond ? -1 : CondIni[1]
longCondition = longCond and CondIni[1] == -1
shortCondition = shortCond and CondIni[1] == 1

//Colors
filt_color = upward ? #05ff9b : downward ? #ff0583 : #cccccc
bar_color  = upward and (rng_src > filt) ? (rng_src > rng_src[1] ? #05ff9b : #00b36b) :
             downward and (rng_src < filt) ? (rng_src < rng_src[1] ? #ff0583 : #b8005d) : #cccccc

//-----------------------------------------------------------------------------------------------------------------------------------------------------------------
//Outputs
//-----------------------------------------------------------------------------------------------------------------------------------------------------------------

//Filter Plot
filt_plot = plot(filt, color=filt_color, transp=67, linewidth=3, title="Filter")

//Band Plots
h_band_plot = plot(h_band, color=color.new(#05ff9b, 100), title="High Band")
l_band_plot = plot(l_band, color=color.new(#ff0583, 100), title="Low Band")

//Band Fills
fill(h_band_plot, filt_plot, color=color.new(#00b36b, 92), title="High Band Fill")
fill(l_band_plot, filt_plot, color=color.new(#b8005d, 92), title="Low Band Fill")

//Bar Color
barcolor(use_barcolor ? bar_color : na)

//Plot Buy and Sell Labels
plotshape(longCondition, title = "Buy Signal", text ="BUY", textcolor = color.white, style=shape.labelup, size = size.normal, location=location.belowbar, color = color.new(color.green, 0))
plotshape(shortCondition, title = "Sell Signal", text ="SELL", textcolor = color.white, style=shape.labeldown, size = size.normal, location=location.abovebar, color = color.new(color.red, 0))

//Alerts
alertcondition(longCondition, title="Buy Alert", message = "BUY")
alertcondition(shortCondition, title="Sell Alert", message = "SELL")
Логика стратегии
Индикатор EMA: стратегия использует две EMA, одна из которых является быстрой линией (параметр малого периода) и другой - медленной линией (параметр большого периода).
-
соглашение о длинной позиции Быстрая линия выше медленной линии.
-
договоренность о короткой позиции Быстрая линия ниже медленной линии.
Индикатор VuManChu Swing Free: Индикатор VuManChu Swing Free используется для отправки сигналов и оценки необходимости размещения ордера в сочетании с другими условиями. Из исходного кода индикатора VuManChu Swing Free можно увидеть, что переменная longCondition представляет сигнал покупки, а переменная shortCondition - сигнал продажи. Эти две переменные будут использоваться для последующей записи условий размещения ордера.
Теперь давайте поговорим о конкретных условиях запуска торгового сигнала:
-
Правила входа в длинную позицию: Цена закрытия положительной K-линии должна быть выше быстрой линии EMA, две EMA должны быть длинной позицией (быстрая линия выше медленной линии), а индикатор VuManChu Swing Free должен показывать сигнал покупки (longCondition true).
-
Правила входа в короткую позицию (в отличие от длинной позиции): Цена закрытия отрицательной K-линии должна быть ниже быстрой линии EMA, две EMA должны быть короткой позицией (быстрая линия ниже медленной линии), а индикатор VuManChu Swing Free должен показывать сигнал продажи (shortCondition true).
Поскольку в исходном видео не указано остановка прибыли и остановка убытков, я буду использовать умеренный метод остановки прибыли и остановки убытков свободно, используя фиксированные точки для остановки убытков и отслеживания остановки прибыли.
Конструкция кода
Код для индикатора VuManChu Swing Free, мы поместили его в наш стратегический код прямо без каких-либо изменений.
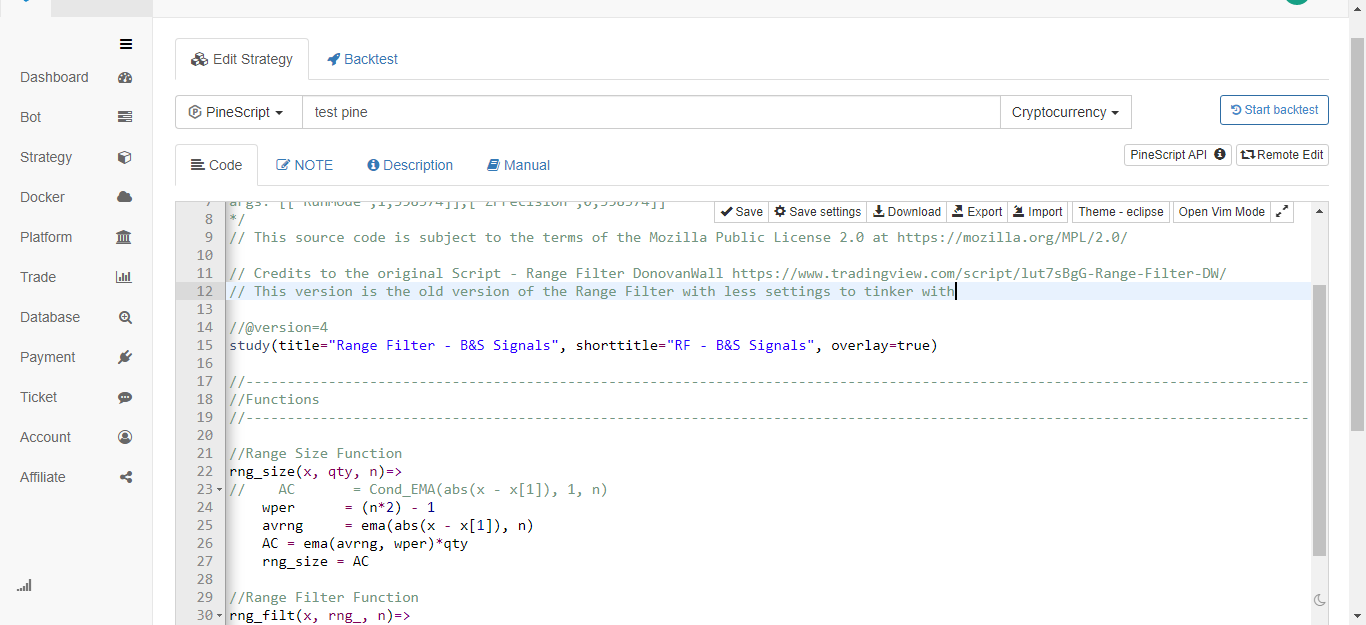
Сразу после этого мы пишем кусок кода на языке Пайн, который реализует торговую функцию:
// extend
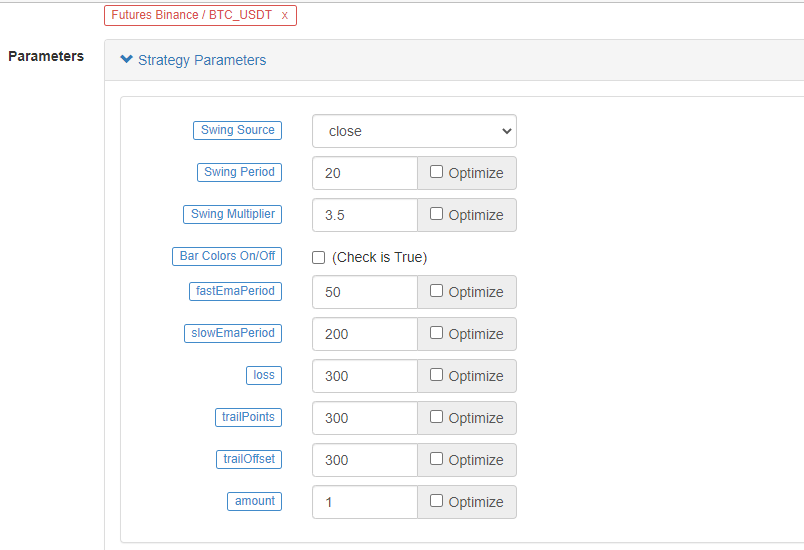
fastEmaPeriod = input(50, "fastEmaPeriod") // fast line period
slowEmaPeriod = input(200, "slowEmaPeriod") // slow line period
loss = input(30, "loss") // stop loss points
trailPoints = input(30, "trailPoints") // number of trigger points for moving stop loss
trailOffset = input(30, "trailOffset") // moving stop profit offset (points)
amount = input(1, "amount") // order amount
emaFast = ta.ema(close, fastEmaPeriod) // calculate the fast line EMA
emaSlow = ta.ema(close, slowEmaPeriod) // calculate the slow line EMA
buyCondition = longCondition and emaFast > emaSlow and close > open and close > emaFast // entry conditions for long positions
sellCondition = shortCondition and emaFast < emaSlow and close < open and close < emaFast // entry conditions for short positions
if buyCondition and strategy.position_size == 0
strategy.entry("long", strategy.long, amount)
strategy.exit("exit_long", "long", amount, loss=loss, trail_points=trailPoints, trail_offset=trailOffset)
if sellCondition and strategy.position_size == 0
strategy.entry("short", strategy.short, amount)
strategy.exit("exit_short", "short", amount, loss=loss, trail_points=trailPoints, trail_offset=trailOffset)
A.Itможно увидеть, что когда buyCondition является истинным, то есть:
- Переменная longCondition true (индикатор VuManChu Swing Free посылает сигнал длинной позиции).
- emaFast > emaSlow (выравнивание длинной позиции EMA).
- close > open (значит текущая BAR положительная), close > emaFast (значит цена закрытия выше быстрой линии EMA).
Три условия для длительного действия.
B.Когда условие sellCondition является истинным, три условия для создания короткой позиции действительны (не повторяются здесь).
Затем мы используем функцию strategy.entry для ввода и открытия позиции в случае если условие суждения сигнал триггер, и установитьstrategy.exitФункция остановить убытки и отследить прибыль одновременно.
Полный код
/*backtest
start: 2022-01-01 00:00:00
end: 2022-10-08 00:00:00
period: 15m
basePeriod: 5m
exchanges: [{"eid":"Futures_Binance","currency":"ETH_USDT"}]
args: [["ZPrecision",0,358374]]
*/

// This source code is subject to the terms of the Mozilla Public License 2.0 at https://mozilla.org/MPL/2.0/

// Credits to the original Script - Range Filter DonovanWall https://www.tradingview.com/script/lut7sBgG-Range-Filter-DW/
// This version is the old version of the Range Filter with less settings to tinker with

//@version=4
study(title="Range Filter - B&S Signals", shorttitle="RF - B&S Signals", overlay=true)

//-----------------------------------------------------------------------------------------------------------------------------------------------------------------
//Functions
//-----------------------------------------------------------------------------------------------------------------------------------------------------------------

//Range Size Function
rng_size(x, qty, n)=>
//    AC       = Cond_EMA(abs(x - x[1]), 1, n)
    wper      = (n*2) - 1
    avrng     = ema(abs(x - x[1]), n)
    AC = ema(avrng, wper)*qty
    rng_size = AC

//Range Filter Function
rng_filt(x, rng_, n)=>
    r          = rng_
    var rfilt  = array.new_float(2, x)
    array.set(rfilt, 1, array.get(rfilt, 0))
    if x - r > array.get(rfilt, 1)
        array.set(rfilt, 0, x - r)
    if x + r < array.get(rfilt, 1)
        array.set(rfilt, 0, x + r)
    rng_filt1 = array.get(rfilt, 0)

    hi_band   = rng_filt1 + r
    lo_band   = rng_filt1 - r
    rng_filt  = rng_filt1
    [hi_band, lo_band, rng_filt]

//-----------------------------------------------------------------------------------------------------------------------------------------------------------------
//Inputs
//-----------------------------------------------------------------------------------------------------------------------------------------------------------------

//Range Source
rng_src = input(defval=close, type=input.source, title="Swing Source")

//Range Period
rng_per = input(defval=20, minval=1, title="Swing Period")

//Range Size Inputs
rng_qty   = input(defval=3.5, minval=0.0000001, title="Swing Multiplier")

//Bar Colors
use_barcolor = input(defval=false, type=input.bool, title="Bar Colors On/Off")

//-----------------------------------------------------------------------------------------------------------------------------------------------------------------
//Definitions
//-----------------------------------------------------------------------------------------------------------------------------------------------------------------

//Range Filter Values
[h_band, l_band, filt] = rng_filt(rng_src, rng_size(rng_src, rng_qty, rng_per), rng_per)

//Direction Conditions
var fdir = 0.0
fdir    := filt > filt[1] ? 1 : filt < filt[1] ? -1 : fdir
upward   = fdir==1 ? 1 : 0
downward = fdir==-1 ? 1 : 0

//Trading Condition
longCond = rng_src > filt and rng_src > rng_src[1] and upward > 0 or rng_src > filt and rng_src < rng_src[1] and upward > 0
shortCond = rng_src < filt and rng_src < rng_src[1] and downward > 0 or rng_src < filt and rng_src > rng_src[1] and downward > 0

CondIni = 0
CondIni := longCond ? 1 : shortCond ? -1 : CondIni[1]
longCondition = longCond and CondIni[1] == -1
shortCondition = shortCond and CondIni[1] == 1

//Colors
filt_color = upward ? #05ff9b : downward ? #ff0583 : #cccccc
bar_color  = upward and (rng_src > filt) ? (rng_src > rng_src[1] ? #05ff9b : #00b36b) :
             downward and (rng_src < filt) ? (rng_src < rng_src[1] ? #ff0583 : #b8005d) : #cccccc

//-----------------------------------------------------------------------------------------------------------------------------------------------------------------
//Outputs
//-----------------------------------------------------------------------------------------------------------------------------------------------------------------

//Filter Plot
filt_plot = plot(filt, color=filt_color, transp=67, linewidth=3, title="Filter")

//Band Plots
h_band_plot = plot(h_band, color=color.new(#05ff9b, 100), title="High Band")
l_band_plot = plot(l_band, color=color.new(#ff0583, 100), title="Low Band")

//Band Fills
fill(h_band_plot, filt_plot, color=color.new(#00b36b, 92), title="High Band Fill")
fill(l_band_plot, filt_plot, color=color.new(#b8005d, 92), title="Low Band Fill")

//Bar Color
barcolor(use_barcolor ? bar_color : na)

//Plot Buy and Sell Labels
plotshape(longCondition, title = "Buy Signal", text ="BUY", textcolor = color.white, style=shape.labelup, size = size.normal, location=location.belowbar, color = color.new(color.green, 0))
plotshape(shortCondition, title = "Sell Signal", text ="SELL", textcolor = color.white, style=shape.labeldown, size = size.normal, location=location.abovebar, color = color.new(color.red, 0))

//Alerts
alertcondition(longCondition, title="Buy Alert", message = "BUY")
alertcondition(shortCondition, title="Sell Alert", message = "SELL")


// extend
fastEmaPeriod = input(50, "fastEmaPeriod")
slowEmaPeriod = input(200, "slowEmaPeriod")
loss = input(30, "loss")
trailPoints = input(30, "trailPoints")
trailOffset = input(30, "trailOffset")
amount = input(1, "amount")

emaFast = ta.ema(close, fastEmaPeriod)
emaSlow = ta.ema(close, slowEmaPeriod)

buyCondition = longCondition and emaFast > emaSlow and close > open and close > emaFast
sellCondition = shortCondition and emaFast < emaSlow and close < open and close < emaFast

if buyCondition and strategy.position_size == 0
    strategy.entry("long", strategy.long, amount)
    strategy.exit("exit_long", "long", amount, loss=loss, trail_points=trailPoints, trail_offset=trailOffset)
if sellCondition and strategy.position_size == 0
    strategy.entry("short", strategy.short, amount)
    strategy.exit("exit_short", "short", amount, loss=loss, trail_points=trailPoints, trail_offset=trailOffset)
Обратный тест
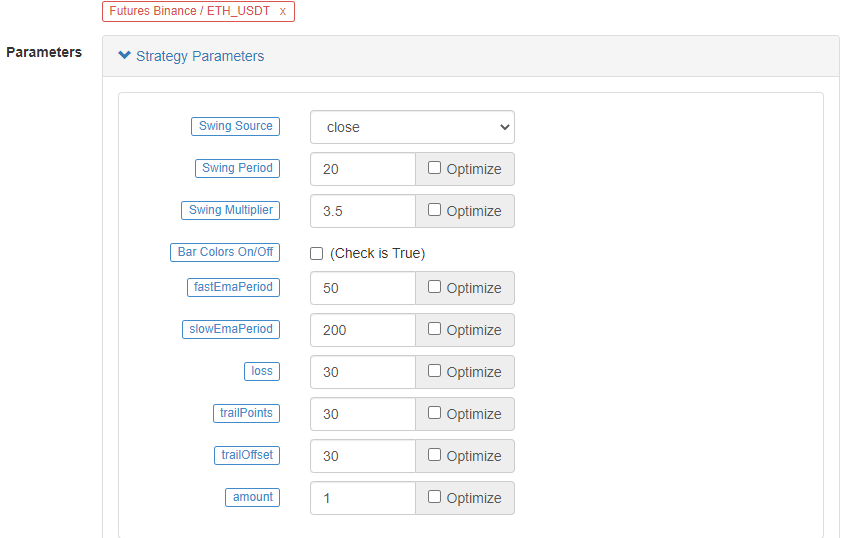
Временный диапазон бэкстеста составляет с января 2022 года по октябрь 2022 года. Период K-линии составляет 15 минут, и для бэкстеста используется модель ценового закрытия. Рынок выбирает вечный контракт Binance ETH_USDT. Параметры устанавливаются в соответствии с 50 периодами быстрой линии и 200 периодами медленной линии в исходном видео. Другие параметры остаются неизменными по умолчанию. Я субъективно устанавливаю точки остановки потери и отслеживания остановки прибыли до 30 пунктов.
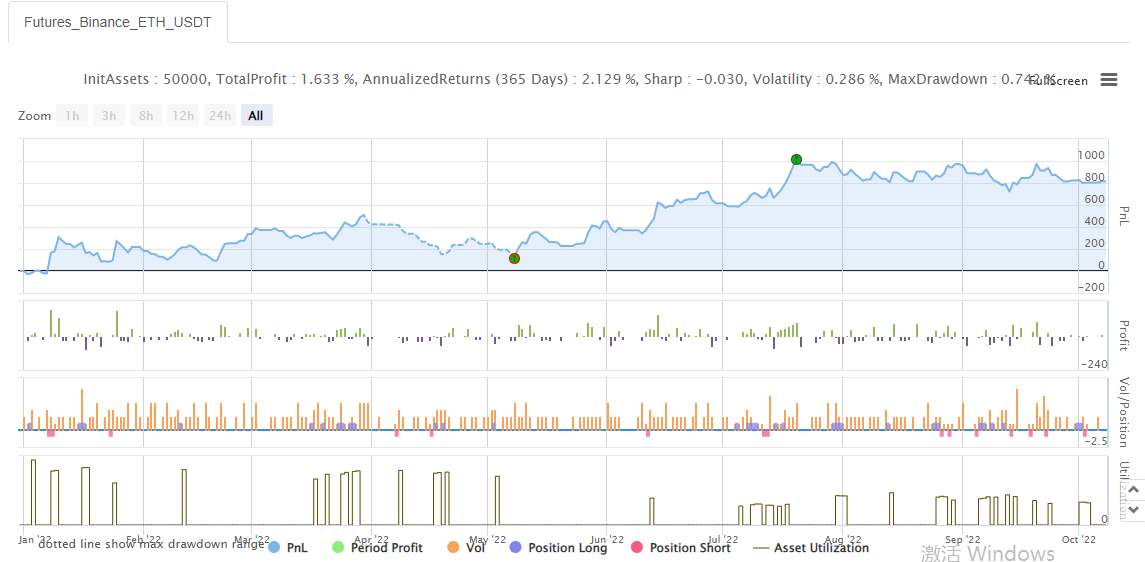
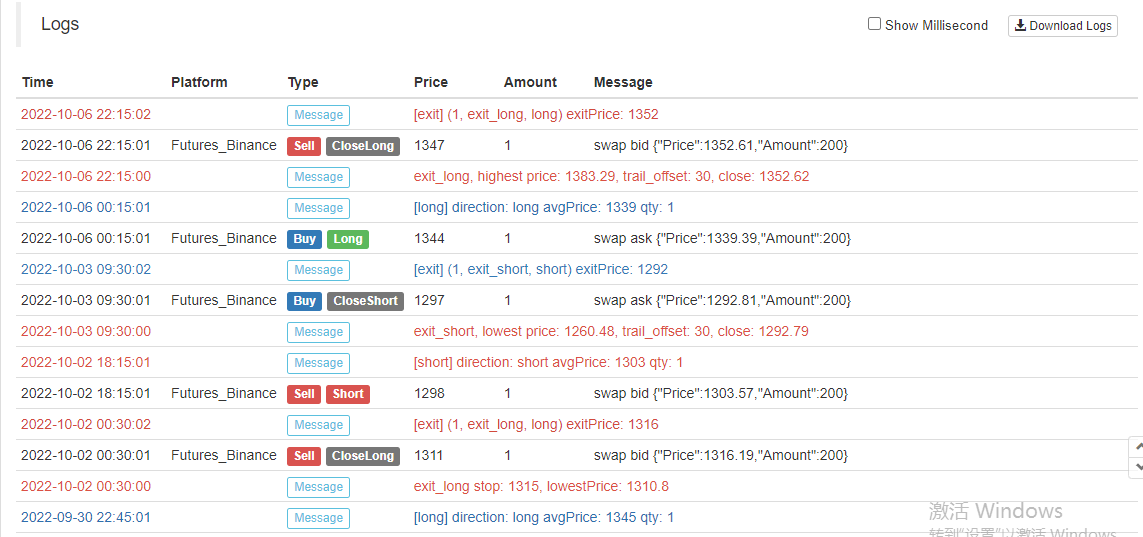
Результаты обратного тестирования обычные, и, похоже, параметры стоп-лосса оказывают некоторое влияние на результаты обратного тестирования. Я чувствую, что этот аспект все еще должен быть оптимизирован и разработан. Однако после того, как стратегический сигнал запускает торговлю, выигрышный показатель все еще в порядке.
Давайте попробуем другой BTC_USDT вечный контракт:
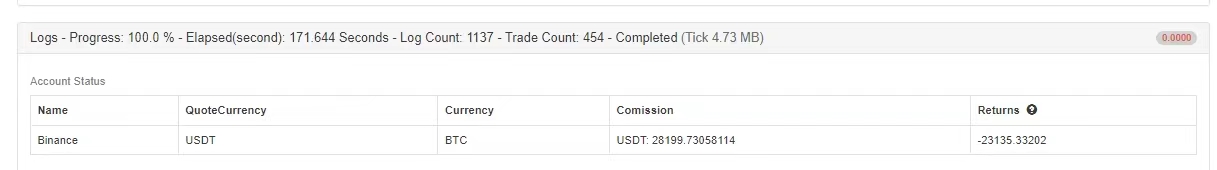
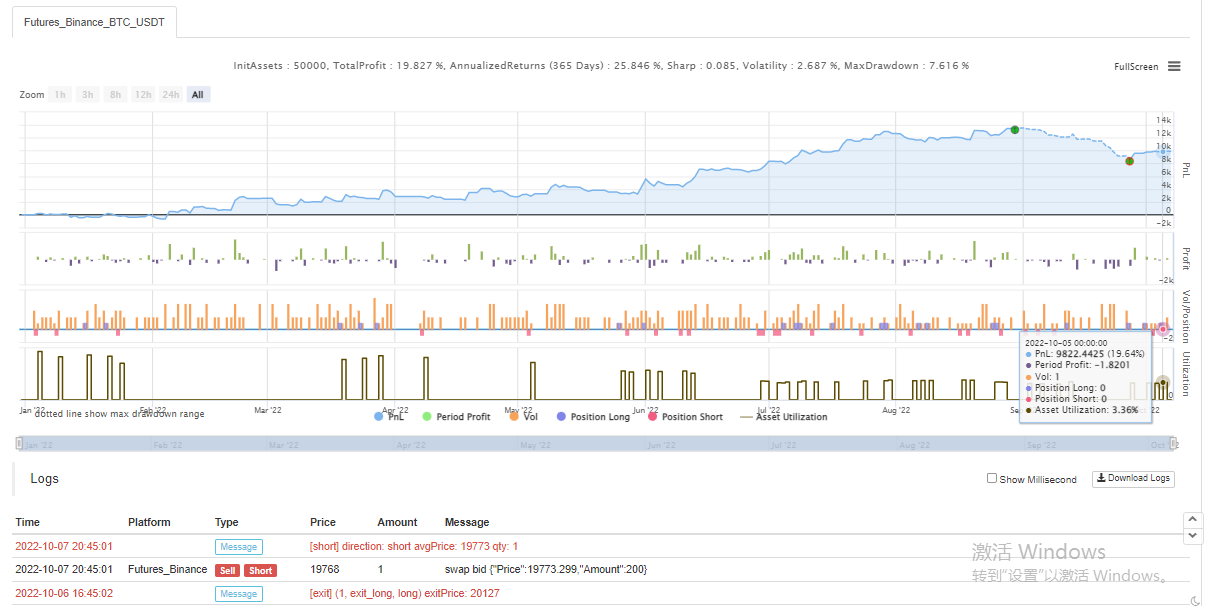
Результат обратного теста на BTC также был очень прибыльным:
Стратегия от:https://www.fmz.com/strategy/385745
Кажется, что этот торговый метод относительно надежный для понимания тренда, вы можете продолжать оптимизировать дизайн в соответствии с этой идеей. В этой статье мы не только узнали об идее двойной стратегии скользящей средней, но и научились обрабатывать и изучать стратегию ветеранов на YouTube. Хорошо, вышеприведенный код стратегии - это только мой кирпич и миномет, результаты бэкстеста не представляют конкретных результатов реального бота, код стратегии, дизайн являются для справки только. Спасибо за вашу поддержку, увидимся в следующий раз!
- Количественный анализ фундаментального анализа на рынке криптовалют: пусть данные говорят сами за себя!
- Не стоит больше верить всяким хитроумным учителям, которые говорят, что данные объективны.
- Необходимый инструмент для количественной торговли - изобретатель модуля количественного исследования данных
- Освоение всего - Введение в FMZ Новая версия торгового терминала (с TRB Arbitrage Source Code)
- Ознакомьтесь с новым типом терминала FMZ (с кодом TRB)
- FMZ Quant: Анализ общих требований Примеры проектирования на рынке криптовалют (II)
- Как использовать бесмозговых роботов с высокочастотной стратегией в 80 строках кода
- Квалификация FMZ: Анализ примеров дизайна общих потребностей на рынке криптовалют (II)
- Как использовать высокочастотную стратегию 80-линейного кода для эксплуатации безмозговых роботов
- FMZ Quant: Анализ общих требований Примеры проектирования на рынке криптовалют (I)
- Квалификация FMZ: Анализ примеров дизайна общих потребностей на рынке криптовалют (1)