Научить вас добавить поддержку многографика к стратегии
Автор:Лидия., Создано: 2022-12-26 11:28:50, Обновлено: 2023-09-20 09:52:47
Научить вас добавить поддержку многографика к стратегии
Особенно при написании стратегий тренда, иногда вы путаетесь с условиями запуска различных индикаторов. В это время срочно необходимо визуализировать данные для анализа и просмотра. При добавлении одного графика к стратегии вы можете использовать шаблон
Вот пример для справки. Я комментирую примерный код строку за строкой. Когда вы закончите читать код, у вас будет новое понимание добавления поддержки диаграммы к стратегии.
/*backtest
start: 2019-07-01 00:00:00
end: 2019-08-24 00:00:00
period: 1h
exchanges: [{"eid":"Futures_OKCoin","currency":"BTC_USD"}]
args: [["IsSynthesisDayKL",true]]
*/
var chart0 = {
__isStock: true,
// /*
extension: {
layout: 'single',
height: 300,
},
// */
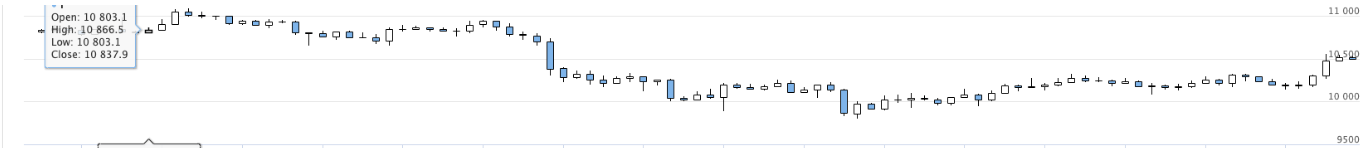
title : { text : 'Daily K-line chart'},
xAxis: { type: 'datetime'},
series : [
{
type: 'candlestick',
name: 'r',
id: 'r',
data: []
}
]
}
var chart1 = {
__isStock: true,
// /*
extension: {
layout: 'single',
height: 300,
},
// */
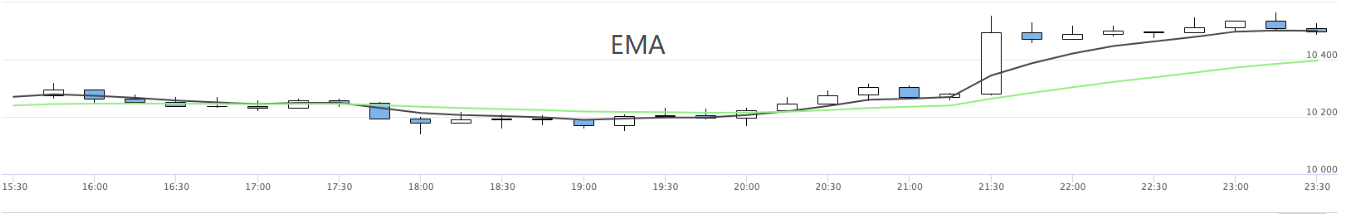
title : { text : 'EMA'},
xAxis: { type: 'datetime'},
series : [
{
type: 'candlestick',
name: 'r1',
id: 'r1',
data: []
}, {
type: 'line',
name: 'chart1_EMA1',
data: [],
}, {
type: 'line',
name: 'chart1_EMA2',
data: []
}
]
}
var chart2 = {
__isStock: true,
// /*
extension: {
layout: 'single',
height: 300,
},
// */
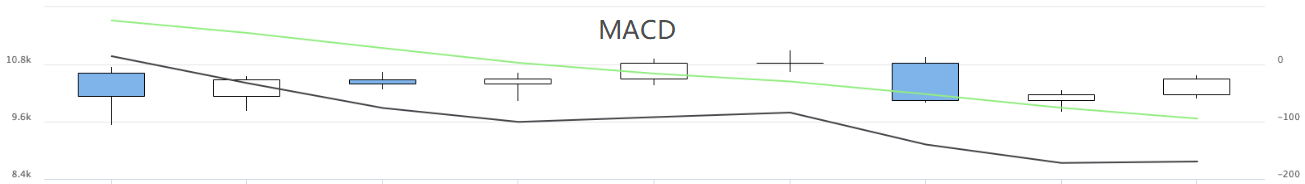
title : { text : 'MACD'},
xAxis: { type: 'datetime'},
yAxis : [
{
title: {text: 'price'},
opposite: false
}, {
title:{text: "Indicator axis"},
opposite: true,
}
],
series : [
{
type: 'candlestick',
name: 'r2',
id: 'r2',
data: []
}, {
type: 'line',
yAxis: 1,
name: 'dif',
data: []
}, {
type: 'line',
yAxis: 1,
name: 'dea',
data: []
}
]
}
function CreatePlotter (e, chart) {
var obj = {} // Declare an empty object for adding methods in the following code, and finally return this object, that is, the constructed drawing object.
obj.e = e // The reference to the exchange object passed by the parameter is assigned to a property of the obj object.
obj.params = {} // Constructed parameters
obj.params.EMA_param1 = 5 // We preset the parameters of some indicators on the chart to be used in the calculation of the indicator, for example, an EMA indicator line parameter.
obj.params.EMA_param2 = 20 // The second EMA indicator line parameters, usually small parameters are called fast lines, large parameters are called slow lines.
obj.params.MACD_fast = 12 // MACD parameter
obj.params.MACD_slow = 26 // MACD parameter
obj.params.MACD_sig = 9 // MACD parameter
obj.runTime = {} // Used to store some data during runtime.
obj.runTime.arrPreBarTime = [0, 0, 0] // Store the timestamp of the previous bar of each K-line data for comparison.
obj.GetAllRecords = function () { // A method of the drawing object, used to get the K-line data, our example is used to display three charts at the same time, so, the function get three different periods of K-line data at the same time.
obj.r = _C(obj.e.GetRecords, PERIOD_H1) // The K-line data of the first chart, which is the 1-hour level K-line data.
Sleep(1000)
obj.r1 = _C(obj.e.GetRecords, PERIOD_M15) // The K-line data of the second chart, which is the 15-minute level K-line data.
Sleep(1000)
obj.r2 = _C(obj.e.GetRecords, PERIOD_D1) // The K-line data of the third chart, which is the daily level K-line data.
}
obj.Run = function () { // Execute the functions of drawing objects.
obj.Plot() // Execute the specific drawing code.
}
obj.CalcMACD = function (r, fast, slow, sig) { // MACD indicator calculation function, return MACD indicator data.
if (r.length <= Math.max(fast, slow, sig)) {
return false
}
return TA.MACD(r, fast, slow, sig)
}
obj.Plot = function () { // Focus section with specific drawing code.
obj.GetAllRecords() // Before each plot, update all K-line data first.
var arr = [obj.r, obj.r1, obj.r2] // Put all K-line data in an array and traverse it.
var arrKIndex = [0, 1, 4] // Indexing of K-line data series in chart objects.
for (var i = 0; i < arr.length; i++) { // Traversal operations
for (var j = 0; j < arr[i].length; j++) {
if (arr[i][j].Time == obj.runTime.arrPreBarTime[i]) { // When the last bar of the K-line data is not updated, we only update the data and do not add it. Note that when the chart.add function is called, the last parameter uses -1, which means that the data is updated and not added.
chart.add(arrKIndex[i], [arr[i][j].Time, arr[i][j].Open, arr[i][j].High, arr[i][j].Low, arr[i][j].Close], -1)
if (i == 1) { // Update the EMA indicator data in the second chart.
var nowR = arr[i].slice(0, j + 1)
var ema1 = TA.EMA(nowR, obj.params.EMA_param1)
var ema2 = TA.EMA(nowR, obj.params.EMA_param2)
if (obj.r2.length <= obj.params.EMA_param1 || obj.r2.length <= obj.params.EMA_param2 || isNaN(ema1[j]) || isNaN(ema2[j])) {
continue
}
chart.add(2, [arr[i][j].Time, ema1[ema1.length - 1]], -1)
chart.add(3, [arr[i][j].Time, ema2[ema2.length - 1]], -1)
} else if (i == 2) { // Update the MACD indicator data in the third chart
var nowR = arr[i].slice(0, j + 1)
var macd = obj.CalcMACD(nowR, obj.params.MACD_fast, obj.params.MACD_slow, obj.params.MACD_sig)
if (!macd) {
continue
}
var dif = macd[0]
var dea = macd[1]
chart.add(5, [arr[i][j].Time, dif[dif.length - 1]], -1)
chart.add(6, [arr[i][j].Time, dea[dea.length - 1]], -1)
}
} else if (arr[i][j].Time > obj.runTime.arrPreBarTime[i]) { // When the last bar of the current K-line data is larger than the last bar timestamp recorded previously, it indicates that a new bar has been generated for the K-line. At this time, a new bar and a new indicator data point should be added.
obj.runTime.arrPreBarTime[i] = arr[i][j].Time // Update the record of the last bar timestamp for the next comparison. If the next timestamp is the same, data will not be added unless a new bar is generated.
chart.add(arrKIndex[i], [arr[i][j].Time, arr[i][j].Open, arr[i][j].High, arr[i][j].Low, arr[i][j].Close])
if (i == 1) {
var nowR = arr[i].slice(0, j + 1)
var ema1 = TA.EMA(nowR, obj.params.EMA_param1)
var ema2 = TA.EMA(nowR, obj.params.EMA_param2)
if (nowR.length <= obj.params.EMA_param1 || nowR.length <= obj.params.EMA_param2 || isNaN(ema1[ema1.length - 1]) || isNaN(ema2[ema2.length - 1])) {
continue
}
chart.add(2, [arr[i][j].Time, ema1[ema1.length - 1]])
chart.add(3, [arr[i][j].Time, ema2[ema2.length - 1]])
} else if (i == 2) {
var nowR = arr[i].slice(0, j + 1)
var macd = obj.CalcMACD(nowR, obj.params.MACD_fast, obj.params.MACD_slow, obj.params.MACD_sig)
if (!macd) {
continue
}
var dif = macd[0]
var dea = macd[1]
chart.add(5, [arr[i][j].Time, dif[dif.length - 1]])
chart.add(6, [arr[i][j].Time, dea[dea.length - 1]])
}
}
}
}
}
obj.Plot()
return obj
}
function main () {
var chart = Chart([chart0, chart1, chart2])
chart.reset()
exchange.SetContractType("quarter")
var plotter = CreatePlotter(exchange, chart)
while (true) {
plotter.Run()
Sleep(1000)
}
}
Мы начинаем с того, что смотрим наmainФункция:
function main () {                                  // Strategy entry function, of course, this strategy does not do anything, there are no transactions, just drawing charts.
    var chart = Chart([chart0, chart1, chart2])     // chart0, chart1, chart2 are pre-declared chart configuration objects, call the Chart function is to load the chart configuration, return a chart control object chart.
    chart.reset()                                   // Call the reset method of the chart control object chart to reset the chart.

    exchange.SetContractType("quarter")             // The backtest configuration is OKX futures, so here to set the contract, the contract is set to quarter.
    var plotter = CreatePlotter(exchange, chart)    // Call the CreatePlotter function to generate the plotter object -- plotter.
    while (true) {
        plotter.Run()                               // Execute drawing object plotter member function Run to draw.
        Sleep(1000)                                 // The drawing object plotter is responsible for "how to draw", and the chart control object chart is responsible for specific drawing. The former is implemented by our code, and the latter is the control object returned by the underlying API function of the system.
    }
}
Далее мы увидим, какCreatePlotterфункция реализует функцию рисования при построении объекта рисования.var plotter=CreatePlotter(exchange, chart)Первый используется для получения данных K-линии (позвонив exchange.GetRecords), а второй используется для работы с графиком и добавления данных к графику.
Самой важной частью сюжета являетсяPlotКомментарии были написаны в коде.
Операция обратного тестирования:
Таким образом, можно отобразить несколько графиков стратегий.
- Количественный анализ фундаментального анализа на рынке криптовалют: пусть данные говорят сами за себя!
- Не стоит больше верить всяким хитроумным учителям, которые говорят, что данные объективны.
- Необходимый инструмент для количественной торговли - изобретатель модуля количественного исследования данных
- Освоение всего - Введение в FMZ Новая версия торгового терминала (с TRB Arbitrage Source Code)
- Ознакомьтесь с новым типом терминала FMZ (с кодом TRB)
- FMZ Quant: Анализ общих требований Примеры проектирования на рынке криптовалют (II)
- Как использовать бесмозговых роботов с высокочастотной стратегией в 80 строках кода
- Квалификация FMZ: Анализ примеров дизайна общих потребностей на рынке криптовалют (II)
- Как использовать высокочастотную стратегию 80-линейного кода для эксплуатации безмозговых роботов
- FMZ Quant: Анализ общих требований Примеры проектирования на рынке криптовалют (I)
- Квалификация FMZ: Анализ примеров дизайна общих потребностей на рынке криптовалют (1)