Стратегия торговли с множественным равновесием цен и разворотом тренда

ATR SL TP
Дата создания: 2024-12-13 10:23:12 Последнее изменение: 2024-12-13 10:23:12
Копировать: 0 Количество просмотров: 364
1
Подписаться
1617
Подписчики

Стратегия торговли с множественным равновесием цен и разворотом тренда

Обзор стратегии

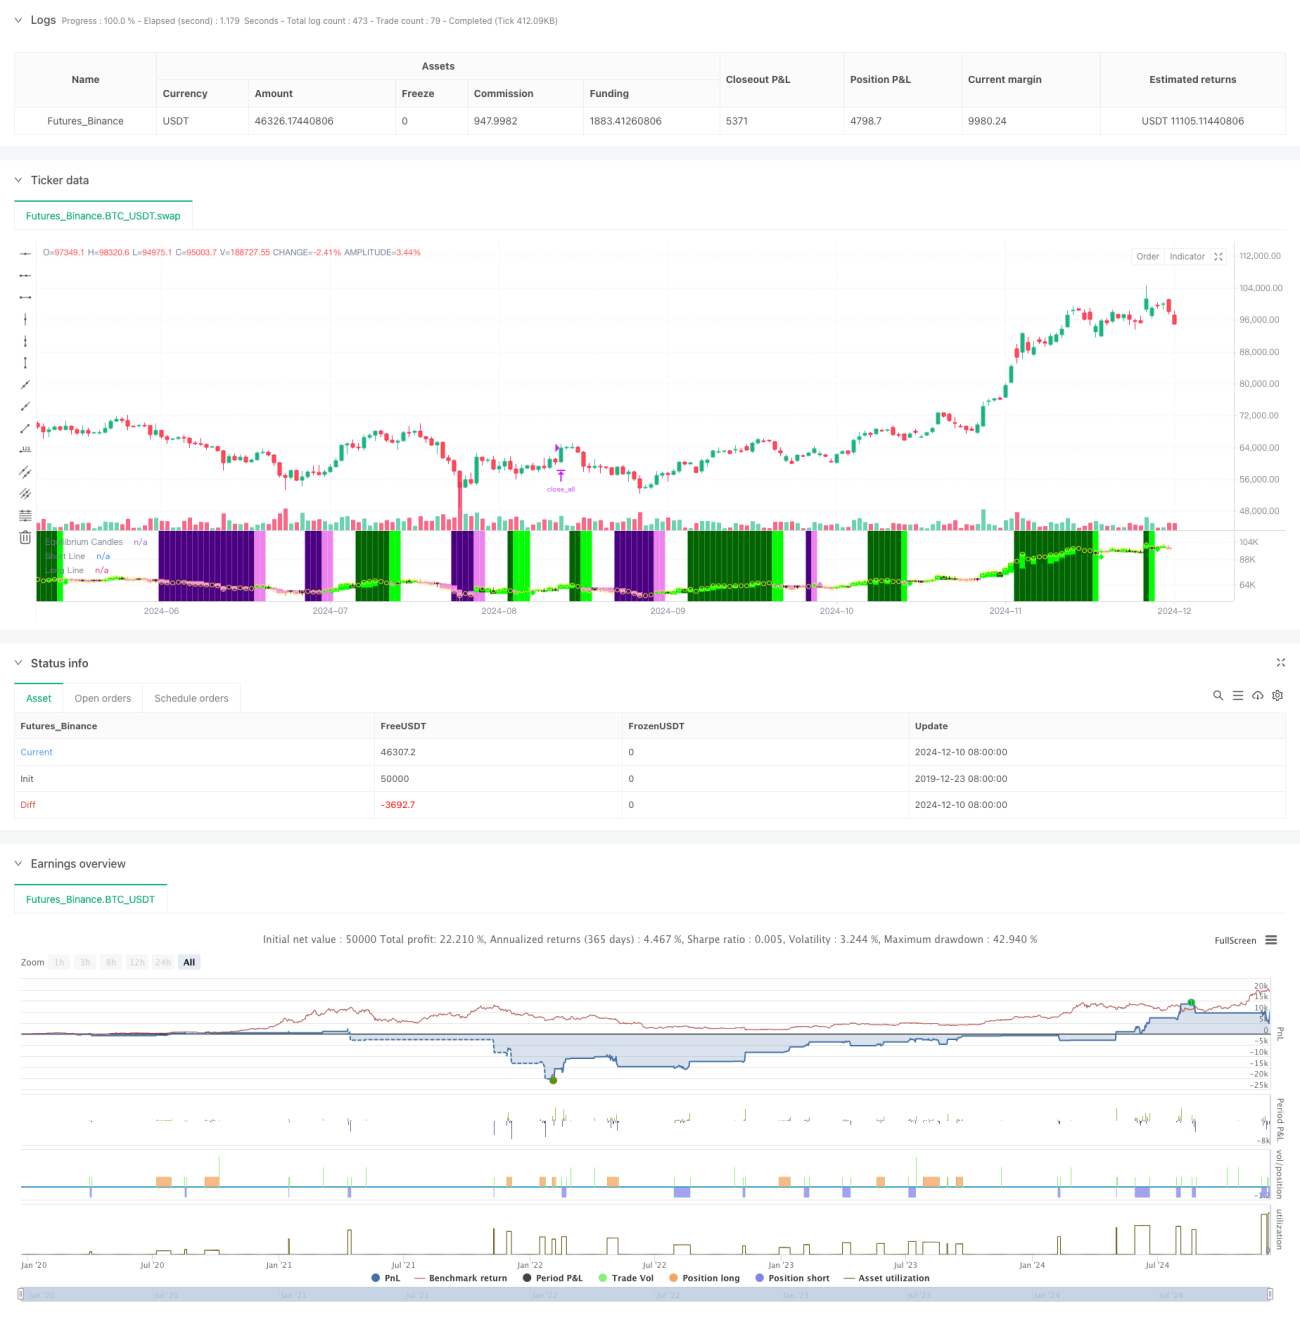
Стратегия является системой отслеживания трендов и обратной торговли, основанной на точке равновесия цен. Она определяет равновесную цену, рассчитывая средние значения наивысших и наименьших точек прошлых X-корневых линий K, и определяет направление тренда на основании положения цены закрытия относительно равновесной цены.

Стратегический принцип

  1. Расчет равновесной цены: используется средняя точка между самой высокой и самой низкой ценой на прошедшей X-корневой K-линии в качестве равновесной цены, что идентично методу расчета базовой линии на первичной равновесной диаграмме.
  2. Определение тренда: когда цена на одной стороне равновесной цены постоянно сохраняет X-корневую K-линию (по умолчанию 7 корней), определяется как тренд.
  3. Входный сигнал: вызывает входный сигнал при первом отклонении после установления тренда (когда цена пересекает равновесную цену).
  4. Стоп-стоп: использование 60-процентного знака ATR для динамического регулирования стоп-стоп-дистанции, обеспечивающего гибкость управления рисками.
  5. Большая защита от колебаний: когда цена отклоняется от равновесия сверх установленного ATR-множества, система автоматически сглаживает позиции, чтобы предотвратить резкое отступление.

Стратегические преимущества

  1. Гибкость: можно гибко переключаться в зависимости от рыночных особенностей, отслеживать тенденции и обращать вспять торговые модели.
  2. Управление рисками: использование динамического ATR-стоп-лощадка с защитой от значительных колебаний.
  3. Операционная ясность: четкие торговые сигналы, не зависящие от сложных комбинаций технических индикаторов.
  4. Хорошая визуализация: использование цветных K-линий и фона для предоставления интуитивного представления состояния рынка.
  5. Дружественность к автоматизации: легко подключить к торговым платформам, таким как MT5, для автоматизированной торговли.

Стратегический риск

  1. Риск возникновения шокирующих рынков: частое возникновение ложных сигналов на рынках, в которых наблюдается шокирование по боковой стороне.
  2. Влияние скольжения: при сильных колебаниях может возникнуть большое скольжение.
  3. Чувствительность параметров: ключевые параметры, такие как период равновесия, циклы определения тенденций и т. д., должны быть тщательно оптимизированы для разных рынков.
  4. Риск переключения рынка: переходный период от тренда к колебаниям может привести к значительному отступлению.

Направление оптимизации стратегии

  1. Идентификация рыночной среды: добавление модуля оценки рыночной среды, динамическая корректировка параметров стратегии в различных рыночных условиях.
  2. Фильтрация сигнала: подумайте о том, чтобы включить дополнительные показатели, такие как объем трафика, волатильность и т. д., чтобы отфильтровать ложный сигнал.
  3. Управление позициями: внедрение более сложных механизмов управления позициями, таких как динамическая корректировка на основе волатильности.
  4. Многочасовой цикл: объединение сигналов из нескольких временных периодов для повышения точности торгов.
  5. Оптимизация затрат на сделки: оптимизация затратных характеристик для различных видов сделок во время выхода на рынок.

Подвести итог

Это разумно разработанная система торговли тенденциями, которая обеспечивает четкую логику торговли с помощью уравновешенной цены. Самая большая особенность этой стратегии заключается в том, что она является гибкой, может использоваться как для отслеживания тенденций, так и для реверсивной торговли, а также имеет совершенный механизм управления рисками. Хотя в некоторых рыночных условиях она может столкнуться с проблемами, благодаря постоянной оптимизации и гибкой корректировке эта стратегия будет стабильно работать в различных рыночных условиях.

Исходный код стратегии
/*backtest
start: 2019-12-23 08:00:00
end: 2024-12-11 08:00:00
period: 1d
basePeriod: 1d
exchanges: [{"eid":"Futures_Binance","currency":"BTC_USDT"}]
*/

// This Pine Script™ code is subject to the terms of the Mozilla Public License 2.0 at https://mozilla.org/MPL/2.0/
// © Honestcowboy

//@version=5
strategy("Equilibrium Candles + Pattern [Honestcowboy]", overlay=false)

// ================================== //
// ---------> User Input <----------- //
// ================================== //

candleSmoothing = input.int(9, title="Equilibrium Length", tooltip="The lookback for finding equilibrium.\nIt is same calculation as the Baseline in Ichimoku Cloud and is the mid point between highest and lowest value over this length.", group="Base Settings")
candlesForTrend = input.int(7, title="Candles needed for Trend", tooltip="The amount of candles in one direction (colored) before it's considered a trend.\nOrders get created on the first candle in opposite direction.", group="Base Settings")
maxPullbackCandles = input.int(2, title="Max Pullback (candles)", tooltip="The amount of candles can go in opposite direction until a pending trade order is cancelled.", group="Base Settings")
candle_bull_c1 = input.color(color.rgb(0,255,0), title="", inline="1", group="Candle Coloring")
candle_bull_c2 = input.color(color.rgb(0,100,0), title="", inline="1", group="Candle Coloring")
candle_bear_c1 = input.color(color.rgb(238,130,238), title="", inline="2", group="Candle Coloring")
candle_bear_c2 = input.color(color.rgb(75,0,130), title="", inline="2", group="Candle Coloring")
highlightClosePrices = input.bool(defval=true, title="Highlight close prices", group="Candle Coloring", tooltip="Will put small yellow dots where closing price would be.")
useBgColoring = input.bool(defval=true, title="color main chart Bg based on trend and entry point", tooltip="colors main chart background based on trend and entry points", group="Chart Background")
trend_bull_c = input.color(color.rgb(0,100,0,50), title="Trend Bull Color", group="Chart Background")
trend_bear_c = input.color(color.rgb(75,0,130, 50), title="Trend Bear Color", group="Chart Background")
long_zone_c = input.color(color.rgb(0,255,0,60), title="Long Entry Zone Color", group="Chart Background")
short_zone_c = input.color(color.rgb(238,130,238,60), title="Short Entry Zone Color", group="Chart Background")
atrLenghtScob = input.int(14, title="ATR Length", group = "Volatility Settings")
atrAverageLength = input.int(200, title="ATR percentile averages lookback", group = "Volatility Settings")
atrPercentile    = input.int(60, minval=0, maxval=99, title="ATR > bottom X percentile", group = "Volatility Settings", tooltip="For the Final ATR value in which percentile of last X bars does it need to be a number. At 60 it's the lowest ATR in top 40% of ATR over X bars")
useReverse = input.bool(true, title="Use Reverse", group="Strategy Inputs", tooltip="The Strategy will open short orders where normal strategy would open long orders. It will use the SL as TP and the TP as SL. So would create the exact opposite in returns as the normal strategy.")
stopMultiplier = input.float(2, title="stop+tp atr multiplier", group="Strategy Inputs")
useTPSL = input.bool(defval=true, title="use stop and TP", group="Strategy Inputs")
useBigCandleExit = input.bool(defval=true, title="Big Candle Exit", group="Strategy Inputs", inline="1", tooltip="Closes all open trades whenever price closes too far from the equilibrium")
bigCandleMultiplier = input.float(defval=1, title="Exit Multiplier", group="Strategy Inputs", inline="1", tooltip="The amount of times in ATR mean candle needs to close outside of equilibrium for it to be a big candle exit.")

tvToQPerc = input.float(defval=1, title="Trade size in Account risk %", group="Tradingview.to Connection (MT5)", tooltip="Quantity as a percentage with stop loss in the commands; the lot size is calculated based on the percentage to lose in case sl is hit. If SL is not specified, the Lot size will be calculated based on account balance.")
tvToOverrideSymbol = input.bool(defval=false, title="Override Symbol?", group="Tradingview.to Connection (MT5)")
tvToSymbol = input.string(defval="EURUSD", title="", group="Tradingview.to Connection (MT5)")
// ================================== //
// -----> Immutable Constants <------ //
// ================================== // 

var bool isBullTrend = false
var bool isBearTrend = false
var bool isLongCondition = false
var bool isShortCondition = false
var int bullCandleCount = 0
var int bearCandleCount = 0
var float longLine = na
var float shortLine = na

// ================================== //
// ---> Functional Declarations <---- //
// ================================== //

baseLine(len) =>
    math.avg(ta.lowest(len), ta.highest(len))

// ================================== //
// ----> Variable Calculations <----- //
// ================================== //

longSignal = false
shortSignal = false

equilibrium = baseLine(candleSmoothing)
atrEquilibrium = ta.atr(atrLenghtScob)
atrAveraged = ta.percentile_nearest_rank(atrEquilibrium, atrAverageLength, atrPercentile)
equilibriumTop  = equilibrium + atrAveraged*bigCandleMultiplier
equilibriumBottom = equilibrium - atrAveraged*bigCandleMultiplier

// ================================== //
// -----> Conditional Variables <---- //
// ================================== //
if not isBullTrend and close>equilibrium
    bullCandleCount := bullCandleCount + 1
    bearCandleCount := 0
    isBearTrend := false

if not isBearTrend and close<equilibrium
    bearCandleCount := bearCandleCount + 1
    bullCandleCount := 0
    isBullTrend := false

if bullCandleCount >= candlesForTrend
    isBullTrend := true
    isBearTrend := false
    bullCandleCount := 0
    bearCandleCount := 0
if bearCandleCount >= candlesForTrend
    isBearTrend := true
    isBullTrend := false
    bullCandleCount := 0
    bearCandleCount := 0

// ================================== //
// ------> Strategy Execution <------ //
// ================================== //

if isBullTrend[1] and close<equilibrium
    if useReverse and (not na(atrAveraged))
        strategy.entry("short", strategy.short, limit=high)
        alert("Sell " + str.tostring((tvToOverrideSymbol ? tvToSymbol : syminfo.ticker)) + " Q=" + str.tostring(tvToQPerc) + "% P=" + str.tostring(high) + " TP=" + str.tostring(high-stopMultiplier*atrAveraged)+ " SL=" + str.tostring(high+stopMultiplier*atrAveraged), freq=alert.freq_once_per_bar)
    if (not useReverse) and (not na(atrAveraged))
        strategy.entry("long", strategy.long, stop=high)
        alert("Buy " + str.tostring((tvToOverrideSymbol ? tvToSymbol : syminfo.ticker)) + " Q=" + str.tostring(tvToQPerc) + "% P=" + str.tostring(high) + " TP=" + str.tostring(high+stopMultiplier*atrAveraged) + " SL=" + str.tostring(high+stopMultiplier*atrAveraged), freq=alert.freq_once_per_bar)
    isLongCondition := true
    isBullTrend := false
    longLine := high

if isBearTrend[1] and close>equilibrium
    if useReverse and (not na(atrAveraged))
        strategy.entry("long", strategy.long, limit=low)
        alert("Buy " + str.tostring((tvToOverrideSymbol ? tvToSymbol : syminfo.ticker)) + " Q=" + str.tostring(tvToQPerc) + "% P=" + str.tostring(low) + " TP=" + str.tostring(low+stopMultiplier*atrAveraged) + " SL=" + str.tostring(low-stopMultiplier*atrAveraged), freq=alert.freq_once_per_bar)
    if (not useReverse) and (not na(atrAveraged))
        strategy.entry("short", strategy.short, stop=low)
        alert("Sell " + str.tostring((tvToOverrideSymbol ? tvToSymbol : syminfo.ticker)) + " Q=" + str.tostring(tvToQPerc) + "% P=" + str.tostring(low) + " TP=" + str.tostring(low-stopMultiplier*atrAveraged) + " SL=" + str.tostring(low+stopMultiplier*atrAveraged), freq=alert.freq_once_per_bar)
    isShortCondition := true
    isBearTrend := false
    shortLine := low

if isLongCondition and (bearCandleCount >= maxPullbackCandles)[1]
    if useReverse
        strategy.cancel("short")
        alert("Cancel " + str.tostring((tvToOverrideSymbol ? tvToSymbol : syminfo.ticker)) + " t=sell")
    if not useReverse
        strategy.cancel("long")
        alert("Cancel " + str.tostring((tvToOverrideSymbol ? tvToSymbol : syminfo.ticker)) + " t=buy")
    isLongCondition := false
    bullCandleCount := 0
    longLine := na

if isShortCondition and (bullCandleCount >= maxPullbackCandles)[1]
    if useReverse
        strategy.cancel("long")
        alert("Cancel " + str.tostring((tvToOverrideSymbol ? tvToSymbol : syminfo.ticker)) + " t=buy")
    if not useReverse
        strategy.cancel("short")
        alert("Cancel " + str.tostring((tvToOverrideSymbol ? tvToSymbol : syminfo.ticker)) + " t=sell")
    isShortCondition := false
    bearCandleCount := 0
    shortLine := na
    
// ---- Save for graphical display that there is a longcondition + reset other variables
if high>longLine
    longSignal := true
    longLine := na
    isLongCondition := false

if low<shortLine
    shortSignal := true
    shortLine := na
    isShortCondition := false
// ---- Get Stop loss and Take Profit in there
if useReverse
    if useTPSL
        if strategy.position_size < 0 and strategy.position_size[1] >= 0
            strategy.exit("short exit", "short", limit=longLine[1]-stopMultiplier*atrAveraged, stop=longLine[1]+stopMultiplier*atrAveraged)
        if strategy.position_size > 0 and strategy.position_size[1] <= 0
            strategy.exit("long exit", "long", limit=shortLine[1]+stopMultiplier*atrAveraged, stop=shortLine[1]-stopMultiplier*atrAveraged)
if not useReverse
    if useTPSL
        if strategy.position_size > 0 and strategy.position_size[1] <= 0
            strategy.exit("long exit", "long", limit=longLine[1]+stopMultiplier*atrAveraged, stop=longLine[1]-stopMultiplier*atrAveraged)
        if strategy.position_size < 0 and strategy.position_size[1] >=0
            strategy.exit("short exit", "short", limit=shortLine[1]-stopMultiplier*atrAveraged, stop=shortLine[1]+stopMultiplier*atrAveraged)
// ----- Logic for closing positions on a big candle in either direction
if (strategy.position_size[1]>0 or strategy.position_size[1]<0) and useBigCandleExit
    if close>equilibriumTop or close<equilibriumBottom
        strategy.close_all("Big Candle Stop")
        alert("close " + str.tostring((tvToOverrideSymbol ? tvToSymbol : syminfo.ticker)))

// ================================== //
// ------> Graphical Display <------- //
// ================================== //

// Deviation from equilibrium using smoothed ATR and percentile nearest rank to rank the coloring of the candles
candle_c2 = close>equilibrium ? close>open ? candle_bull_c1 : candle_bull_c2 : close<open ? candle_bear_c1 : candle_bear_c2
// 
plotcandle(equilibrium, high, low, close, title="Equilibrium Candles", color=candle_c2, wickcolor=candle_c2, bordercolor=candle_c2)
plotshape(highlightClosePrices ? close : na, title="Closing Bubble", style=shape.circle, location=location.absolute, color=color.yellow)
bgcolor(useBgColoring ? (isBullTrend ? trend_bull_c : isBearTrend ? trend_bear_c : isLongCondition ? long_zone_c : isShortCondition ? short_zone_c : na) : na, force_overlay=true)
plot(longLine, color=candle_bull_c1, title="Long Line", style=plot.style_linebr, linewidth=4)
plot(shortLine, color=candle_bear_c1, title="Short Line", style=plot.style_linebr, linewidth=4)
plotshape(longSignal ? math.min(equilibrium, low)+(-0.5*atrAveraged) : na, title="Long Signal", color=candle_bull_c1, style=shape.diamond, size=size.tiny, location=location.absolute)
plotshape(shortSignal ? math.max(equilibrium, high)+(0.5*atrAveraged) : na, title="Short Signal", color=candle_bear_c1, style=shape.diamond, size=size.tiny, location=location.absolute)

// =================================== //
// ------> Simple Form Alerts <------- //
// =================================== //

alertcondition(longSignal, "Simple Long Signal")
alertcondition(shortSignal, "Simple Short Signal")