حکمت عملی ڈرائنگ ڈیزائن آسان بنانے کے لئے KLineChart تقریب کا استعمال کریں
مصنف:چھوٹا سا خواب, تخلیق: 2022-07-05 15:13:55, تازہ کاری: 2023-09-25 19:49:32
حکمت عملی ڈرائنگ ڈیزائن آسان بنانے کے لئے KLineChart تقریب کا استعمال کریں
حکمت عملی ڈیزائن کرتے وقت ، ظاہر کرنے کے لئے حکمت عملی کا چارٹ ڈیزائن کرنا اکثر ضروری ہوتا ہے ، جب جاوا اسکرپٹ زبان ، پائیون زبان میں حکمت عملی لکھتے ہیں تو ، پروگرامنگ یا ایف ایم زیڈ پلیٹ فارم میں استعمال ہونے والی چارٹنگ لائبریری سے ناواقف صارفین اکثر کسٹم چارٹس پر ڈرائنگ کے لئے کوڈ ڈیزائن کے ساتھ جدوجہد کرتے ہیں۔ تو آپ صرف ایک چھوٹی سی مقدار میں کوڈ کے ذریعہ بھرپور مواد کے ساتھ حکمت عملی کا چارٹ کیسے تیار کرسکتے ہیں؟
ڈرائنگ کا یہ سادہ اور طاقتور طریقہ پائن زبان میں دیکھا جاسکتا ہے ، جو اپنے بھرپور ڈرائنگ افعال کے لئے جانا جاتا ہے۔ اگر پائن زبان کا ڈرائنگ انٹرفیس جاوا اسکرپٹ اور پائتھون زبانوں کی حکمت عملیوں سے منسلک کیا جاسکتا ہے تو ، اس سے ڈویلپر کی ڈیزائن حکمت عملی کے ڈرائنگ فنکشن کو بہت سہولت ملے گی۔ لہذا ، اس مانگ کی بنیاد پر ، ایف ایم زیڈ پلیٹ فارم نے اپنی مرضی کے مطابق ڈرائنگ فنکشن کو اپ گریڈ کیا ہے اور اس کا استعمال کرنے کا طریقہ بڑھا دیا ہے۔KLineChartاپنی مرضی کے مطابق چارٹ تیار کرنے کے لئے فنکشن۔ آپ API دستاویزات کا حوالہ دے سکتے ہیں:https://www.fmz.com/api#klinechart
چلو ایک سادہ مثال لکھ کر شروع کرتے ہیں جاوا اسکرپٹ زبان کا استعمال کرتے ہوئے منتقلی کے لئے.
سادہ مثال
/*backtest
start: 2022-03-21 09:00:00
end: 2022-06-21 15:00:00
period: 30m
basePeriod: 15m
exchanges: [{"eid":"Binance","currency":"BTC_USDT"}]
*/

function main() {
    var c = KLineChart()
    while (true) {
        var bars = _C(exchange.GetRecords)
        for (var i = 0 ; i < bars.length ; i++) {
            var bar = bars[i]
            c.begin(bar)
            c.plot(bar.Volume, "Close")
            c.close()
        }
        Sleep(1000)
    }
}
یہ مثال بہت سادہ ہے، صرف حکمت عملی کے اپنی مرضی کے مطابق ڈرائنگ کے علاقے میں ایک K لائن چارٹ ڈرائنگ، اور چارٹ کے ذیلی چارٹ کی پوزیشن میں ہر K لائن BAR کے مطابق ایک حجم وکر ڈرائنگ.
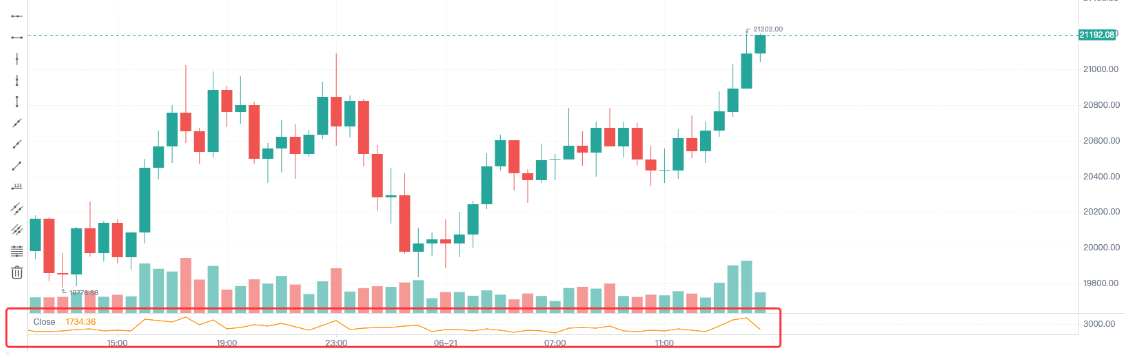
کوڈ میں، ہم استعمالvar c = KLineChart()اس کے بعد ہم ایک چارٹ ڈرائنگ کرنے کے لئے اس کا طریقہ استعمال کرتے ہیں۔ پھر لوپ میں ، ہم K لائن ڈیٹا (آرری ڈھانچہ) حاصل کرتے ہیں ، اور K لائن صف کو عبور کرتے ہیں۔ اسے مثال کے طور پر ایک سادہ کے لوپ کا استعمال کرکے عبور کیا جاسکتا ہے ، یا اسے دوسرے طریقوں سے عبور کیا جاسکتا ہے۔
ڈرائنگ آپریشن کے ساتھ شروعc.begin(bar)تقریب اور کے ساتھ ختمc.close()فنکشن.beginاورcloseافعال چارٹ آبجیکٹ کے تمام طریقے ہیں c. اگلا، سب سے زیادہ عام طور پر استعمال کیا ڈرائنگ تقریب کا استعمال کریںplotہر BAR پر حجم وکر ڈرائنگ کے لئے.
ایک زیادہ پیچیدہ مثال
فرض کریں کہ ہم بولنگر اشارے کے ساتھ ایک چارٹ ڈیزائن کرنا چاہتے ہیں۔ اور یہ ہر بار کے حجم چارٹ کے ساتھ بھی آتا ہے ، جسے اس طرح ڈیزائن کیا جاسکتا ہے۔
/*backtest
start: 2022-03-21 09:00:00
end: 2022-06-21 15:00:00
period: 1d
basePeriod: 1h
exchanges: [{"eid":"Binance","currency":"BTC_USDT"}]
*/

function main() {
    var c = KLineChart()

    // main strategy loop
    while(true) {
        // polling interval
        Sleep(500)

        // get K-line data
        let bars = exchange.GetRecords()
        if (!bars || bars.length <= 20) {
            continue
        }

        // calculate the Bollinger indicator
        var boll = TA.BOLL(bars)

        bars.forEach(function(bar, index) {
            c.begin(bar)
            // drawing operation
            c.plot(boll[0][index], "Boll_Up", {overlay: true})     // Draw on the main chart
            c.plot(boll[1][index], "Boll_Mid", {overlay: true})    // Draw on the main chart
            c.plot(boll[2][index], "Boll_Down", {overlay: true})   // Draw on the main chart
            c.plot(bar.Volume, "volume")                           // Draw on the sub-chart
            c.close()
        })

        // Strategy trading logic
        // ...
        // ..
    }
}
جیسا کہ ہم کوڈ میں دیکھ سکتے ہیں، FMZ پلیٹ فارم پر ہمارے بیک ٹیسٹ کی ترتیب کی معلومات ہے:
/*backtest
start: 2022-03-21 09:00:00
end: 2022-06-21 15:00:00
period: 1d
basePeriod: 1h
exchanges: [{"eid":"Binance","currency":"BTC_USDT"}]
*/
اس طرح کی تشکیل بائننس اسپاٹ ایکسچینج آبجیکٹ بیک ٹیسٹنگ ٹیسٹ کا استعمال کرنا ہے۔ بیک ٹیسٹنگ اثر مندرجہ ذیل دکھایا گیا ہے:
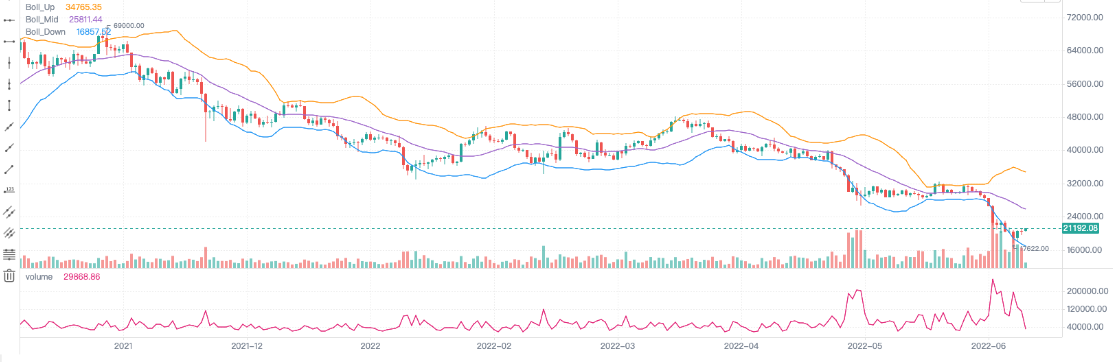
یہ دیکھا جا سکتا ہے کہ ہم پائن ڈرائنگ کا طریقہ استعمال کرتے ہیں، جو جاوا اسکرپٹ زبان میں ڈرائنگ کوڈ کو بہت آسان بناتا ہے.
چارٹ بنانے کے لئے اشارے اور دیگر اعداد و شمار میں لکھیں
K لائن ڈیٹا حاصل کرنے اور اشارے کا حساب لگانے کے عمل پلیٹ فارم اسٹریٹیجی اسکوائر میں حکمت عملی کی مثالوں اور API دستاویزات میں عام اور آسان ہیں۔
        // obtain K-line data
        let bars = exchange.GetRecords()
        if (!bars || bars.length <= 20) {
            // If the acquisition of the K line fails, that is, if !bar is true, execute continue, ignore the following code, and re-execute the loop
            // If bars.length is less than or equal to 20, that is, the number of K-line BAR (bar) is less than 20, the indicator cannot be calculated, and continue is also executed
            continue
        }

        // Calculate the Bollinger indicator
        var boll = TA.BOLL(bars)
بولنگر اشارے کے حساب کی تقریب TA.BOLL، اگر بولنگر اشارے کے پیرامیٹرز مخصوص نہیں ہیں، تو ڈیفالٹ پیرامیٹرزBOLL(20, 2)بولنگر اشارے میں تین لائنیں ہیں ، لہذا TA.BOLL فنکشن کے ذریعہ لوٹائے جانے والے اعداد و شمار دو جہتی صف ہیں۔ بول [0] ، بول [1] ، اور بول [2] بول صف کے تین عناصر ہیں ، جن میں سے ہر ایک ایک لائن کی نمائندگی کرتا ہے اور صف ہے۔
- boll[0]: بولنگر بینڈ لائن اپ
- بول[1]: بولنگر بینڈس مڈ لائن
- boll[2]: بولنگر بینڈ نیچے لائن
پھر ہم دیکھیں گے کہ کس طرح K لائن کے اعداد و شمار کا حجم، یعنی حجم، اور چارٹ پر حساب سے Bollinger اشارے کے اعداد و شمار کو تیار کرنے کے لئے.
ہم K لائن ڈیٹا بار کی طرف سے بار ڈرائنگ، تو ہم پورے K لائن صف کو پار کرنے کی ضرورت ہے، یہ ہے کہ، کوڈ میں سلاخوں صف کو پار.forEachطریقہ کار یہاں گزرنے کے لئے استعمال کیا جاتا ہے، یا لوپ کے لئے گزرنے کے لئے استعمال کیا جا سکتا ہے.
        bars.forEach(function(bar, index) {
            c.begin(bar)
            // Drawing operations
            c.plot(boll[0][index], "Boll_Up", {overlay: true})     // {overlay: true} Parameter control, drawn on the main chart
            c.plot(boll[1][index], "Boll_Mid", {overlay: true})    // Draw on the main chart
            c.plot(boll[2][index], "Boll_Down", {overlay: true})   // Draw on the main chart
            c.plot(bar.Volume, "volume")                           // Draw on the sub-chart
            c.close()
        })
یہ نوٹ کیا جانا چاہئے کہ جب بھی آپ کو ایک بار پر ایک چارٹ ڈرائنگ آپریشن شروع، آپ کو ایکc.begin(bar)فنکشن کال پہلے.beginفنکشن ہمارے چارٹ آبجیکٹ سی طریقہ کار میں سے ایک ہے. ڈرائنگ آپریشن کے آخر میں،c.close()فون کرنے کی ضرورت ہے.beginفنکشن اورcloseفنکشن ڈرائنگ فنکشن ہے جسے ہم پین زبان کے ڈرائنگ کے طریقہ کار کی طرح کہتے ہیں۔barcolor bgcolor plot fill hline plotarrow plotshape plotchar plotcandle signal، آپ لائنوں، تیر، نشان معلومات، وغیرہ ڈرا سکتے ہیں ان افعال کے پیرامیٹرز پائین زبان کے مساوی افعال پیرامیٹرز کے طور پر ایک ہی ہیں، اور ڈرائنگ افعال بھی ایک ہی ہیں.
ٹریڈنگ سگنل تیر، مارکر، افقی لائنوں، وغیرہ کی ڈرائنگ شامل کریں.
مندرجہ بالا بولنگر بینڈ چارٹنگ مثال میں کچھ ٹریڈنگ سگنل تیر، مارکر، افقی لائنیں شامل کریں.
/*backtest
start: 2022-03-21 09:00:00
end: 2022-06-21 15:00:00
period: 1d
basePeriod: 1h
exchanges: [{"eid":"Binance","currency":"BTC_USDT"}]
*/

function main() {
    var c = KLineChart({overlay : true})

    // Strategy main loop
    while(true) {
        // Polling interval
        Sleep(500)

        // Obtain K-line data
        let bars = exchange.GetRecords()
        if (!bars || bars.length <= 20) {
            continue
        }

        // Calculate Bollinger indicator
        var boll = TA.BOLL(bars)

        bars.forEach(function(bar, index) {
            c.begin(bar)
            // Drawing operations
            c.plot(boll[0][index], "Boll_Up", {overlay: true})     // Draw on the main chart
            c.plot(boll[1][index], "Boll_Mid", {overlay: true})    // Draw on the main chart
            c.plot(boll[2][index], "Boll_Down", {overlay: true})   // Draw on the main chart
            c.plot(bar.Volume, "volume", {overlay: false})         // Draw on the sub-chart

            c.hline(bar.Open, {overlay: true})                          // Horizontal line
            c.plotarrow(bar.Close - bar.Open, {overlay: true})          // Arrow
            c.plotshape(bar.Close - bar.Open > 0, {style: 'square'})    // Draw square markers
            c.plotchar(bar.Close - bar.Open < 0, {char: 'X'})           // Draw the character X

            c.close()
        })

        // Strategy trading logic
        // ...
        // ..
    }
}

چارٹ ترتیب کا اعتراض
چارٹ اسٹائل کو تشکیل دینے کے لئے ایک ڈھانچہ اعلان کیا جاسکتا ہے۔ مثال کے طور پر ، مندرجہ ذیل چارٹCfg متغیر ایک گرڈ لائن کی تشکیل کی معلومات کی نمائندگی کرتا ہے۔
    var chartCfg = {
        grid: {
            show: true,
            // Grid horizontal line
            horizontal: {
                show: true,
                size: 2,
                color: '#FF0000',    // Color of horizontal grid line
                // 'solid'|'dash'
                style: 'dash',       // Type of line
                dashValue: [2, 2]
            },
   	        // Grid vertical line
            vertical: {
                show: true,
                size: 2,
                color: '#32CD32',
                // 'solid'|'dash'
                style: 'solid',
                dashValue: [2, 2]
            }
        },
    }
چارٹ کی تشکیل کا آبجیکٹ وہ ڈیٹا ڈھانچہ ہے جو چارٹ کی کچھ خصوصیات اور ظاہری شکل طے کرتا ہے۔ مثال کے طور پر ، مثال میں گرڈ لائن اسٹائل کی تشکیل کا استعمال کیا جاتا ہے۔ بہت سارے اختیارات بھی ہیں جن کی تشکیل اور ترمیم کی جاسکتی ہے ، جیسے ایکس محور ، وائی محور سے متعلق ترتیبات ، کرسر لائن کی ترتیبات ، الرٹ میسج کی ترتیبات ، تکنیکی اشارے کی طرز کی ترتیبات ، کے لائن بار اسٹائل کی ترتیبات وغیرہ۔
یقینا، اگر آپ ان سے واقف نہیں ہیں، آپ کو چارٹ ترتیب اعتراض میں منتقل نہیں کر سکتے ہیں جب کالKLineChartایک چارٹ آبجیکٹ تخلیق کرنے کے لئے تقریب. پھر تخلیق چارٹ ڈیفالٹ سٹائل ہے. API تقریب کا استعمال کریںKLineChartچارٹ آبجیکٹ بنانے کے لئے FMZ پلیٹ فارم کا فنکشن:
var c = KLineChart(chartCfg)
گرڈ لائنوں کی ڈرائنگ کے لئے ٹیسٹ کوڈ:
/*backtest
start: 2022-03-21 09:00:00
end: 2022-06-21 15:00:00
period: 1d
basePeriod: 1h
exchanges: [{"eid":"Binance","currency":"BTC_USDT"}]
*/

function main() {
    var chartCfg = {
        grid: {
            show: true,
            // Grid horizontal line
            horizontal: {
                show: true,
                size: 2,
                color: '#FF0000',
                // 'solid'|'dash'
                style: 'dash',
                dashValue: [2, 2]
            },
   	        // Grid vertical line
            vertical: {
                show: true,
                size: 2,
                color: '#32CD32',
                // 'solid'|'dash'
                style: 'solid',
                dashValue: [2, 2]
            }
        },
    }

    var c = KLineChart(chartCfg)

    // Strategy main loop
    while(true) {
        // Polling interval
        Sleep(500)

        // Obtain K-line data
        var bars = _C(exchange.GetRecords)
        bars.forEach(function(bar, index) {
            c.begin(bar)
            c.close()
        })

        // Strategy trading logic
        // ...
        // ..
    }
}
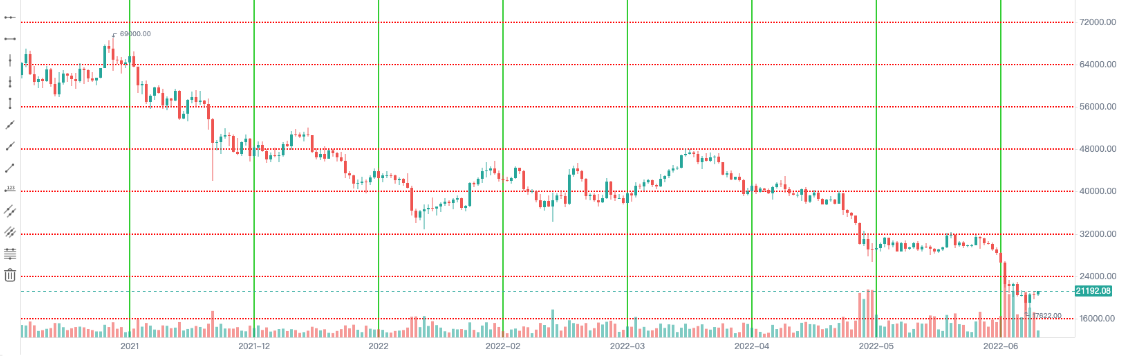
چارٹ ترتیب سٹائل کی مثال
یہ چارٹ ترتیب سٹائل کی ترتیبات کا حوالہ دینے کے لئے استعمال کیا جا سکتا ہے.
{
// Gridlines
grid: {
show: true,
// Grid horizontal line
horizontal: {
show: true,
size: 1,
color: '#393939',
// 'solid'|'dash'
style: 'dash',
dashValue: [2, 2]
},
// Grid vertical line
vertical: {
show: false,
size: 1,
color: '#393939',
// 'solid'|'dash'
style: 'dash',
dashValue: [2, 2]
}
},
// Candlestick chart
candle: {
// The distance between the top and bottom of the candlestick chart, greater than 1 is the absolute value, greater than 0, and 1 is the proportion
margin: {
top: 0.2,
bottom: 0.1
},
// Type of Candlestick Charts 'candle_solid'|'candle_stroke'|'candle_up_stroke'|'candle_down_stroke'|'ohlc'|'area'
type: 'candle_solid',
// Candle pillar
bar: {
upColor: '#26A69A',
downColor: '#EF5350',
noChangeColor: '#888888'
},
// Area map
area: {
lineSize: 2,
lineColor: '#2196F3',
value: 'close',
backgroundColor: [{
offset: 0,
color: 'rgba(33, 150, 243, 0.01)'
}, {
offset: 1,
color: 'rgba(33, 150, 243, 0.2)'
}]
},
priceMark: {
show: true,
// Highest price marker
high: {
show: true,
color: '#D9D9D9',
textMargin: 5,
textSize: 10,
textFamily: 'Helvetica Neue',
textWeight: 'normal'
},
// Lowest price marker
low: {
show: true,
color: '#D9D9D9',
textMargin: 5,
textSize: 10,
textFamily: 'Helvetica Neue',
textWeight: 'normal',
},
// Latest price marker
last: {
show: true,
upColor: '#26A69A',
downColor: '#EF5350',
noChangeColor: '#888888',
line: {
show: true,
// 'solid'|'dash'
style: 'dash',
dashValue: [4, 4],
size: 1
},
text: {
show: true,
size: 12,
paddingLeft: 2,
paddingTop: 2,
paddingRight: 2,
paddingBottom: 2,
color: '#FFFFFF',
family: 'Helvetica Neue',
weight: 'normal',
borderRadius: 2
}
}
},
// Tips
tooltip: {
// 'always' | 'follow_cross' | 'none'
showRule: 'always',
// 'standard' | 'rect'
showType: 'standard',
labels: ['time', 'open', 'close', 'high', 'low', 'volume'],
values: null,
defaultValue: 'n/a',
rect: {
paddingLeft: 0,
paddingRight: 0,
paddingTop: 0,
paddingBottom: 6,
offsetLeft: 8,
offsetTop: 8,
offsetRight: 8,
borderRadius: 4,
borderSize: 1,
borderColor: '#3f4254',
backgroundColor: 'rgba(17, 17, 17, .3)'
},
text: {
size: 12,
family: 'Helvetica Neue',
weight: 'normal',
color: '#D9D9D9',
marginLeft: 8,
marginTop: 6,
marginRight: 8,
marginBottom: 0
}
}
},
// Technical indicators
technicalIndicator: {
margin: {
top: 0.2,
bottom: 0.1
},
bar: {
upColor: '#26A69A',
downColor: '#EF5350',
noChangeColor: '#888888'
},
line: {
size: 1,
colors: ['#FF9600', '#9D65C9', '#2196F3', '#E11D74', '#01C5C4']
},
circle: {
upColor: '#26A69A',
downColor: '#EF5350',
noChangeColor: '#888888'
},
// Latest value marker
lastValueMark: {
show: false,
text: {
show: false,
color: '#ffffff',
size: 12,
family: 'Helvetica Neue',
weight: 'normal',
paddingLeft: 3,
paddingTop: 2,
paddingRight: 3,
paddingBottom: 2,
borderRadius: 2
}
},
// Tips
tooltip: {
// 'always' | 'follow_cross' | 'none'
showRule: 'always',
// 'standard' | 'rect'
showType: 'standard',
showName: true,
showParams: true,
defaultValue: 'n/a',
text: {
size: 12,
family: 'Helvetica Neue',
weight: 'normal',
color: '#D9D9D9',
marginTop: 6,
marginRight: 8,
marginBottom: 0,
marginLeft: 8
}
}
},
// x-axis
xAxis: {
show: true,
height: null,
// x-axis line
axisLine: {
show: true,
color: '#888888',
size: 1
},
// x-axis split text
tickText: {
show: true,
color: '#D9D9D9',
family: 'Helvetica Neue',
weight: 'normal',
size: 12,
paddingTop: 3,
paddingBottom: 6
},
// x-axis split line
tickLine: {
show: true,
size: 1,
length: 3,
color: '#888888'
}
},
// y-axis
yAxis: {
show: true,
width: null,
// 'left' | 'right'
position: 'right',
// 'normal' | 'percentage' | 'log'
type: 'normal',
inside: false,
reverse: false,
// y-axis line
axisLine: {
show: true,
color: '#888888',
size: 1
},
// y-axis split text
tickText: {
show: true,
color: '#D9D9D9',
family: 'Helvetica Neue',
weight: 'normal',
size: 12,
paddingLeft: 3,
paddingRight: 6
},
// y-axis split line
tickLine: {
show: true,
size: 1,
length: 3,
color: '#888888'
}
},
// Split line between charts
separator: {
size: 1,
color: '#888888',
fill: true,
activeBackgroundColor: 'rgba(230, 230, 230, .15)'
},
// Crosshair
crosshair: {
show: true,
// Horizontal line and text of crosshair
horizontal: {
show: true,
line: {
show: true,
// 'solid'|'dash'
style: 'dash',
dashValue: [4, 2],
size: 1,
color: '#888888'
},
text: {
show: true,
color: '#D9D9D9',
size: 12,
family: 'Helvetica Neue',
weight: 'normal',
paddingLeft: 2,
paddingRight: 2,
paddingTop: 2,
paddingBottom: 2,
borderSize: 1,
borderColor: '#505050',
borderRadius: 2,
backgroundColor: '#505050'
}
},
// Vertical line and text of crosshair
vertical: {
show: true,
line: {
show: true,
// 'solid'|'dash'
style: 'dash',
dashValue: [4, 2],
size: 1,
color: '#888888'
},
text: {
show: true,
color: '#D9D9D9',
size: 12,
family: 'Helvetica Neue',
weight: 'normal',
paddingLeft: 2,
paddingRight: 2,
paddingTop: 2,
paddingBottom: 2,
borderSize: 1,
borderColor: '#505050',
borderRadius: 2,
backgroundColor: '#505050'
}
}
},
// Graph
shape: {
point: {
backgroundColor: '#2196F3',
borderColor: '#2196F3',
borderSize: 1,
radius: 4,
activeBackgroundColor: '#2196F3',
activeBorderColor: '#2196F3',
activeBorderSize: 1,
activeRadius: 6
},
line: {
// 'solid'|'dash'
style: 'solid'
color: '#2196F3',
size: 1,
dashValue: [2, 2]
},
polygon: {
// 'stroke'|'fill'
style: 'stroke',
stroke: {
// 'solid'|'dash'
style: 'solid',
size: 1,
color: '#2196F3',
dashValue: [2, 2]
},
fill: {
color: 'rgba(33, 150, 243, 0.1)'
}
},
arc: {
// 'stroke'|'fill'
style: 'stroke',
stroke: {
// 'solid'|'dash'
style: 'solid',
size: 1,
color: '#2196F3',
dashValue: [2, 2]
},
fill: {
color: '#2196F3'
}
},
text: {
style: 'fill',
color: '#2196F3',
size: 12,
family: 'Helvetica Neue',
weight: 'normal',
offset: [0, 0]
}
},
annotation: {
// 'top' | 'bottom' | 'point'
position: 'top',
offset: [20, 0]
symbol: {
// 'diamond' | 'circle' | 'rect' | 'triangle' | 'custom' | 'none'
type: 'diamond',
size: 8,
color: '#2196F3',
activeSize: 10,
activeColor: '#FF9600'
}
},
tag: {
// 'top' | 'bottom' | 'point'
position: 'point',
offset: 0,
line: {
show: true,
style: LineStyle.DASH,
dashValue: [4, 2],
size: 1,
color: '#2196F3'
},
text: {
color: '#FFFFFF',
backgroundColor: '#2196F3',
size: 12,
family: 'Helvetica Neue',
weight: 'normal',
paddingLeft: 2,
paddingRight: 2,
paddingTop: 2,
paddingBottom: 2,
borderRadius: 2,
borderSize: 1,
borderColor: '#2196F3'
},
mark: {
offset: 0,
color: '#FFFFFF',
backgroundColor: '#2196F3',
size: 12,
family: 'Helvetica Neue',
weight: 'normal',
paddingLeft: 2,
paddingRight: 2,
paddingTop: 2,
paddingBottom: 2,
borderRadius: 2,
borderSize: 1,
borderColor: '#2196F3'
}
}
}
کیا اس سے حکمت عملی ڈرائنگ ڈیزائن آسان نہیں ہوتا؟
- کریپٹوکرنسی مارکیٹ میں بنیادی تجزیہ کی مقدار: اعداد و شمار کو اپنے لئے بولنے دیں!
- ایک بار پھر ، ہم نے ایک بار پھر اس بات کا یقین کرلیا ہے کہ یہ ایک بہت بڑا مسئلہ ہے ، لیکن ہم اس کے بارے میں مزید نہیں جانتے ہیں۔
- کوانٹائزڈ ٹرانزیکشنز کے لیے ایک لازمی ٹول۔
- ہر چیز پر قابو پانا - ایف ایم زیڈ ٹریڈنگ ٹرمینل کا نیا ورژن (ٹی آر بی آربیٹریج سورس کوڈ کے ساتھ) کا تعارف
- FMZ کے نئے ورژن کے ٹرانزیکشن ٹرمینل کے بارے میں سب کچھ جاننے کے لئے یہاں کلک کریں
- ایف ایم زیڈ کوانٹ: کریپٹوکرنسی مارکیٹ میں مشترکہ تقاضوں کے ڈیزائن مثالوں کا تجزیہ (II)
- 80 لائنوں کے کوڈ میں ہائی فریکوئینسی حکمت عملی کے ساتھ دماغ کے بغیر سیلز بوٹس کا استحصال کیسے کریں
- ایف ایم زیڈ کیوٹیفیکیشن: کریپٹوکرنسی مارکیٹ میں عام ضروریات کے ڈیزائن کی مثالوں کا تجزیہ (ب)
- 80 لائنوں کے کوڈ کے ساتھ ہائی فریکوئینسی کی حکمت عملی کے ساتھ فروخت کے لیے بے دماغ روبوٹ کا استحصال کیسے کیا گیا؟
- ایف ایم زیڈ کوانٹ: کریپٹوکرنسی مارکیٹ میں مشترکہ تقاضوں کے ڈیزائن مثالوں کا تجزیہ (I)
- ایف ایم زیڈ کیوٹیفیکیشن: کریپٹوکرنسی مارکیٹ میں عام ضروریات کے ڈیزائن کی مثالوں کا تجزیہ (1)