ڈیجیٹل کرنسی فیوچر کثیر اقسام کی اے ٹی آر حکمت عملی (ٹیوٹوریل)
مصنف:لیدیہ, تخلیق: 2022-11-08 10:34:22, تازہ کاری: 2023-09-15 20:55:33
حال ہی میں ، ہمارے کچھ پلیٹ فارم صارفین مائی لینگویج حکمت عملی کو جاوا اسکرپٹ کی حکمت عملی میں پیوند کاری کرنے کے منتظر ہیں ، جو لچکدار طریقے سے بہت سارے اصلاحاتی نظریات کو شامل کرسکتا ہے۔ یہاں تک کہ حکمت عملی کو کثیر اقسام کے ورژن میں بھی بڑھا سکتا ہے۔ کیونکہ مائی لینگویج حکمت عملی عام طور پر ایک رجحان حکمت عملی ہے ، اور ان میں سے بہت سے اختتامی قیمت کے ماڈل کی بنیاد پر عملدرآمد ہوتے ہیں۔ حکمت عملی کی درخواست کے تبادلے کا API انٹرفیس بہت کثرت سے نہیں ہوتا ہے ، جو کثیر اقسام کی حکمت عملی کے ورژن میں پیوند کاری کے لئے موزوں ہے۔ اس مضمون میں ، ہم اسے جاوا اسکرپٹ کی زبان کے ایک آسان ورژن میں پیوند کاری کے لئے ایک سادہ مائی لینگویج حکمت عملی کو مثال کے طور پر لیں گے۔ بنیادی مقصد تعلیم اور معاونت کی تحقیق ہے۔ اگر آپ حقیقی بوٹ بنانا چاہتے ہیں تو ، آپ کو کچھ تفصیلات (آرڈر کی قیمت ، مقدار کی درستگی ، آرڈر کی مقدار کا کنٹرول ، اثاثہ کے لحاظ سے آرڈر ، حیثیت کی معلومات ظاہر کرنا ، وغیرہ)
MyLanguage کی حکمت عملی کو منتقل کیا جائے گا
TR:=MAX(MAX((H-L),ABS(REF(C,1)-H)),ABS(REF(C,1)-L));
ATR:=EMA(TR,LENGTH2);

MIDLINE^^EMA((H + L + C)/3,LENGTH1);
UPBAND^^MIDLINE + N*ATR;
DOWNBAND^^MIDLINE - N*ATR;


BKVOL=0 AND C>=UPBAND AND REF(C,1)<REF(UPBAND,1),BPK;
SKVOL=0 AND C<=DOWNBAND AND REF(C,1)>REF(DOWNBAND,1),SPK;

BKVOL>0 AND C<=MIDLINE,SP(BKVOL);
SKVOL>0 AND C>=MIDLINE,BP(SKVOL);
// stop loss
// stop loss
C>=SKPRICE*(1+SLOSS*0.01),BP;
C<=BKPRICE*(1-SLOSS*0.01),SP;
AUTOFILTER;
اس حکمت عملی کا تجارتی منطق آسان ہے۔ پہلے ، پیرامیٹرز کے مطابق اے ٹی آر کا حساب لگائیں ، پھر تمام کے لائن بارز کی اعلی ترین ، کم ترین اور اختتامی قیمتوں کا اوسط حساب لگائیں ، اور پھر اوسط اعداد و شمار کے مطابق ای ایم اے اشارے کا حساب لگائیں۔ آخر میں ، اپ بینڈ اور ڈاؤن بینڈ کا حساب لگانے کے لئے پیرامیٹرز میں اے ٹی آر اور کوفیسیٹر این کو جوڑیں۔
افتتاحی اور فروخت کی پوزیشنیں اختتامی قیمت پر مبنی ہیں۔ جب یہ اپ بینڈ کو عبور کرتا ہے تو طویل پوزیشنیں کھولیں اور افتتاحی پوزیشن فروخت کریں۔ جب یہ ڈاؤن بینڈ کو عبور کرتا ہے تو مختصر پوزیشنیں کھولیں اور افتتاحی پوزیشن فروخت کریں۔ جب اختتامی قیمت درمیانی لائن تک پہنچ جاتی ہے تو پوزیشن بند ہو جائے گی، اور جب اختتامی قیمت سٹاپ نقصان کی قیمت تک پہنچ جاتی ہے تو پوزیشن بھی بند ہو جائے گی (SLOSS کے مطابق سٹاپ نقصان 1 ہے، یعنی 0.01، یعنی 1٪) ۔ یہ حکمت عملی بندش کی قیمت کے ماڈل میں عمل میں لائی جاتی ہے۔
ٹھیک ہے، اگر ہم MyLanguage کی اسٹریٹجک ضروریات اور خیالات کو سمجھتے ہیں، تو ہم ان کو منتقل کرنا شروع کر سکتے ہیں.
ٹرانسپلانٹ اور ڈیزائن کی حکمت عملی پروٹوٹائپ
حکمت عملی کے پروٹوٹائپ کوڈز بہت کم ہیں ، جو 1 سے 200 لائنوں تک ہیں۔ حکمت عملی لکھنے کے خیالات کو سیکھنے میں آسانی کے ل comments ، تبصرے براہ راست حکمت عملی کے کوڈ میں لکھے جاتے ہیں۔
// parse params parameters, and parse strings as objects
var arrParam = JSON.parse(params)

// this function creates a chart configuration
function createChartConfig(symbol, atrPeriod, emaPeriod, index) {   // symbol : trading pair, atrPeriod : ATR parameter period , emaPeriod : EMA parameter period, exchange object index corresponding to index
    var chart = {
        __isStock: true,
        extension: {
                layout: 'single',
                height: 600,
        },
        title : { text : symbol},
        xAxis: { type: 'datetime'},
        series : [
            {
                type: 'candlestick',    // K-line data series
                name: symbol,
                id: symbol + "-" + index,
                data: []
            }, {
                type: 'line',           // EMA
                name: symbol + ',EMA:' + emaPeriod,
                data: [],
            }, {
                type: 'line',           // upBand
                name: symbol + ',upBand' + atrPeriod,
                data: []
            }, {
                type: 'line',           // downBand
                name: symbol + ',downBand' + atrPeriod,
                data: []
            }, {
                type: 'flags',
                onSeries: symbol + "-" + index,
                data: [],
            }
        ]
    }
    return chart
}

// main Logic
function process(e, kIndex, c) {    // e is the exchange object, exchanges [0]..., kIndex is the K-line data series in the chart, and c is the chart object
    // obtain K-line data
    var r = e.GetRecords(e.param.period)
    if (!r || r.length < e.param.atrPeriod + 2 || r.length < e.param.emaPeriod + 2) {
        // if the K-line data length is insufficient, return
        return
    }

    // calculate ATR indicators
    var atr = TA.ATR(r, e.param.atrPeriod)
    var arrAvgPrice = []
    _.each(r, function(bar) {
        arrAvgPrice.push((bar.High + bar.Low + bar.Close) / 3)
    })
    // calculate EMA indicators
    var midLine = TA.EMA(arrAvgPrice, e.param.emaPeriod)
    // calculate upBand and downBand
    var upBand = []
    var downBand = []
    _.each(midLine, function(mid, index) {
        if (index < e.param.emaPeriod - 1 || index < e.param.atrPeriod - 1) {
            upBand.push(NaN)
            downBand.push(NaN)
            return
        }
        upBand.push(mid + e.param.trackRatio * atr[index])
        downBand.push(mid - e.param.trackRatio * atr[index])
    })

    // draw the chart
    for (var i = 0 ; i < r.length ; i++) {
        if (r[i].Time == e.state.lastBarTime) {
            // update
            c.add(kIndex, [r[i].Time, r[i].Open, r[i].High, r[i].Low, r[i].Close], -1)
            c.add(kIndex + 1, [r[i].Time, midLine[i]], -1)
            c.add(kIndex + 2, [r[i].Time, upBand[i]], -1)
            c.add(kIndex + 3, [r[i].Time, downBand[i]], -1)
        } else if (r[i].Time > e.state.lastBarTime) {
            // add
            e.state.lastBarTime = r[i].Time
            c.add(kIndex, [r[i].Time, r[i].Open, r[i].High, r[i].Low, r[i].Close])
            c.add(kIndex + 1, [r[i].Time, midLine[i]])
            c.add(kIndex + 2, [r[i].Time, upBand[i]])
            c.add(kIndex + 3, [r[i].Time, downBand[i]])
        }
    }

    // check the position
    var pos = e.GetPosition()
    if (!pos) {
        return
    }
    var holdAmount = 0
    var holdPrice = 0
    if (pos.length > 1) {
        throw "long and short positions are checked at the same time!"
    } else if (pos.length != 0) {
        holdAmount = pos[0].Type == PD_LONG ? pos[0].Amount : -pos[0].Amount
        holdPrice = pos[0].Price
    }

    if (e.state.preBar == -1) {
        e.state.preBar = r[r.length - 1].Time
    }
    // check the signal
    if (e.state.preBar != r[r.length - 1].Time) {   // closing price model
        if (holdAmount <= 0 && r[r.length - 3].Close < upBand[upBand.length - 3] && r[r.length - 2].Close > upBand[upBand.length - 2]) {   // the closing price cross over the upBand
            if (holdAmount < 0) {   // hold a short positions, close them
                Log(e.GetCurrency(), "close short positions", "#FF0000")
                $.CoverShort(e, e.param.symbol, Math.abs(holdAmount))
                c.add(kIndex + 4, {x: r[r.length - 2].Time, color: 'red', shape: 'flag', title: 'close', text: "close short positions"})
            }
            // open long positions
            Log(e.GetCurrency(), "open long positions", "#FF0000")
            $.OpenLong(e, e.param.symbol, 10)
            c.add(kIndex + 4, {x: r[r.length - 2].Time, color: 'red', shape: 'flag', title: 'long', text: "open long positions"})
        } else if (holdAmount >= 0 && r[r.length - 3].Close > downBand[downBand.length - 3] && r[r.length - 2].Close < downBand[downBand.length - 2]) {  // the closing price cross down the downBand
            if (holdAmount > 0) {   // hold long positions, close them
                Log(e.GetCurrency(), "close long positions", "#FF0000")
                $.CoverLong(e, e.param.symbol, Math.abs(holdAmount))
                c.add(kIndex + 4, {x: r[r.length - 2].Time, color: 'green', shape: 'flag', title: 'close', text: "close long positions"})
            }
            // open short positions
            Log(e.GetCurrency(), "open short positions", "#FF0000")
            $.OpenShort(e, e.param.symbol, 10)
            c.add(kIndex + 4, {x: r[r.length - 2].Time, color: 'green', shape: 'flag', title: 'short', text: "open short positions"})
        } else {
            // close positions
            if (holdAmount > 0 && (r[r.length - 2].Close <= holdPrice * (1 - e.param.stopLoss) || r[r.length - 2].Close <= midLine[midLine.length - 2])) {   // Hold a long position, the closing price is less than or equal to the midline, stop loss at the opening price
                Log(e.GetCurrency(), "trigger midline or stop loss, close long positions", "#FF0000")
                $.CoverLong(e, e.param.symbol, Math.abs(holdAmount))
                c.add(kIndex + 4, {x: r[r.length - 2].Time, color: 'green', shape: 'flag', title: 'close', text: "close long positions"})
            } else if (holdAmount < 0 && (r[r.length - 2].Close >= holdPrice * (1 + e.param.stopLoss) || r[r.length - 2].Close >= midLine[midLine.length - 2])) {  // Hold a short position, the closing price is greater than or equal to the midline, stop loss at the opening price
                Log(e.GetCurrency(), "trigger midline or stop loss, close short positions", "#FF0000")
                $.CoverShort(e, e.param.symbol, Math.abs(holdAmount))
                c.add(kIndex + 4, {x: r[r.length - 2].Time, color: 'red', shape: 'flag', title: 'close', text: "close short positions"})
            }
        }
        e.state.preBar = r[r.length - 1].Time
    }
}

function main() {
    var arrChartConfig = []
    if (arrParam.length != exchanges.length) {
        throw "Parameters and exchange objects do not match!"
    }
    var arrState = _G("arrState")
    _.each(exchanges, function(e, index) {
        if (e.GetName() != "Futures_Binance") {
            throw "The exchange is not supported!"
        }
        e.param = arrParam[index]
        e.state = {lastBarTime: 0, symbol: e.param.symbol, currency: e.GetCurrency()}
        if (arrState) {
            if (arrState[index].symbol == e.param.symbol && arrState[index].currency == e.GetCurrency()) {
                Log("restore:", e.state)
                e.state = arrState[index]
            } else {
                throw "The restored data does not match the current settings!"
            }
        }
        e.state.preBar = -1   // initial setting -1
        e.SetContractType(e.param.symbol)
        Log(e.GetName(), e.GetLabel(), "set contracts:", e.param.symbol)
        arrChartConfig.push(createChartConfig(e.GetCurrency(), e.param.atrPeriod, e.param.emaPeriod, index))
    })
    var chart = Chart(arrChartConfig)
    chart.reset()

    while (true) {
        _.each(exchanges, function(e, index) {
            process(e, index + index * 4, chart)
            Sleep(500)
        })
    }
}

function onexit() {
    // record e.state
    var arrState = []
    _.each(exchanges, function(e) {
        arrState.push(e.state)
    })
    Log("record:", arrState)
    _G("arrState", arrState)
}
حکمت عملی کے پیرامیٹرز:
var params = '[{
        "symbol" : "swap",    // contract code
        "period" : 86400,     // K-line period, 86,400 seconds is a day
        "stopLoss" : 0.07,    // stop loss factor, 0.07 or 7%
        "atrPeriod" : 10,     // ATR indicator parameters
        "emaPeriod" : 10,     // EMA indicator parameters
        "trackRatio" : 1,     // upBand and downBand coefficients
        "openRatio" : 0.1     // The reserved opening percentage, which is not supported for now
    }, {
        "symbol" : "swap",
        "period" : 86400,
        "stopLoss" : 0.07,
        "atrPeriod" : 10,
        "emaPeriod" : 10,
        "trackRatio" : 1,
        "openRatio" : 0.1
    }]'
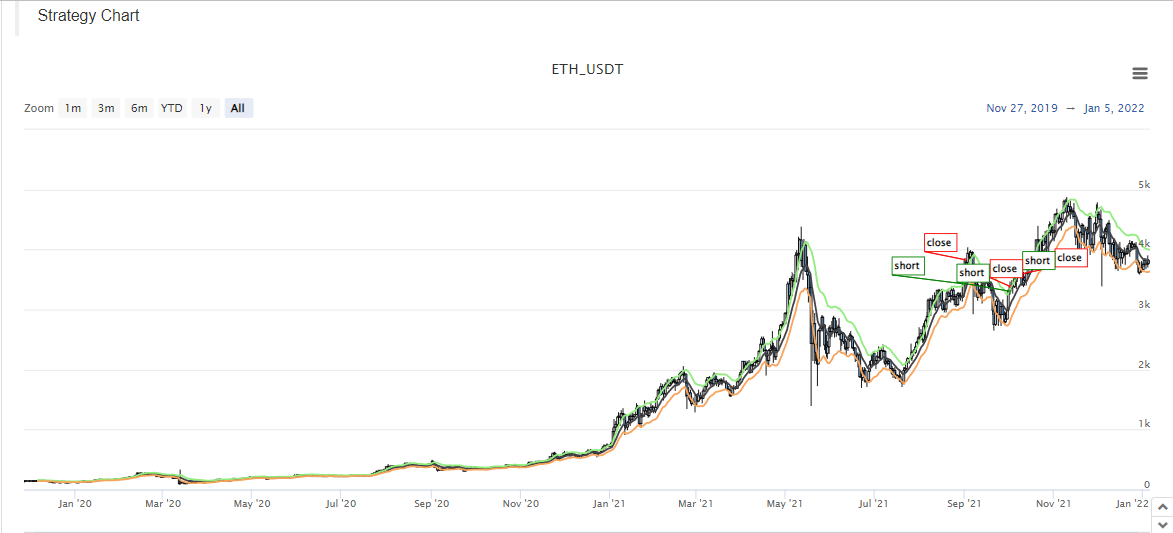
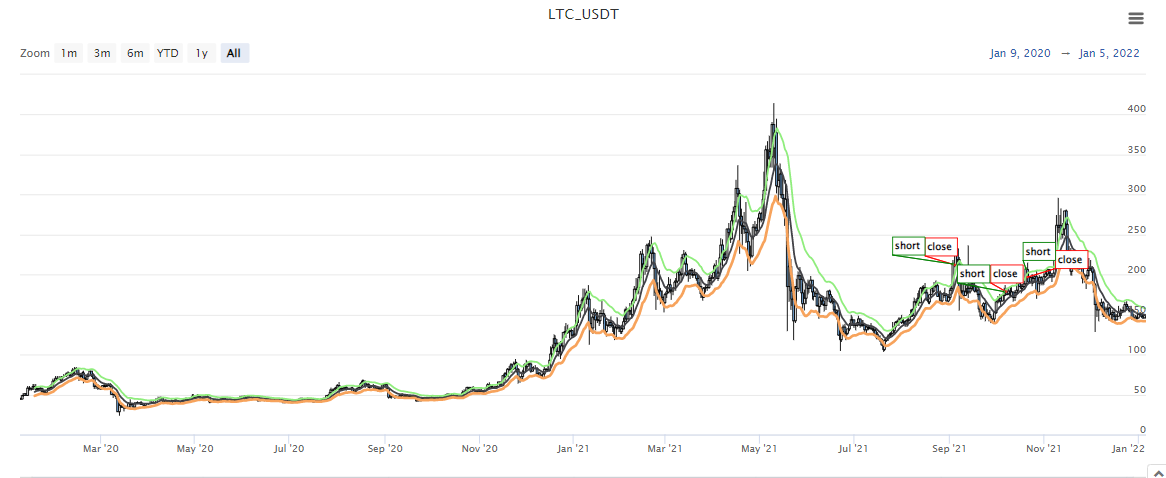
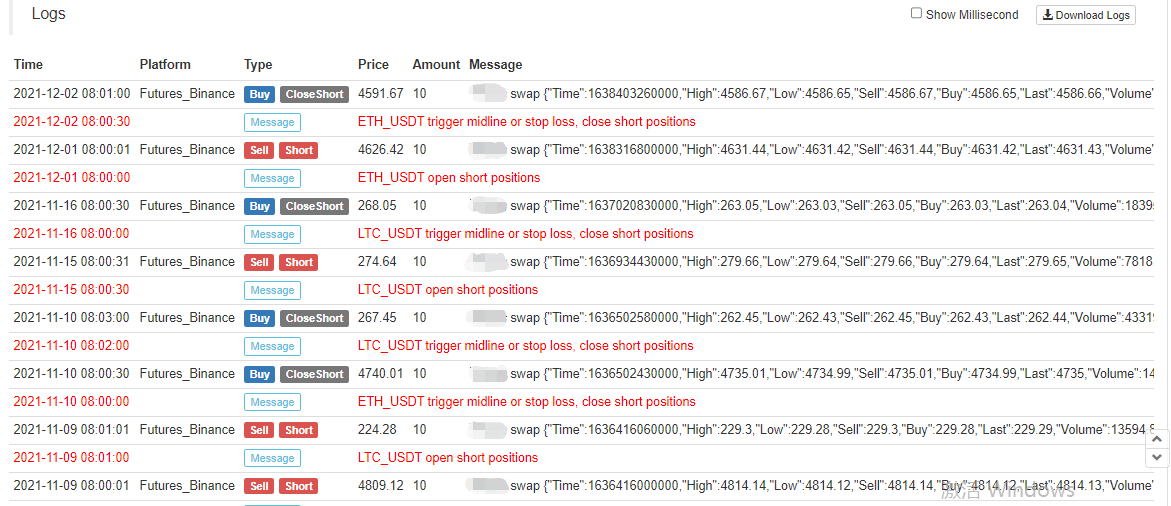
بیک ٹیسٹ اسکرین شاٹس:


حکمت عملی کا ماخذ کوڈ:https://www.fmz.com/strategy/339344
حکمت عملی صرف بیک ٹیسٹنگ اور سیکھنے کی تحقیق کے لئے ہیں۔ براہ کرم خود ہی ترمیم کریں ، بہتر بنائیں ، اور اصلی بوٹ کا حوالہ دیں۔
- کریپٹوکرنسی مارکیٹ میں بنیادی تجزیہ کی مقدار: اعداد و شمار کو اپنے لئے بولنے دیں!
- ایک بار پھر ، ہم نے ایک بار پھر اس بات کا یقین کرلیا ہے کہ یہ ایک بہت بڑا مسئلہ ہے ، لیکن ہم اس کے بارے میں مزید نہیں جانتے ہیں۔
- کوانٹائزڈ ٹرانزیکشنز کے لیے ایک لازمی ٹول۔
- ہر چیز پر قابو پانا - ایف ایم زیڈ ٹریڈنگ ٹرمینل کا نیا ورژن (ٹی آر بی آربیٹریج سورس کوڈ کے ساتھ) کا تعارف
- FMZ کے نئے ورژن کے ٹرانزیکشن ٹرمینل کے بارے میں سب کچھ جاننے کے لئے یہاں کلک کریں
- ایف ایم زیڈ کوانٹ: کریپٹوکرنسی مارکیٹ میں مشترکہ تقاضوں کے ڈیزائن مثالوں کا تجزیہ (II)
- 80 لائنوں کے کوڈ میں ہائی فریکوئینسی حکمت عملی کے ساتھ دماغ کے بغیر سیلز بوٹس کا استحصال کیسے کریں
- ایف ایم زیڈ کیوٹیفیکیشن: کریپٹوکرنسی مارکیٹ میں عام ضروریات کے ڈیزائن کی مثالوں کا تجزیہ (ب)
- 80 لائنوں کے کوڈ کے ساتھ ہائی فریکوئینسی کی حکمت عملی کے ساتھ فروخت کے لیے بے دماغ روبوٹ کا استحصال کیسے کیا گیا؟
- ایف ایم زیڈ کوانٹ: کریپٹوکرنسی مارکیٹ میں مشترکہ تقاضوں کے ڈیزائن مثالوں کا تجزیہ (I)
- ایف ایم زیڈ کیوٹیفیکیشن: کریپٹوکرنسی مارکیٹ میں عام ضروریات کے ڈیزائن کی مثالوں کا تجزیہ (1)