Giao dịch số lượng tiền điện tử cho người mới bắt đầu - đưa bạn đến gần số lượng tiền điện tử (5)
Tác giả:Lydia., Tạo: 2022-08-03 16:08:50, Cập nhật: 2023-09-21 21:07:02
Trong bài viết trước, chúng tôi đã giải thích phân tích logic giao dịch của một chiến lược lưới đơn giản.
-
Phân tích logic giao dịch Như chúng tôi đã đề cập trong bài viết trước, bạn có thể kích hoạt hành động giao dịch bằng cách đi qua mỗi đường lưới và đánh giá giá hiện tại vượt qua trên hoặc dưới.
Chi tiết đầu tiên chúng ta phải xem xét là thiết kế của lưới vô hạn.
createNetđể tạo ra cấu trúc dữ liệu lưới ban đầu cùng nhau trong bài viết trước? hàm này tạo ra một cấu trúc dữ liệu lưới với một số lượng hữu hạn các đường lưới. vậy nếu giá vượt ra ngoài ranh giới của cấu trúc dữ liệu lưới này (ngoài đường lưới trên cùng nơi giá cao nhất và đường lưới dưới cùng nơi giá thấp nhất) khi chiến lược đang chạy thì sao? Vì vậy, chúng ta cần thêm một cơ chế mở rộng vào cấu trúc dữ liệu lưới đầu tiên.Hãy bắt đầu viết các chiến lược chức năng chính, đó là mã mà chiến lược bắt đầu thực hiện
var diff = 50                                 // Global variables and grid spacing can be designed as parameters for easy explanation. We write this parameter into the code.
function main() {
    // After the real bot starts running, execute the strategy code from here
    var ticker = _C(exchange.GetTicker)       // To get the latest market data ticker, please refer to the FMZ API documentation for the structure of the ticker data: https://www.fmz.com/api#ticker
    var net = createNet(ticker.Last, diff)    // The function we designed in the previous article to construct the grid data structure initially, here we construct a grid data structure net

    while (true) {                            // Then the program logic enters this while infinite loop, and the strategy execution will continue to execute the code within the {} symbol here.
        ticker = _C(exchange.GetTicker)       // The first line of the infinite loop code section, get the latest market data and update it to the ticker variable
        // Check the grid range
        while (ticker.Last >= net[net.length - 1].price) {
            net.push({
                buy : false,
                sell : false,
                price : net[net.length - 1].price + diff,
            })
        }
        while (ticker.Last <= net[0].price) {
            var price = net[0].price - diff
            if (price <= 0) {
                break
            }
            net.unshift({
                buy : false,
                sell : false,
                price : price,
            })
        }

        // There are other codes...
    }
}
Làm cho cấu trúc dữ liệu lưới có thể mở rộng là mã này (được trích từ mã trên):
      // Check the grid range
      while (ticker.Last >= net[net.length - 1].price) {   // If the price exceeds the grid line of the highest price of the grid
          net.push({                                       // Just add a new grid line after the grid line with the highest price of the grid
              buy : false,                                 // Initialize sell marker
              sell : false,                                // Initialize buy marker
              price : net[net.length - 1].price + diff,    // dd a grid spacing to the previous highest price
          })
      }
      while (ticker.Last <= net[0].price) {                // If the price is lower than the grid line of the lowest price of the grid
          var price = net[0].price - diff                  // Different from adding upwards, it should be noted that the price of adding new grid lines downwards cannot be less than or equal to 0, so it is necessary to judge here
          if (price <= 0) {                                // Less than or equal to 0 will not be added, jump out of this loop
              break
          }
          net.unshift({                                    // Add a new grid line just before the grid line with the lowest price of the grid
              buy : false,
              sell : false,
              price : price,
          })
      }
Bước tiếp theo là xem xét cách thực hiện kích hoạt giao dịch cụ thể.
var diff = 50
var amount = 0.002       // Add a global variable, which can also be designed as a parameter. Of course, for the sake of simplicity, we also write it in the strategy code.
                         // This parameter controls the trade volume each time a trade is triggered on the grid line
function main() {
    var ticker = _C(exchange.GetTicker)
    var net = createNet(ticker.Last, diff)
    var preTicker = ticker       // Before the main loop (fixed loop) starts, set a variable to record the last market data
    while (true) {
        ticker = _C(exchange.GetTicker)
        // Check the grid range
        while (ticker.Last >= net[net.length - 1].price) {
            net.push({
                buy : false,
                sell : false,
                price : net[net.length - 1].price + diff,
            })
        }
        while (ticker.Last <= net[0].price) {
            var price = net[0].price - diff
            if (price <= 0) {
                break
            }
            net.unshift({
                buy : false,
                sell : false,
                price : price,
            })
        }

        // Retrieve grid
        for (var i = 0 ; i < net.length ; i++) {     // Iterate over all grid lines in the grid data structure
            var p = net[i]
            if (preTicker.Last < p.price && ticker.Last > p.price) {         // Above the SMA, sell, the current node has already traded, regardless of SELL BUY, it will no longer be traded
                if (i != 0) {
                    var downP = net[i - 1]
                    if (downP.buy) {
                        exchange.Sell(-1, amount, ticker)
                        downP.buy = false
                        p.sell = false
                        continue
                    }
                }
                if (!p.sell && !p.buy) {
                    exchange.Sell(-1, amount, ticker)
                    p.sell = true
                }
            } else if (preTicker.Last > p.price && ticker.Last < p.price) {  // Below the SMA, buy
                if (i != net.length - 1) {
                    var upP = net[i + 1]
                    if (upP.sell) {
                        exchange.Buy(-1, amount * ticker.Last, ticker)
                        upP.sell = false
                        p.buy = false
                        continue
                    }
                }
                if (!p.buy && !p.sell) {
                    exchange.Buy(-1, amount * ticker.Last, ticker)
                    p.buy = true
                }
            }
        }
        preTicker = ticker    // Record the current market data in preTicker, and in the next cycle, use it as a comparison between the "previous" market data and the latest one to judge whether to be above the SMA or below the SMA.
        Sleep(500)
    }
}
Có thể thấy rằng:
- Điều kiện vượt qua trên đường lưới:
preTicker.Last < p.price && ticker.Last > p.price - Điều kiện vượt qua dưới đường lưới:
preTicker.Last > p.price && ticker.Last < p.price
Đây là những gì chúng tôi đã nói trong bài đăng trước:
- Điều kiện vượt qua trên đường lưới:
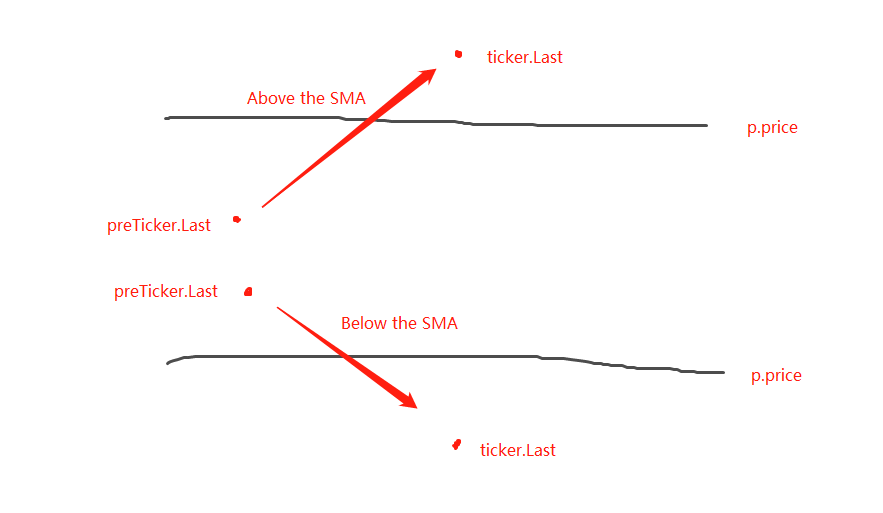
Việc đánh giá liệu có nên ở trên hoặc dưới SMA chỉ là bước đầu tiên để đánh giá liệu một lệnh có thể được đặt hay không, và cũng cần phải đánh giá các dấu hiệu trong dữ liệu đường lưới.
Nếu nó trên SMA, giá được đánh giá thấp hơn đường lưới hiện tại và dấu mua trên đường lưới gần nhất. Nếu giá trị của dấu mua là đúng, điều đó có nghĩa là đường lưới trước đã được mua và đặt lại dấu mua trước đó thành sai, và đặt lại dấu bán đường lưới hiện tại thành sai.
Sau khi đánh giá các điều kiện, nếu không có kích hoạt, tiếp tục đánh giá. Nếu các dấu hiệu mua / bán trên đường lưới hiện tại đều sai, điều đó có nghĩa là đường lưới hiện tại có thể được giao dịch. Vì nó nằm trên SMA, chúng tôi sẽ thực hiện một hoạt động bán ở đây. Sau khi thực hiện, đánh dấu dấu hiệu bán đường lưới hiện tại đúng.
Logic xử lý là giống nhau để ở dưới SMA (bỏ cho người mới bắt đầu suy nghĩ về ở đây).
Kiểm tra lại chiến lược hoàn chỉnh
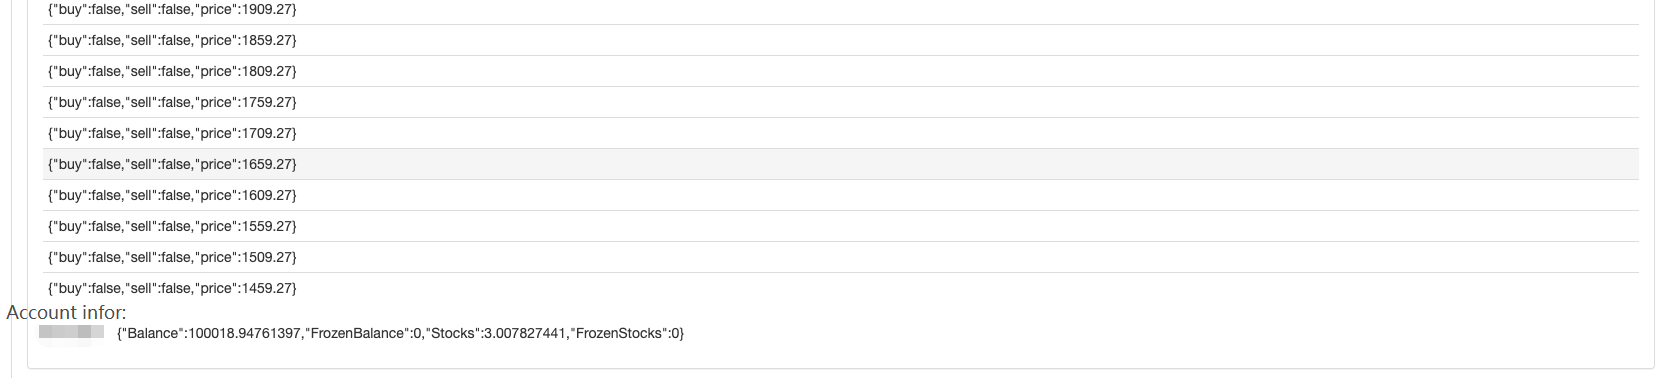
Để xem một số dữ liệu trong quá trình backtesting, một hàmshowTblđược viết để hiển thị dữ liệu.
function showTbl(arr) {
    var tbl = {
        type : "table",
        title : "grid",
        cols : ["grid information"],
        rows : []
    }
    var arrReverse = arr.slice(0).reverse()
    _.each(arrReverse, function(ele) {
        var color = ""
        if (ele.buy) {
            color = "#FF0000"
        } else if (ele.sell) {
            color = "#00FF00"
        }
        tbl.rows.push([JSON.stringify(ele) + color])
    })
    LogStatus(_D(), "\n`" + JSON.stringify(tbl) + "`", "\n account Information:", exchange.GetAccount())
}
Mã chiến lược đầy đủ:
/*backtest
start: 2021-04-01 22:00:00
end: 2021-05-22 00:00:00
period: 1d
basePeriod: 1m
exchanges: [{"eid":"OKEX","currency":"ETH_USDT","balance":100000}]
*/

var diff = 50
var amount = 0.002
function createNet(begin, diff) {
    var oneSideNums = 10
    var up = []
    var down = []
    for (var i = 0 ; i < oneSideNums ; i++) {
        var upObj = {
            buy : false,
            sell : false,
            price : begin + diff / 2 + i * diff,
        }
        up.push(upObj)

        var j = (oneSideNums - 1) - i
        var downObj = {
            buy : false,
            sell : false,
            price : begin - diff / 2 - j * diff,
        }
        if (downObj.price <= 0) {  // The price cannot be less than or equal to 0
            continue
        }
        down.push(downObj)
    }

    return down.concat(up)
}

function showTbl(arr) {
    var tbl = {
        type : "table",
        title : "grid",
        cols : ["grid Information"],
        rows : []
    }
    var arrReverse = arr.slice(0).reverse()
    _.each(arrReverse, function(ele) {
        var color = ""
        if (ele.buy) {
            color = "#FF0000"
        } else if (ele.sell) {
            color = "#00FF00"
        }
        tbl.rows.push([JSON.stringify(ele) + color])
    })
    LogStatus(_D(), "\n`" + JSON.stringify(tbl) + "`", "\n account Information:", exchange.GetAccount())
}

function main() {
    var ticker = _C(exchange.GetTicker)
    var net = createNet(ticker.Last, diff)
    var preTicker = ticker
    while (true) {
        ticker = _C(exchange.GetTicker)
        // Check the grid range
        while (ticker.Last >= net[net.length - 1].price) {
            net.push({
                buy : false,
                sell : false,
                price : net[net.length - 1].price + diff,
            })
        }
        while (ticker.Last <= net[0].price) {
            var price = net[0].price - diff
            if (price <= 0) {
                break
            }
            net.unshift({
                buy : false,
                sell : false,
                price : price,
            })
        }

        // Retrieve grid
        for (var i = 0 ; i < net.length ; i++) {
            var p = net[i]
            if (preTicker.Last < p.price && ticker.Last > p.price) {         // Being above the SMA, sell, the current node has already traded, regardless of SELL BUY, it will no longer be traded
                if (i != 0) {
                    var downP = net[i - 1]
                    if (downP.buy) {
                        exchange.Sell(-1, amount, ticker)
                        downP.buy = false
                        p.sell = false
                        continue
                    }
                }
                if (!p.sell && !p.buy) {
                    exchange.Sell(-1, amount, ticker)
                    p.sell = true
                }
            } else if (preTicker.Last > p.price && ticker.Last < p.price) {  // Being below the SMA, buy
                if (i != net.length - 1) {
                    var upP = net[i + 1]
                    if (upP.sell) {
                        exchange.Buy(-1, amount * ticker.Last, ticker)
                        upP.sell = false
                        p.buy = false
                        continue
                    }
                }
                if (!p.buy && !p.sell) {
                    exchange.Buy(-1, amount * ticker.Last, ticker)
                    p.buy = true
                }
            }
        }

        showTbl(net)
        preTicker = ticker
        Sleep(500)
    }
}
Kiểm tra lại chiến lược:
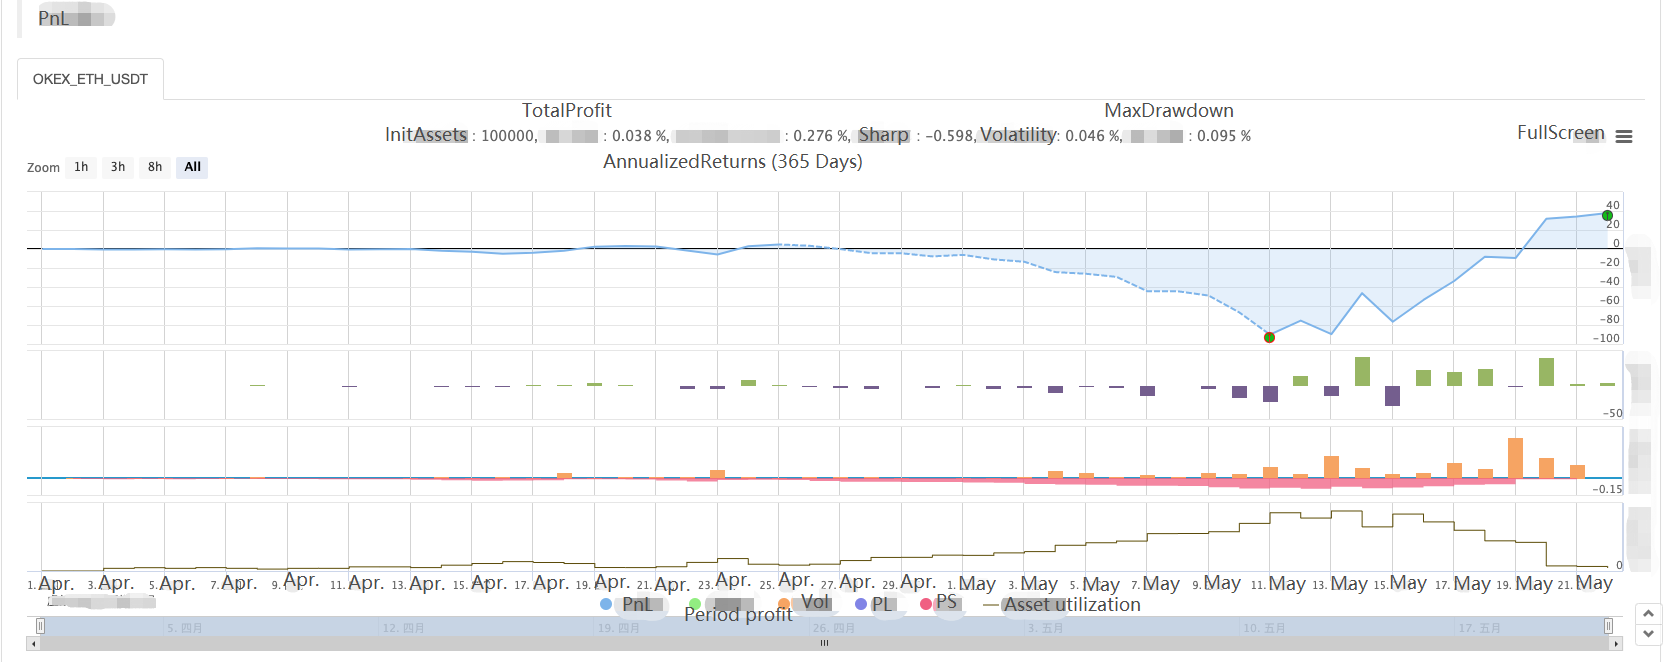
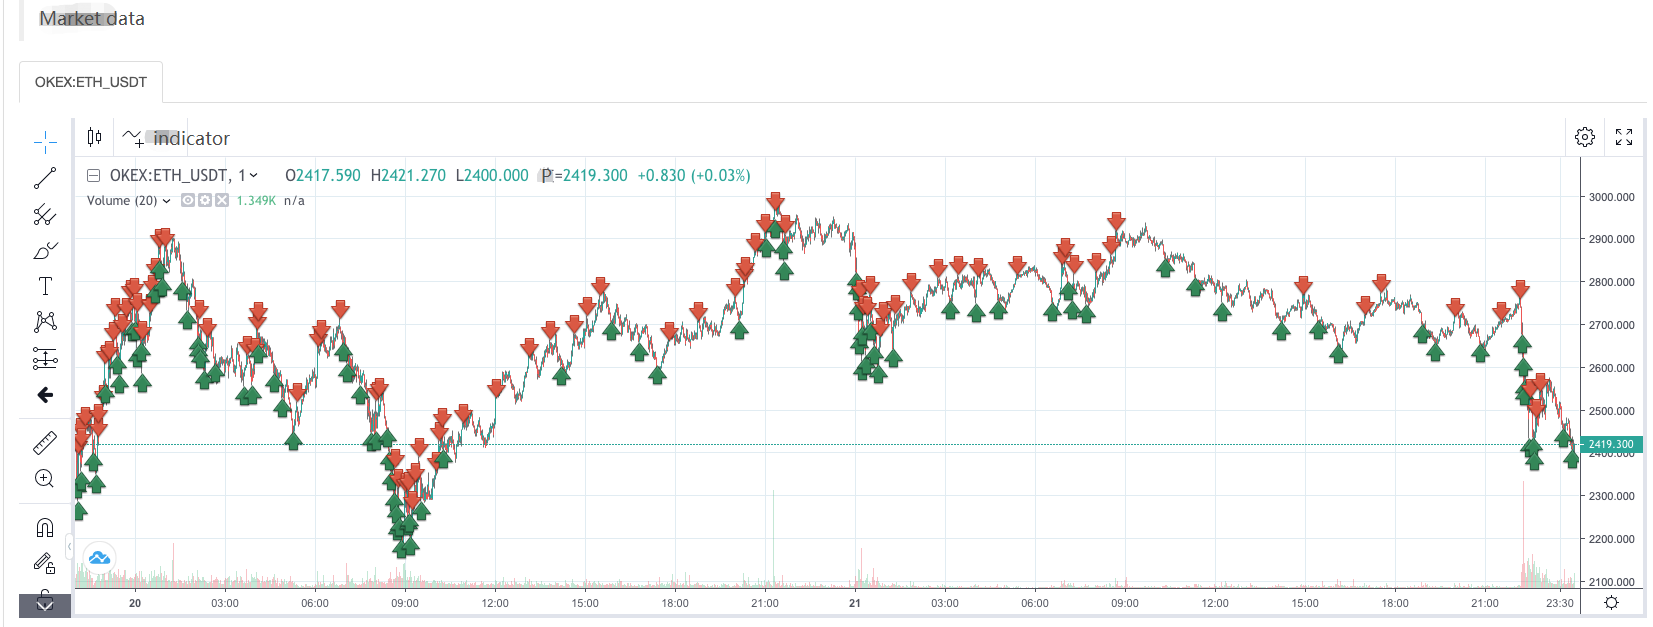
Vì vậy, chúng ta có thể thấy các đặc điểm của chiến lược lưới điện, khi có một thị trường xu hướng, sẽ có một khoản lỗ nổi lớn, và lợi nhuận sẽ phục hồi trong một thị trường biến động.
Do đó, chiến lược lưới không phải là không có rủi ro. Chiến lược giao ngay vẫn có thể được
- Xác định số lượng phân tích cơ bản trong thị trường tiền điện tử: Hãy để dữ liệu nói cho chính nó!
- Các nghiên cứu định lượng cơ bản của vòng đồng tiền - đừng tin vào những giáo viên mờ nhạt, nói khách quan về dữ liệu!
- Một công cụ thiết yếu trong lĩnh vực giao dịch định lượng - nhà phát minh mô-đun khám phá dữ liệu định lượng
- Kiểm soát mọi thứ - giới thiệu về FMZ Phiên bản mới của Terminal giao dịch (với mã nguồn TRB Arbitrage)
- Có tất cả các thông tin về FMZ phiên bản mới của giao dịch đầu cuối (được thêm mã nguồn TRB)
- FMZ Quant: Phân tích các ví dụ thiết kế yêu cầu chung trong thị trường tiền điện tử (II)
- Làm thế nào để khai thác robot bán hàng không có não với một chiến lược tần số cao trong 80 dòng mã
- FMZ định lượng: Phân tích các trường hợp thiết kế nhu cầu phổ biến của thị trường tiền điện tử (II)
- Cách khai thác robot vô trí tuệ để bán bằng chiến lược tần số cao 80 dòng mã
- FMZ Quant: Phân tích các ví dụ thiết kế yêu cầu chung trong thị trường tiền điện tử (I)
- FMZ định lượng: Các nhu cầu phổ biến của thị trường tiền điện tử