Chiến lược ATR đa loài tương lai tiền tệ kỹ thuật số (bài hướng dẫn)
Tác giả:Lydia., Tạo: 2022-11-08 10:34:22, Cập nhật: 2023-09-15 20:55:33
Gần đây, một số người dùng nền tảng của chúng tôi đang mong muốn cấy ghép một chiến lược MyLanguage vào một chiến lược JavaScript, có thể thêm nhiều ý tưởng tối ưu hóa một cách linh hoạt. Thậm chí mở rộng chiến lược sang các phiên bản đa loài. Bởi vì chiến lược MyLanguage thường là một chiến lược xu hướng, và nhiều trong số đó được thực hiện dựa trên mô hình giá đóng. Giao diện API của giao dịch yêu cầu chiến lược không thường xuyên, phù hợp với việc cấy ghép vào phiên bản chiến lược đa loài. Trong bài viết này, chúng tôi sẽ lấy một chiến lược MyLanguage đơn giản làm ví dụ để cấy ghép nó vào một phiên bản đơn giản của ngôn ngữ JavaScript. Mục đích chính là giảng dạy và hỗ trợ nghiên cứu. Nếu bạn muốn tạo một bot thực sự, bạn có thể cần thêm một số chi tiết (giá giá đặt hàng, độ chính xác số lượng, số lượng đặt hàng, kiểm soát thứ tự theo tài sản, hiển thị thông tin tình trạng, v.v.), và cũng cần một bot thực sự.
Chiến lược của MyLanguage để được cấy ghép
TR:=MAX(MAX((H-L),ABS(REF(C,1)-H)),ABS(REF(C,1)-L));
ATR:=EMA(TR,LENGTH2);

MIDLINE^^EMA((H + L + C)/3,LENGTH1);
UPBAND^^MIDLINE + N*ATR;
DOWNBAND^^MIDLINE - N*ATR;


BKVOL=0 AND C>=UPBAND AND REF(C,1)<REF(UPBAND,1),BPK;
SKVOL=0 AND C<=DOWNBAND AND REF(C,1)>REF(DOWNBAND,1),SPK;

BKVOL>0 AND C<=MIDLINE,SP(BKVOL);
SKVOL>0 AND C>=MIDLINE,BP(SKVOL);
// stop loss
// stop loss
C>=SKPRICE*(1+SLOSS*0.01),BP;
C<=BKPRICE*(1-SLOSS*0.01),SP;
AUTOFILTER;
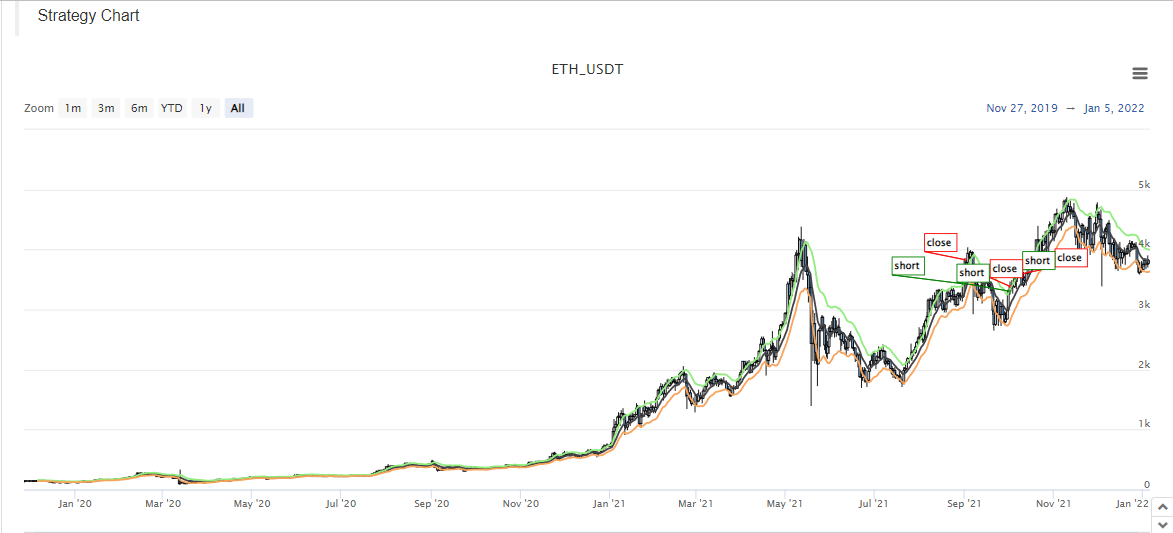
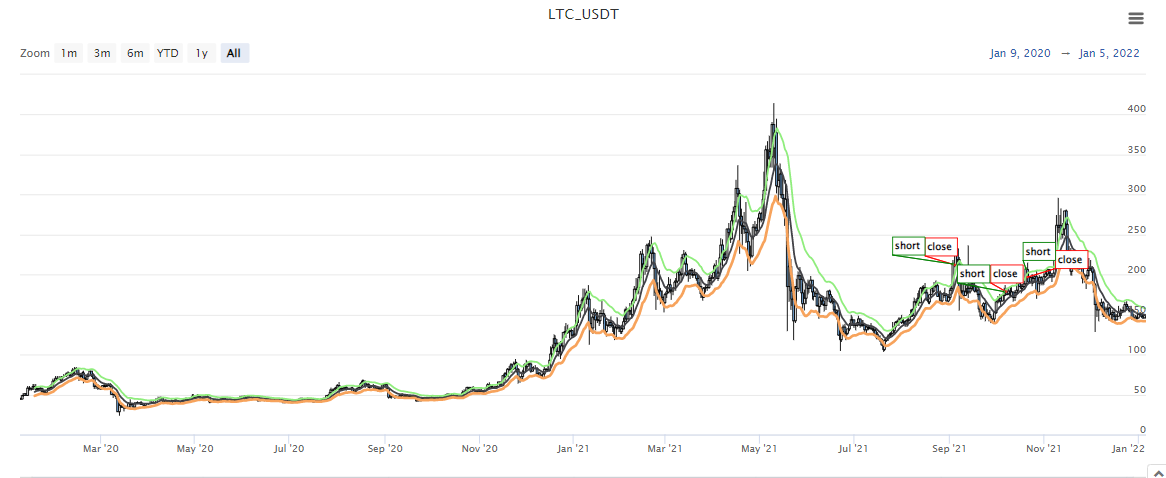
Khái niệm giao dịch của chiến lược này rất đơn giản. Đầu tiên, tính ATR theo các thông số, sau đó tính trung bình của giá cao nhất, thấp nhất và giá đóng của tất cả các K-line BAR, và sau đó tính chỉ số EMA theo dữ liệu trung bình. Cuối cùng, kết hợp ATR và hệ số N trong các thông số để tính upBand và downBand.
Các vị trí mở và bán dựa trên giá đóng. Mở các vị trí dài khi vượt qua upBand và bán vị trí mở (khi giữ các vị trí ngắn). Mở các vị trí ngắn khi vượt qua downBand và bán vị trí mở. Khi giá đóng đạt đến đường trung bình, vị trí sẽ được đóng, và khi giá đóng đạt đến giá dừng lỗ, vị trí cũng sẽ được đóng (giờ dừng lỗ theo SLOSS, SLOSS là 1, tức là 0,01, tức là 1%). Chiến lược được thực hiện theo mô hình giá đóng cửa.
Được rồi, nếu chúng ta hiểu được các yêu cầu chiến lược và ý tưởng của MyLanguage, chúng ta có thể bắt đầu cấy ghép chúng.
Nguyên mẫu chiến lược ghép và thiết kế
Không có nhiều mã nguyên mẫu chiến lược, dao động từ 1 đến 200 dòng. Để tạo điều kiện dễ dàng để học các ý tưởng viết chiến lược, các bình luận được viết trực tiếp trong mã chiến lược.
// parse params parameters, and parse strings as objects
var arrParam = JSON.parse(params)

// this function creates a chart configuration
function createChartConfig(symbol, atrPeriod, emaPeriod, index) {   // symbol : trading pair, atrPeriod : ATR parameter period , emaPeriod : EMA parameter period, exchange object index corresponding to index
    var chart = {
        __isStock: true,
        extension: {
                layout: 'single',
                height: 600,
        },
        title : { text : symbol},
        xAxis: { type: 'datetime'},
        series : [
            {
                type: 'candlestick',    // K-line data series
                name: symbol,
                id: symbol + "-" + index,
                data: []
            }, {
                type: 'line',           // EMA
                name: symbol + ',EMA:' + emaPeriod,
                data: [],
            }, {
                type: 'line',           // upBand
                name: symbol + ',upBand' + atrPeriod,
                data: []
            }, {
                type: 'line',           // downBand
                name: symbol + ',downBand' + atrPeriod,
                data: []
            }, {
                type: 'flags',
                onSeries: symbol + "-" + index,
                data: [],
            }
        ]
    }
    return chart
}

// main Logic
function process(e, kIndex, c) {    // e is the exchange object, exchanges [0]..., kIndex is the K-line data series in the chart, and c is the chart object
    // obtain K-line data
    var r = e.GetRecords(e.param.period)
    if (!r || r.length < e.param.atrPeriod + 2 || r.length < e.param.emaPeriod + 2) {
        // if the K-line data length is insufficient, return
        return
    }

    // calculate ATR indicators
    var atr = TA.ATR(r, e.param.atrPeriod)
    var arrAvgPrice = []
    _.each(r, function(bar) {
        arrAvgPrice.push((bar.High + bar.Low + bar.Close) / 3)
    })
    // calculate EMA indicators
    var midLine = TA.EMA(arrAvgPrice, e.param.emaPeriod)
    // calculate upBand and downBand
    var upBand = []
    var downBand = []
    _.each(midLine, function(mid, index) {
        if (index < e.param.emaPeriod - 1 || index < e.param.atrPeriod - 1) {
            upBand.push(NaN)
            downBand.push(NaN)
            return
        }
        upBand.push(mid + e.param.trackRatio * atr[index])
        downBand.push(mid - e.param.trackRatio * atr[index])
    })

    // draw the chart
    for (var i = 0 ; i < r.length ; i++) {
        if (r[i].Time == e.state.lastBarTime) {
            // update
            c.add(kIndex, [r[i].Time, r[i].Open, r[i].High, r[i].Low, r[i].Close], -1)
            c.add(kIndex + 1, [r[i].Time, midLine[i]], -1)
            c.add(kIndex + 2, [r[i].Time, upBand[i]], -1)
            c.add(kIndex + 3, [r[i].Time, downBand[i]], -1)
        } else if (r[i].Time > e.state.lastBarTime) {
            // add
            e.state.lastBarTime = r[i].Time
            c.add(kIndex, [r[i].Time, r[i].Open, r[i].High, r[i].Low, r[i].Close])
            c.add(kIndex + 1, [r[i].Time, midLine[i]])
            c.add(kIndex + 2, [r[i].Time, upBand[i]])
            c.add(kIndex + 3, [r[i].Time, downBand[i]])
        }
    }

    // check the position
    var pos = e.GetPosition()
    if (!pos) {
        return
    }
    var holdAmount = 0
    var holdPrice = 0
    if (pos.length > 1) {
        throw "long and short positions are checked at the same time!"
    } else if (pos.length != 0) {
        holdAmount = pos[0].Type == PD_LONG ? pos[0].Amount : -pos[0].Amount
        holdPrice = pos[0].Price
    }

    if (e.state.preBar == -1) {
        e.state.preBar = r[r.length - 1].Time
    }
    // check the signal
    if (e.state.preBar != r[r.length - 1].Time) {   // closing price model
        if (holdAmount <= 0 && r[r.length - 3].Close < upBand[upBand.length - 3] && r[r.length - 2].Close > upBand[upBand.length - 2]) {   // the closing price cross over the upBand
            if (holdAmount < 0) {   // hold a short positions, close them
                Log(e.GetCurrency(), "close short positions", "#FF0000")
                $.CoverShort(e, e.param.symbol, Math.abs(holdAmount))
                c.add(kIndex + 4, {x: r[r.length - 2].Time, color: 'red', shape: 'flag', title: 'close', text: "close short positions"})
            }
            // open long positions
            Log(e.GetCurrency(), "open long positions", "#FF0000")
            $.OpenLong(e, e.param.symbol, 10)
            c.add(kIndex + 4, {x: r[r.length - 2].Time, color: 'red', shape: 'flag', title: 'long', text: "open long positions"})
        } else if (holdAmount >= 0 && r[r.length - 3].Close > downBand[downBand.length - 3] && r[r.length - 2].Close < downBand[downBand.length - 2]) {  // the closing price cross down the downBand
            if (holdAmount > 0) {   // hold long positions, close them
                Log(e.GetCurrency(), "close long positions", "#FF0000")
                $.CoverLong(e, e.param.symbol, Math.abs(holdAmount))
                c.add(kIndex + 4, {x: r[r.length - 2].Time, color: 'green', shape: 'flag', title: 'close', text: "close long positions"})
            }
            // open short positions
            Log(e.GetCurrency(), "open short positions", "#FF0000")
            $.OpenShort(e, e.param.symbol, 10)
            c.add(kIndex + 4, {x: r[r.length - 2].Time, color: 'green', shape: 'flag', title: 'short', text: "open short positions"})
        } else {
            // close positions
            if (holdAmount > 0 && (r[r.length - 2].Close <= holdPrice * (1 - e.param.stopLoss) || r[r.length - 2].Close <= midLine[midLine.length - 2])) {   // Hold a long position, the closing price is less than or equal to the midline, stop loss at the opening price
                Log(e.GetCurrency(), "trigger midline or stop loss, close long positions", "#FF0000")
                $.CoverLong(e, e.param.symbol, Math.abs(holdAmount))
                c.add(kIndex + 4, {x: r[r.length - 2].Time, color: 'green', shape: 'flag', title: 'close', text: "close long positions"})
            } else if (holdAmount < 0 && (r[r.length - 2].Close >= holdPrice * (1 + e.param.stopLoss) || r[r.length - 2].Close >= midLine[midLine.length - 2])) {  // Hold a short position, the closing price is greater than or equal to the midline, stop loss at the opening price
                Log(e.GetCurrency(), "trigger midline or stop loss, close short positions", "#FF0000")
                $.CoverShort(e, e.param.symbol, Math.abs(holdAmount))
                c.add(kIndex + 4, {x: r[r.length - 2].Time, color: 'red', shape: 'flag', title: 'close', text: "close short positions"})
            }
        }
        e.state.preBar = r[r.length - 1].Time
    }
}

function main() {
    var arrChartConfig = []
    if (arrParam.length != exchanges.length) {
        throw "Parameters and exchange objects do not match!"
    }
    var arrState = _G("arrState")
    _.each(exchanges, function(e, index) {
        if (e.GetName() != "Futures_Binance") {
            throw "The exchange is not supported!"
        }
        e.param = arrParam[index]
        e.state = {lastBarTime: 0, symbol: e.param.symbol, currency: e.GetCurrency()}
        if (arrState) {
            if (arrState[index].symbol == e.param.symbol && arrState[index].currency == e.GetCurrency()) {
                Log("restore:", e.state)
                e.state = arrState[index]
            } else {
                throw "The restored data does not match the current settings!"
            }
        }
        e.state.preBar = -1   // initial setting -1
        e.SetContractType(e.param.symbol)
        Log(e.GetName(), e.GetLabel(), "set contracts:", e.param.symbol)
        arrChartConfig.push(createChartConfig(e.GetCurrency(), e.param.atrPeriod, e.param.emaPeriod, index))
    })
    var chart = Chart(arrChartConfig)
    chart.reset()

    while (true) {
        _.each(exchanges, function(e, index) {
            process(e, index + index * 4, chart)
            Sleep(500)
        })
    }
}

function onexit() {
    // record e.state
    var arrState = []
    _.each(exchanges, function(e) {
        arrState.push(e.state)
    })
    Log("record:", arrState)
    _G("arrState", arrState)
}
Các thông số chiến lược:
var params = '[{
        "symbol" : "swap",    // contract code
        "period" : 86400,     // K-line period, 86,400 seconds is a day
        "stopLoss" : 0.07,    // stop loss factor, 0.07 or 7%
        "atrPeriod" : 10,     // ATR indicator parameters
        "emaPeriod" : 10,     // EMA indicator parameters
        "trackRatio" : 1,     // upBand and downBand coefficients
        "openRatio" : 0.1     // The reserved opening percentage, which is not supported for now
    }, {
        "symbol" : "swap",
        "period" : 86400,
        "stopLoss" : 0.07,
        "atrPeriod" : 10,
        "emaPeriod" : 10,
        "trackRatio" : 1,
        "openRatio" : 0.1
    }]'
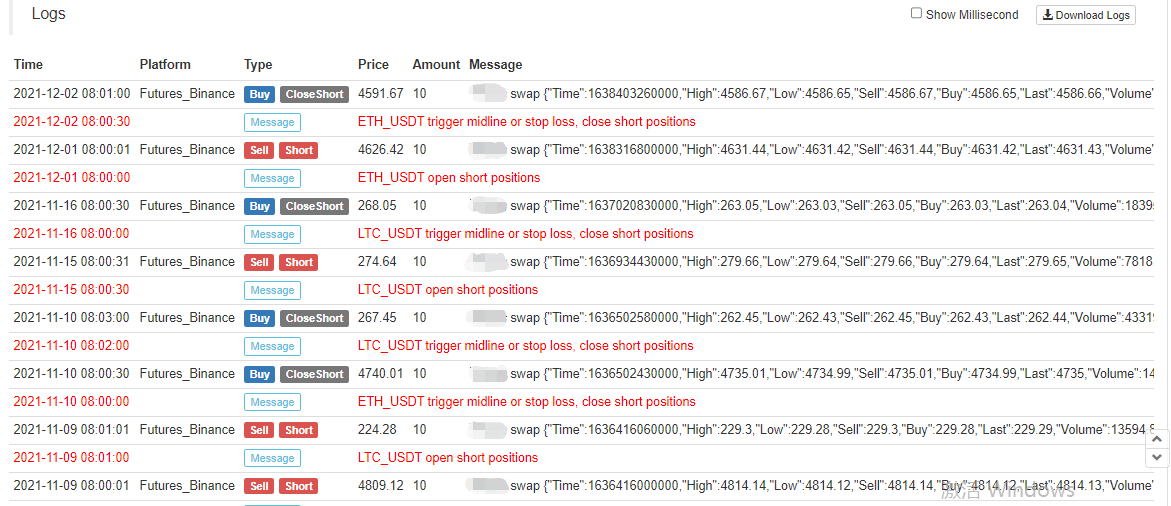
Ảnh chụp màn hình:
Mã nguồn chiến lược:https://www.fmz.com/strategy/339344
Các chiến lược chỉ dành cho backtesting và nghiên cứu học tập. Xin vui lòng sửa đổi, tối ưu hóa và tham khảo bot thực của chính bạn.
- Xác định số lượng phân tích cơ bản trong thị trường tiền điện tử: Hãy để dữ liệu nói cho chính nó!
- Các nghiên cứu định lượng cơ bản của vòng đồng tiền - đừng tin vào những giáo viên mờ nhạt, nói khách quan về dữ liệu!
- Một công cụ thiết yếu trong lĩnh vực giao dịch định lượng - nhà phát minh mô-đun khám phá dữ liệu định lượng
- Kiểm soát mọi thứ - giới thiệu về FMZ Phiên bản mới của Terminal giao dịch (với mã nguồn TRB Arbitrage)
- Có tất cả các thông tin về FMZ phiên bản mới của giao dịch đầu cuối (được thêm mã nguồn TRB)
- FMZ Quant: Phân tích các ví dụ thiết kế yêu cầu chung trong thị trường tiền điện tử (II)
- Làm thế nào để khai thác robot bán hàng không có não với một chiến lược tần số cao trong 80 dòng mã
- FMZ định lượng: Phân tích các trường hợp thiết kế nhu cầu phổ biến của thị trường tiền điện tử (II)
- Cách khai thác robot vô trí tuệ để bán bằng chiến lược tần số cao 80 dòng mã
- FMZ Quant: Phân tích các ví dụ thiết kế yêu cầu chung trong thị trường tiền điện tử (I)
- FMZ định lượng: Các nhu cầu phổ biến của thị trường tiền điện tử