Dạy bạn thêm hỗ trợ đa biểu đồ cho chiến lược
Tác giả:Lydia., Tạo: 2022-12-26 11:28:50, Cập nhật: 2023-09-20 09:52:47
Dạy bạn thêm hỗ trợ đa biểu đồ cho chiến lược
Đặc biệt là khi viết các chiến lược xu hướng, đôi khi bạn bị nhầm lẫn bởi các điều kiện kích hoạt của các chỉ số khác nhau. Vào thời điểm này, điều khẩn cấp là phải hình dung dữ liệu để phân tích và xem. Khi thêm một biểu đồ duy nhất vào một chiến lược, bạn có thể sử dụng mẫu
Đây là một ví dụ để tham khảo. Tôi sẽ bình luận về dòng mã mẫu từng dòng. Khi bạn đọc xong mã, bạn sẽ có một sự hiểu biết mới về việc thêm hỗ trợ biểu đồ vào chiến lược.
/*backtest
start: 2019-07-01 00:00:00
end: 2019-08-24 00:00:00
period: 1h
exchanges: [{"eid":"Futures_OKCoin","currency":"BTC_USD"}]
args: [["IsSynthesisDayKL",true]]
*/

var chart0 = {
    __isStock: true,
    // /*
    extension: {
            layout: 'single',
            height: 300,
    },
    // */
    title : { text : 'Daily K-line chart'},
    xAxis: { type: 'datetime'},
    series : [
        {
            type: 'candlestick',
            name: 'r',
            id: 'r',
            data: []
        }
    ]
}

var chart1 = {
    __isStock: true,
    // /*
    extension: {
            layout: 'single',
            height: 300,
    },
    // */
    title : { text : 'EMA'},
    xAxis: { type: 'datetime'},
    series : [
        {
            type: 'candlestick',
            name: 'r1',
            id: 'r1',
            data: []
        }, {
            type: 'line',
            name: 'chart1_EMA1',
            data: [],
        }, {
            type: 'line',
            name: 'chart1_EMA2',
            data: []
        }
    ]
}

var chart2 = {
    __isStock: true,
    // /*
    extension: {
            layout: 'single',
            height: 300,
    },
    // */
    title : { text : 'MACD'},
    xAxis: { type: 'datetime'},
    yAxis : [
        {
            title: {text: 'price'},
            opposite: false
        }, {
            title:{text: "Indicator axis"},
            opposite: true,
        }
    ],
    series : [
        {
            type: 'candlestick',
            name: 'r2',
            id: 'r2',
            data: []
        }, {
            type: 'line',
            yAxis: 1,
            name: 'dif',
            data: []
        }, {
            type: 'line',
            yAxis: 1,
            name: 'dea',
            data: []
        }
    ]
}

function CreatePlotter (e, chart) {
    var obj = {}                      // Declare an empty object for adding methods in the following code, and finally return this object, that is, the constructed drawing object.

    obj.e = e                         // The reference to the exchange object passed by the parameter is assigned to a property of the obj object.
    obj.params = {}                   // Constructed parameters
    obj.params.EMA_param1 = 5         // We preset the parameters of some indicators on the chart to be used in the calculation of the indicator, for example, an EMA indicator line parameter.
    obj.params.EMA_param2 = 20        // The second EMA indicator line parameters, usually small parameters are called fast lines, large parameters are called slow lines.
    obj.params.MACD_fast = 12         // MACD parameter
    obj.params.MACD_slow = 26         // MACD parameter
    obj.params.MACD_sig = 9           // MACD parameter

    obj.runTime = {}                  // Used to store some data during runtime.
    obj.runTime.arrPreBarTime = [0, 0, 0]    // Store the timestamp of the previous bar of each K-line data for comparison.

    obj.GetAllRecords = function () {              // A method of the drawing object, used to get the K-line data, our example is used to display three charts at the same time, so, the function get three different periods of K-line data at the same time.
        obj.r = _C(obj.e.GetRecords, PERIOD_H1)    // The K-line data of the first chart, which is the 1-hour level K-line data.
        Sleep(1000)
        obj.r1 = _C(obj.e.GetRecords, PERIOD_M15)  // The K-line data of the second chart, which is the 15-minute level K-line data.
        Sleep(1000)
        obj.r2 = _C(obj.e.GetRecords, PERIOD_D1)   // The K-line data of the third chart, which is the daily level K-line data.
    }

    obj.Run = function () {                        // Execute the functions of drawing objects.
        obj.Plot()                                 // Execute the specific drawing code.
    }

    obj.CalcMACD = function (r, fast, slow, sig) {       // MACD indicator calculation function, return MACD indicator data.
        if (r.length <= Math.max(fast, slow, sig)) {
            return false
        }
        return TA.MACD(r, fast, slow, sig)
    }


    obj.Plot = function () {                   // Focus section with specific drawing code.
        obj.GetAllRecords()                    // Before each plot, update all K-line data first.
        var arr = [obj.r, obj.r1, obj.r2]      // Put all K-line data in an array and traverse it.
        var arrKIndex = [0, 1, 4]              // Indexing of K-line data series in chart objects.
        for (var i = 0; i < arr.length; i++) { // Traversal operations
            for (var j = 0; j < arr[i].length; j++) {
                if (arr[i][j].Time == obj.runTime.arrPreBarTime[i]) {    // When the last bar of the K-line data is not updated, we only update the data and do not add it. Note that when the chart.add function is called, the last parameter uses -1, which means that the data is updated and not added.
                    chart.add(arrKIndex[i], [arr[i][j].Time, arr[i][j].Open, arr[i][j].High, arr[i][j].Low, arr[i][j].Close], -1)

                   if (i == 1) {    // Update the EMA indicator data in the second chart.
                        var nowR = arr[i].slice(0, j + 1)
                        var ema1 = TA.EMA(nowR, obj.params.EMA_param1)
                        var ema2 = TA.EMA(nowR, obj.params.EMA_param2)
                        if (obj.r2.length <= obj.params.EMA_param1 || obj.r2.length <= obj.params.EMA_param2 || isNaN(ema1[j]) || isNaN(ema2[j])) {
                            continue
                        }

                        chart.add(2, [arr[i][j].Time, ema1[ema1.length - 1]], -1)
                        chart.add(3, [arr[i][j].Time, ema2[ema2.length - 1]], -1)
                    } else if (i == 2) {     // Update the MACD indicator data in the third chart
                        var nowR = arr[i].slice(0, j + 1)
                        var macd = obj.CalcMACD(nowR, obj.params.MACD_fast, obj.params.MACD_slow, obj.params.MACD_sig)
                        if (!macd) {
                            continue
                        }

                        var dif = macd[0]
                        var dea = macd[1]
                        chart.add(5, [arr[i][j].Time, dif[dif.length - 1]], -1)
                        chart.add(6, [arr[i][j].Time, dea[dea.length - 1]], -1)
                    }
                } else if (arr[i][j].Time > obj.runTime.arrPreBarTime[i]) {   // When the last bar of the current K-line data is larger than the last bar timestamp recorded previously, it indicates that a new bar has been generated for the K-line. At this time, a new bar and a new indicator data point should be added.
                    obj.runTime.arrPreBarTime[i] = arr[i][j].Time             // Update the record of the last bar timestamp for the next comparison. If the next timestamp is the same, data will not be added unless a new bar is generated.
                    chart.add(arrKIndex[i], [arr[i][j].Time, arr[i][j].Open, arr[i][j].High, arr[i][j].Low, arr[i][j].Close])
                    if (i == 1) {
                        var nowR = arr[i].slice(0, j + 1)
                        var ema1 = TA.EMA(nowR, obj.params.EMA_param1)
                        var ema2 = TA.EMA(nowR, obj.params.EMA_param2)
                        if (nowR.length <= obj.params.EMA_param1 || nowR.length <= obj.params.EMA_param2 || isNaN(ema1[ema1.length - 1]) || isNaN(ema2[ema2.length - 1])) {
                            continue
                        }

                        chart.add(2, [arr[i][j].Time, ema1[ema1.length - 1]])
                        chart.add(3, [arr[i][j].Time, ema2[ema2.length - 1]])
                    } else if (i == 2) {
                        var nowR = arr[i].slice(0, j + 1)
                        var macd = obj.CalcMACD(nowR, obj.params.MACD_fast, obj.params.MACD_slow, obj.params.MACD_sig)
                        if (!macd) {
                            continue
                        }

                        var dif = macd[0]
                        var dea = macd[1]
                        chart.add(5, [arr[i][j].Time, dif[dif.length - 1]])
                        chart.add(6, [arr[i][j].Time, dea[dea.length - 1]])
                    }
                }
            }
        }
    }
    obj.Plot()

    return obj
}

function main () {
    var chart = Chart([chart0, chart1, chart2])
    chart.reset()

    exchange.SetContractType("quarter")
    var plotter = CreatePlotter(exchange, chart)
    while (true) {
        plotter.Run()
        Sleep(1000)
    }
}
Chúng ta bắt đầu bằng cách nhìn vàomainchức năng:
function main () {                                  // Strategy entry function, of course, this strategy does not do anything, there are no transactions, just drawing charts.
    var chart = Chart([chart0, chart1, chart2])     // chart0, chart1, chart2 are pre-declared chart configuration objects, call the Chart function is to load the chart configuration, return a chart control object chart.
    chart.reset()                                   // Call the reset method of the chart control object chart to reset the chart.

    exchange.SetContractType("quarter")             // The backtest configuration is OKX futures, so here to set the contract, the contract is set to quarter.
    var plotter = CreatePlotter(exchange, chart)    // Call the CreatePlotter function to generate the plotter object -- plotter.
    while (true) {
        plotter.Run()                               // Execute drawing object plotter member function Run to draw.
        Sleep(1000)                                 // The drawing object plotter is responsible for "how to draw", and the chart control object chart is responsible for specific drawing. The former is implemented by our code, and the latter is the control object returned by the underlying API function of the system.
    }
}
Tiếp theo, chúng ta có thể thấy cáchCreatePlotterfunction thực hiện chức năng vẽ khi xây dựng đối tượng vẽ.var plotter=CreatePlotter(exchange, chart), khi xây dựng một đồ họa đồ vật vẽ, trao đổi và biểu đồ được truyền vào. Đầu tiên được sử dụng để lấy dữ liệu đường K (bằng cách gọi exchange.GetRecords), và sau đó được sử dụng để vận hành biểu đồ và thêm dữ liệu vào biểu đồ.
Phần quan trọng nhất của cốt truyện làPlotCác bình luận đã được viết trong mã.
Hoạt động kiểm tra ngược:
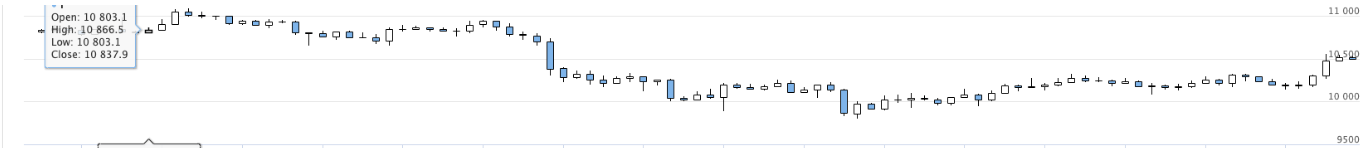
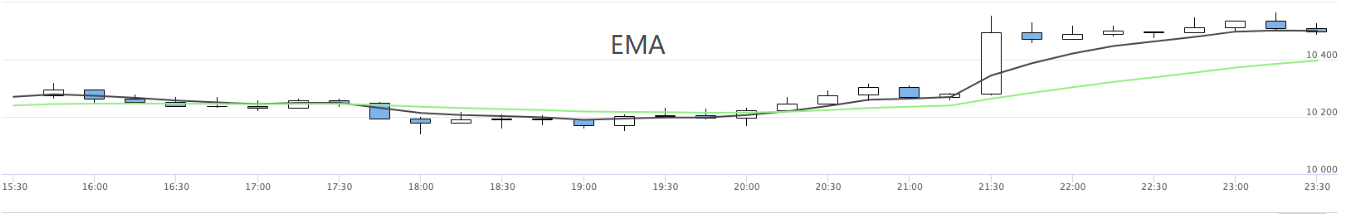
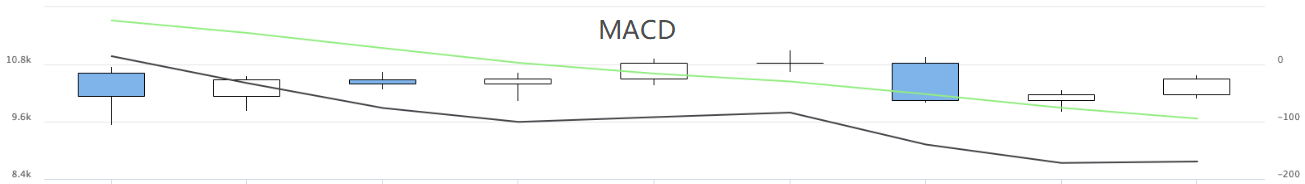
Bằng cách này, nhiều biểu đồ chiến lược có thể được hiển thị.
- Xác định số lượng phân tích cơ bản trong thị trường tiền điện tử: Hãy để dữ liệu nói cho chính nó!
- Các nghiên cứu định lượng cơ bản của vòng đồng tiền - đừng tin vào những giáo viên mờ nhạt, nói khách quan về dữ liệu!
- Một công cụ thiết yếu trong lĩnh vực giao dịch định lượng - nhà phát minh mô-đun khám phá dữ liệu định lượng
- Kiểm soát mọi thứ - giới thiệu về FMZ Phiên bản mới của Terminal giao dịch (với mã nguồn TRB Arbitrage)
- Có tất cả các thông tin về FMZ phiên bản mới của giao dịch đầu cuối (được thêm mã nguồn TRB)
- FMZ Quant: Phân tích các ví dụ thiết kế yêu cầu chung trong thị trường tiền điện tử (II)
- Làm thế nào để khai thác robot bán hàng không có não với một chiến lược tần số cao trong 80 dòng mã
- FMZ định lượng: Phân tích các trường hợp thiết kế nhu cầu phổ biến của thị trường tiền điện tử (II)
- Cách khai thác robot vô trí tuệ để bán bằng chiến lược tần số cao 80 dòng mã
- FMZ Quant: Phân tích các ví dụ thiết kế yêu cầu chung trong thị trường tiền điện tử (I)
- FMZ định lượng: Các nhu cầu phổ biến của thị trường tiền điện tử