Đường trung bình động thích nghi độ dốc
Tác giả:ChaoZhang, Ngày: 2022-05-31 18:07:34Tags:AMA
BÁO GIÁO
Kịch bản này lấy cảm hứng từ
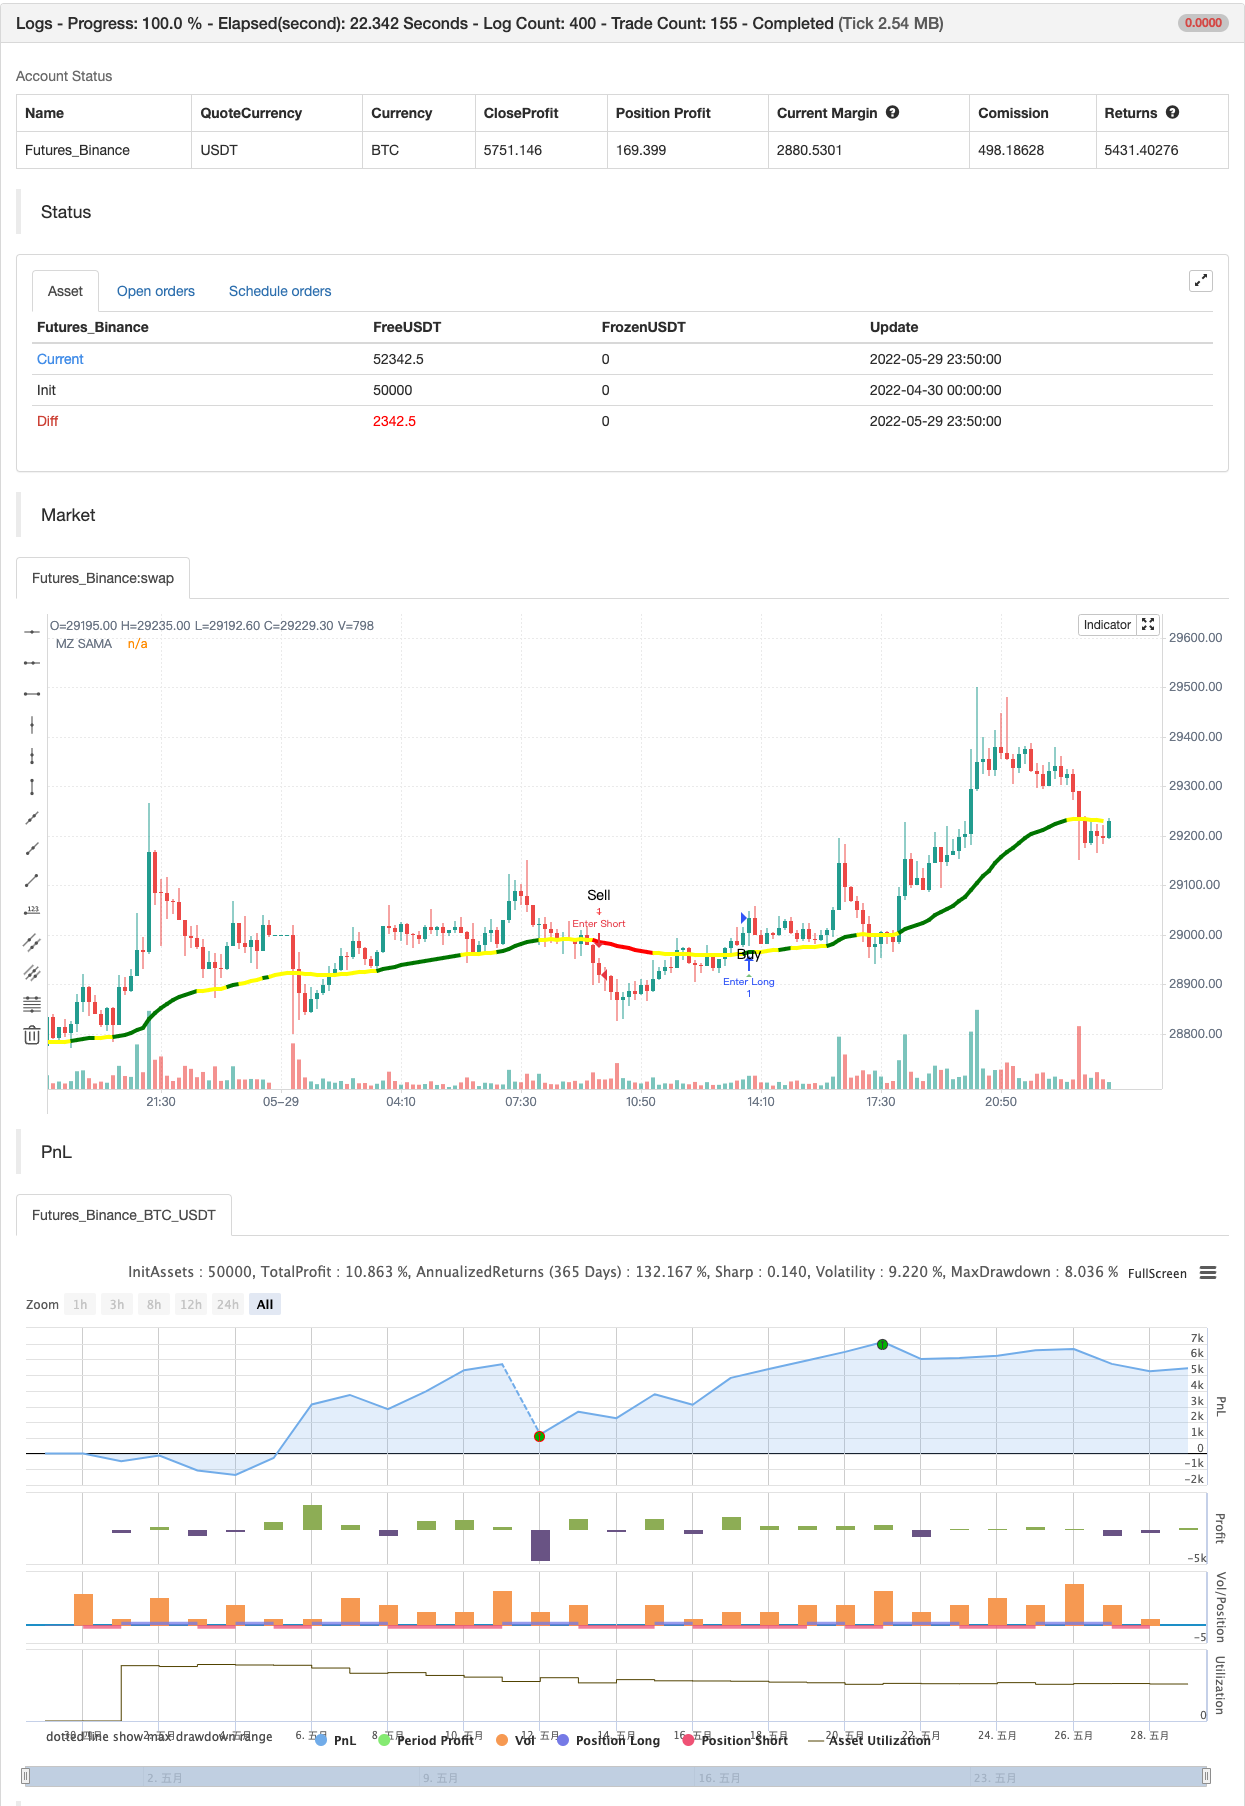
Phát hiện xu hướng Màu xanh: Xu hướng tăng mạnh với động lực giá tốt. Màu đỏ: Xu hướng giảm mạnh. Màu vàng: Thị trường là hoặc hỗn loạn, bên hoặc củng cố. tốt hơn để tránh có vị trí mới và nếu thương mại đang chạy sau đó nó tốt để tiếp tục nó.
Cài đặt mặc định Độ dài AMA là 200 (Tốt hơn cho các khung thời gian dài hơn 1H) Chiều dài nhỏ là 6 Chiều dài chính là 14 Thời gian dốc được thiết lập là 34 với 25 của phạm vi ban đầu. Cảnh báo Các thông báo mua / bán sẽ tiếp tục khi độ dốc ra khỏi khu vực hợp nhất / hỗn loạn.
backtest
/*backtest
start: 2022-04-30 00:00:00
end: 2022-05-29 23:59:00
period: 10m
basePeriod: 1m
exchanges: [{"eid":"Futures_Binance","currency":"BTC_USDT"}]
*/

// This source code is subject to the terms of the Mozilla Public License 2.0 at https://mozilla.org/MPL/2.0/
// © MightyZinger

//@version=5

indicator('Slope Adaptive Moving Average (MZ SAMA)', shorttitle='MZ SAMA', overlay=true)

/////////////////////////////////////////////////////////////////////
/////////////////////////////////////////////////////////////////////
/////                        MZ SAMA                           //////
/////////////////////////////////////////////////////////////////////
/////////////////////////////////////////////////////////////////////

chartResolution = input.timeframe('', title='Chart Resolution')
src = input.source(close, 'Source')

// Length Inputs
string grp_1 = 'SAMA Length Inputs'
length = input(200, title='Adaptive MA Length', group = grp_1) // To check for Highest and Lowest value within provided period
majLength = input(14, title='Major Length', group = grp_1)     // For Major alpha calculations to detect recent price changes
minLength = input(6, title='Minor Length', group = grp_1)      // For Minor alpha calculations to detect recent price changes

// Slope Inputs
string grp_2 = 'Slope and Dynamic Coloring Parameters'
slopePeriod = input.int(34, title='Slope Period', group = grp_2)
slopeInRange = input.int(25, title='Slope Initial Range', group = grp_2)
flat = input.int(17, title='Consolidation area is when slope below:', group = grp_2)
bull_col = input.color(color.green, 'Bull Color  ', inline='dyn_col', group = grp_2)
bear_col = input.color(color.red, 'Bear Color  ', inline='dyn_col', group = grp_2)
conc_col = input.color(color.yellow, 'Reversal/Consolidation/Choppiness Color  ', inline='dyn_col', group = grp_2)

showSignals = input.bool(true, title='Show Signals on Chart', group='Plot Parameters')

//Slope calculation Function to check trend strength i.e. consolidating, choppy, or near reversal

calcslope(_ma, src, slope_period, range_1) =>
    pi = math.atan(1) * 4
    highestHigh = ta.highest(slope_period)
    lowestLow = ta.lowest(slope_period)
    slope_range = range_1 / (highestHigh - lowestLow) * lowestLow
    dt = (_ma[2] - _ma) / src * slope_range
    c = math.sqrt(1 + dt * dt)
    xAngle = math.round(180 * math.acos(1 / c) / pi)
    maAngle = dt > 0 ? -xAngle : xAngle
    maAngle

//MA coloring function to mark market dynamics

dynColor(_flat, slp, col_1, col_2, col_r) =>
    var col = color.new(na,0)
    // Slope supporting bullish uprtrend color
    col := slp > _flat ? col_1:
    // Slope supporting bearish downtrend color
         slp <= -_flat ? col_2:
    // Reversal/Consolidation/Choppiness color
         slp <= _flat and slp > -_flat ? col_r : col_r
    col

//AMA Calculations

ama(src,length,minLength,majLength)=>
    minAlpha = 2 / (minLength + 1)
    majAlpha = 2 / (majLength + 1)

    hh = ta.highest(length + 1)
    ll = ta.lowest(length + 1)

    mult = hh - ll != 0 ? math.abs(2 * src - ll - hh) / (hh - ll) : 0
    final = mult * (minAlpha - majAlpha) + majAlpha

    final_alpha = math.pow(final, 2) 		// Final Alpha calculated from Minor and Major length along with considering Multiplication factor calculated using Highest / Lowest value within provided AMA overall length
    var _ama = float(na)
    _ama := (src - nz(_ama[1])) * final_alpha + nz(_ama[1])
    _ama

// SAMA Definition
sama = request.security(syminfo.tickerid, chartResolution, ama(src,length,minLength,majLength))

// Slope Calculation for Dynamic Coloring
slope = calcslope(sama, src, slopePeriod, slopeInRange)

// SAMA Dynamic Coloring from slope
sama_col = request.security(syminfo.tickerid, chartResolution, dynColor(flat, slope, bull_col, bear_col, conc_col))

// SAMA Plot
plot(sama, 'MZ SAMA', sama_col, 4)


// BUY & SELL CONDITIONS AND ALERTS
_up = sama_col == bull_col
_downn = sama_col == bear_col
_chop = sama_col == conc_col
buy  = _up and not _up[1]
sell = _downn and not _downn[1]
chop_zone = _chop and not _chop[1]

_signal() =>
    var sig = 0
    if buy and sig <= 0
        sig := 1
    if sell and sig >= 0
        sig := -1
    sig

sig = _signal()

longsignal  = sig ==  1 and (sig !=  1)[1]
shortsignal = sig == -1 and (sig != -1)[1]

// Plotting Signals on Chart
atrOver = 1 * ta.atr(5)   // Atr to place alert shape on chart
plotshape(showSignals and longsignal  ? (sama - atrOver) : na , style=shape.triangleup, color=color.new(color.green, 30), location=location.absolute, text='Buy', size=size.small)
plotshape(showSignals and shortsignal ? (sama + atrOver): na , style=shape.triangledown, color=color.new(color.red, 30), location=location.absolute, text='Sell', size=size.small)

// Signals Alerts
alertcondition(longsignal, "Buy",  "Go Long" )
alertcondition(shortsignal, "Sell", "Go Short")
alertcondition(chop_zone, "Chop Zone", "Possible Reversal/Consolidation/Choppiness")

if longsignal
    alert("Buy at" + str.tostring(close), alert.freq_once_per_bar_close)
if shortsignal
    alert("Sell at" + str.tostring(close), alert.freq_once_per_bar_close)


if longsignal
    strategy.entry("Enter Long", strategy.long)
else if shortsignal
    strategy.entry("Enter Short", strategy.short)
- Darvas Box mua bán
- Chỉ số thiết lập Demark
- Bollinger Bands Stochastic RSI cực
- Chỉ số AK MACD BB V 1.00
- SAR Parabolic
- Chỉ số RSI Divergence
- Chỉ số OBV MACD
- Xu hướng chuyển động
- Chiến lược chênh lệch giá v1.0
- Sự phá vỡ hỗ trợ-kháng cự
- Chiến lược dao động Delta-RSI
- Low Scanner chiến lược crypto
- [blackcat] L2 Reversal Label Chiến lược
- SuperB
- SAR cao thấp
- SuperTREX
- Máy phát hiện đỉnh
- Tìm thấp
- Xu hướng SMA
- Bollinger Lows