MACD Crossover Strategy

Overview
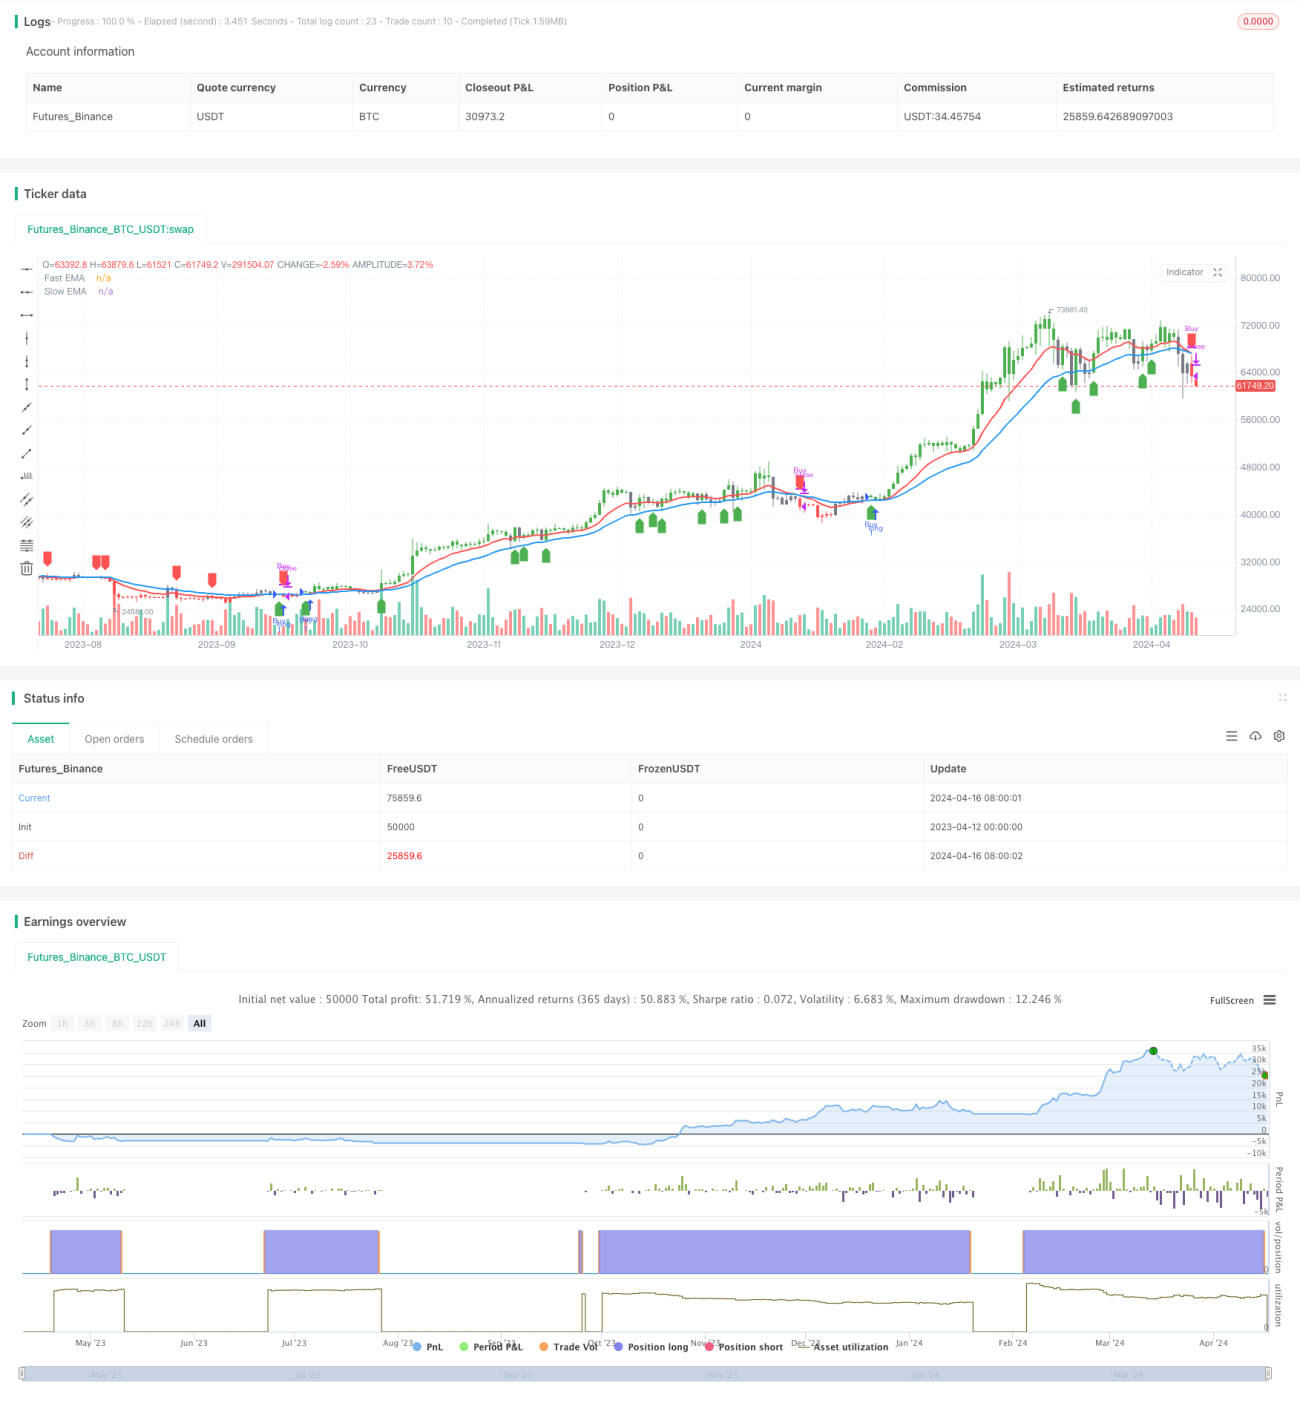
This strategy uses the crossover of two exponential moving averages (EMAs) with different periods to generate trading signals. When the fast EMA crosses above the slow EMA, it generates a buy signal, and when the fast EMA crosses below the slow EMA, it generates a sell signal. This strategy can be applied to various financial instruments and time frames, such as gold being most effective on the 2-hour time frame and Bitcoin being most effective on the daily chart, etc.
Strategy Principle
- Calculate the fast EMA (default period is 12) and the slow EMA (default period is 26).
- Define the bullish zone (fast EMA above slow EMA and price above fast EMA) and the bearish zone (fast EMA below slow EMA and price below fast EMA).
- Buy when transitioning from the bearish zone to the bullish zone, and sell when transitioning from the bullish zone to the bearish zone.
- Mark the bullish and bearish zones on the chart with green and red colors, and use arrows to mark the buy and sell signals.
Strategy Advantages
- Simple and easy to understand, suitable for beginners to learn.
- Widely applicable, can be used for various financial instruments and time frames.
- Strong trend-following ability, able to capture medium to long-term trends.
- Adjustable parameters, increasing flexibility.
Strategy Risks
- Prone to generating false signals in choppy markets, leading to losses.
- Slow to react at trend reversals, resulting in certain slippage.
- Improper parameter selection will affect the strategy's performance.
Strategy Optimization Directions
- Add trend filters, such as only trading when ADX is above a certain value, to reduce losses in choppy markets.
- Optimize entry and exit timing, such as using ATR to determine stop-loss and take-profit, reducing single trade losses.
- Optimize parameters to find the best combination, improving stability and profitability.
- Combine with other indicators for auxiliary judgment, such as MACD, RSI, etc., to improve signal accuracy.
Summary
The MACD crossover strategy is a simple strategy based on trend following. Its advantages are simplicity, practicality, and wide applicability, while its disadvantages are difficulty in grasping trend reversals and parameter selection. Through trend filtering, optimizing entry and exit points, parameter optimization, and combining other indicators, the performance of this strategy can be improved, which is worth further research and testing.
/*backtest
start: 2023-04-12 00:00:00
end: 2024-04-17 00:00:00
period: 1d
basePeriod: 1h
exchanges: [{"eid":"Futures_Binance","currency":"BTC_USDT"}]
*/

//@version=5
strategy('Advance EMA Crossover Strategy', overlay=true, precision=6)
//****************************************************************************//
// CDC Action Zone is based on a simple EMA crossover - 1