Multi-EMA Automated Trading System with Trailing Profit Lock

Overview
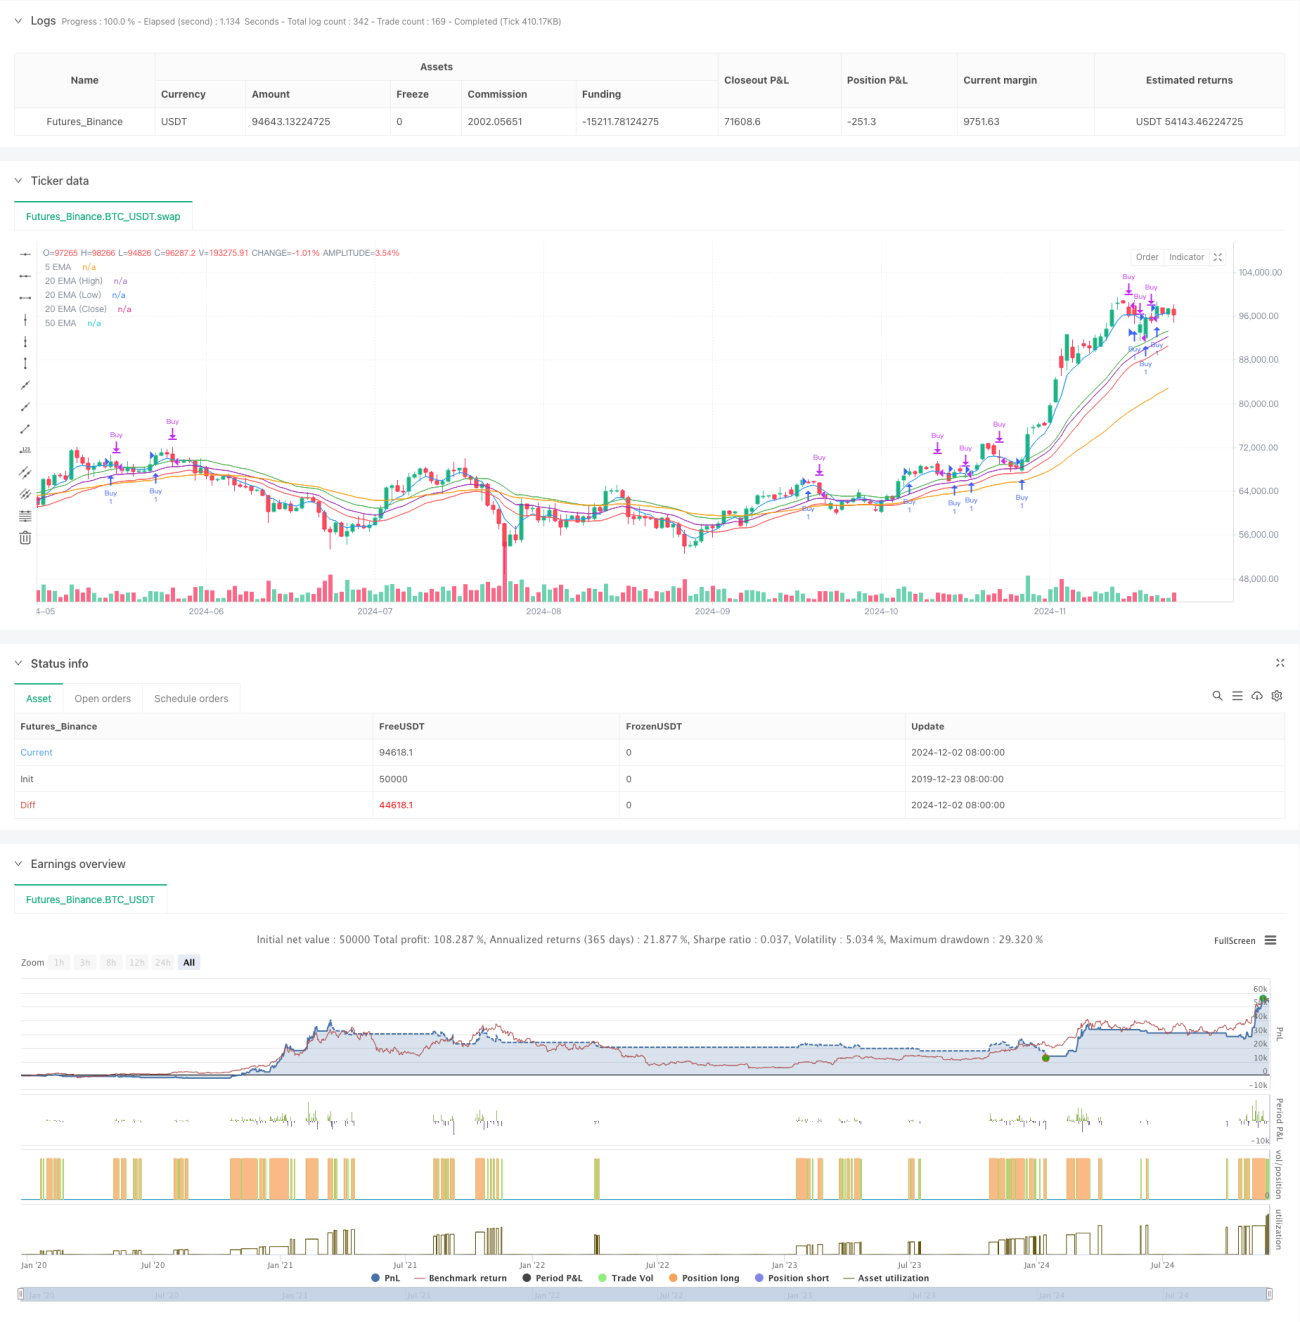
This strategy is an automated trading system based on multiple Exponential Moving Averages (EMAs), establishing trading signals through hierarchical analysis of 5-period, 20-period, and 50-period EMAs. The system's unique design incorporates multiple EMAs based on high, low, and closing prices, combined with dynamic stop-loss and trailing profit mechanisms to effectively control risk while securing profits.
Strategy Principles
The strategy bases trading decisions on multiple timeframe EMA crossovers and positional relationships. Specifically:
- Utilizes 5-period, 20-period (based on high, low, and closing prices), and 50-period EMAs
- Entry conditions require all indicators to show clear bullish alignment: 50EMA < 20EMA(Low) < 20EMA(Close) < 20EMA(High) < 5EMA
- Requires current price to be above all EMAs, confirming strong trend
- Exit uses dual mechanism: profit-taking when price breaks below 5-period EMA, or stop-loss when touching 20-period low EMA
Strategy Advantages
- Hierarchical filtering mechanism significantly reduces false signals
- Multiple EMA crossover confirmation improves trading accuracy
- Dynamic stop-loss positions adjust with market volatility
- Fully automated system eliminates emotional interference
- Trailing profit mechanism effectively locks in gained profits
Strategy Risks
- May result in frequent trades during sideways markets
- EMAs are inherently lagging indicators, might miss market initiation points
- Multiple conditions might cause missing some trading opportunities
- Stop-loss at 20EMA low point might be relatively loose
Optimization Directions
- Can add volume confirmation mechanism to improve signal reliability
- Consider incorporating volatility indicators for dynamic position sizing
- Introduce more flexible profit-taking schemes, such as partial position reduction
- Can combine with oscillators like RSI to optimize entry timing
- Consider adding trend strength judgment to filter weak markets
Summary
This is a rigorously designed multiple moving average trading system that effectively controls risk through hierarchical filtering and dynamic stop-loss. While it may miss some rapid market movements, it performs consistently in trending markets. It's recommended to adjust parameters according to different market characteristics and consider adding volume and other auxiliary indicators to improve reliability. This strategy is suitable for investors seeking stable returns in medium to long-term investments.
- 1