Multi-Indicator Combination Strategy (CCI, DMI, MACD, ADX)

Overview
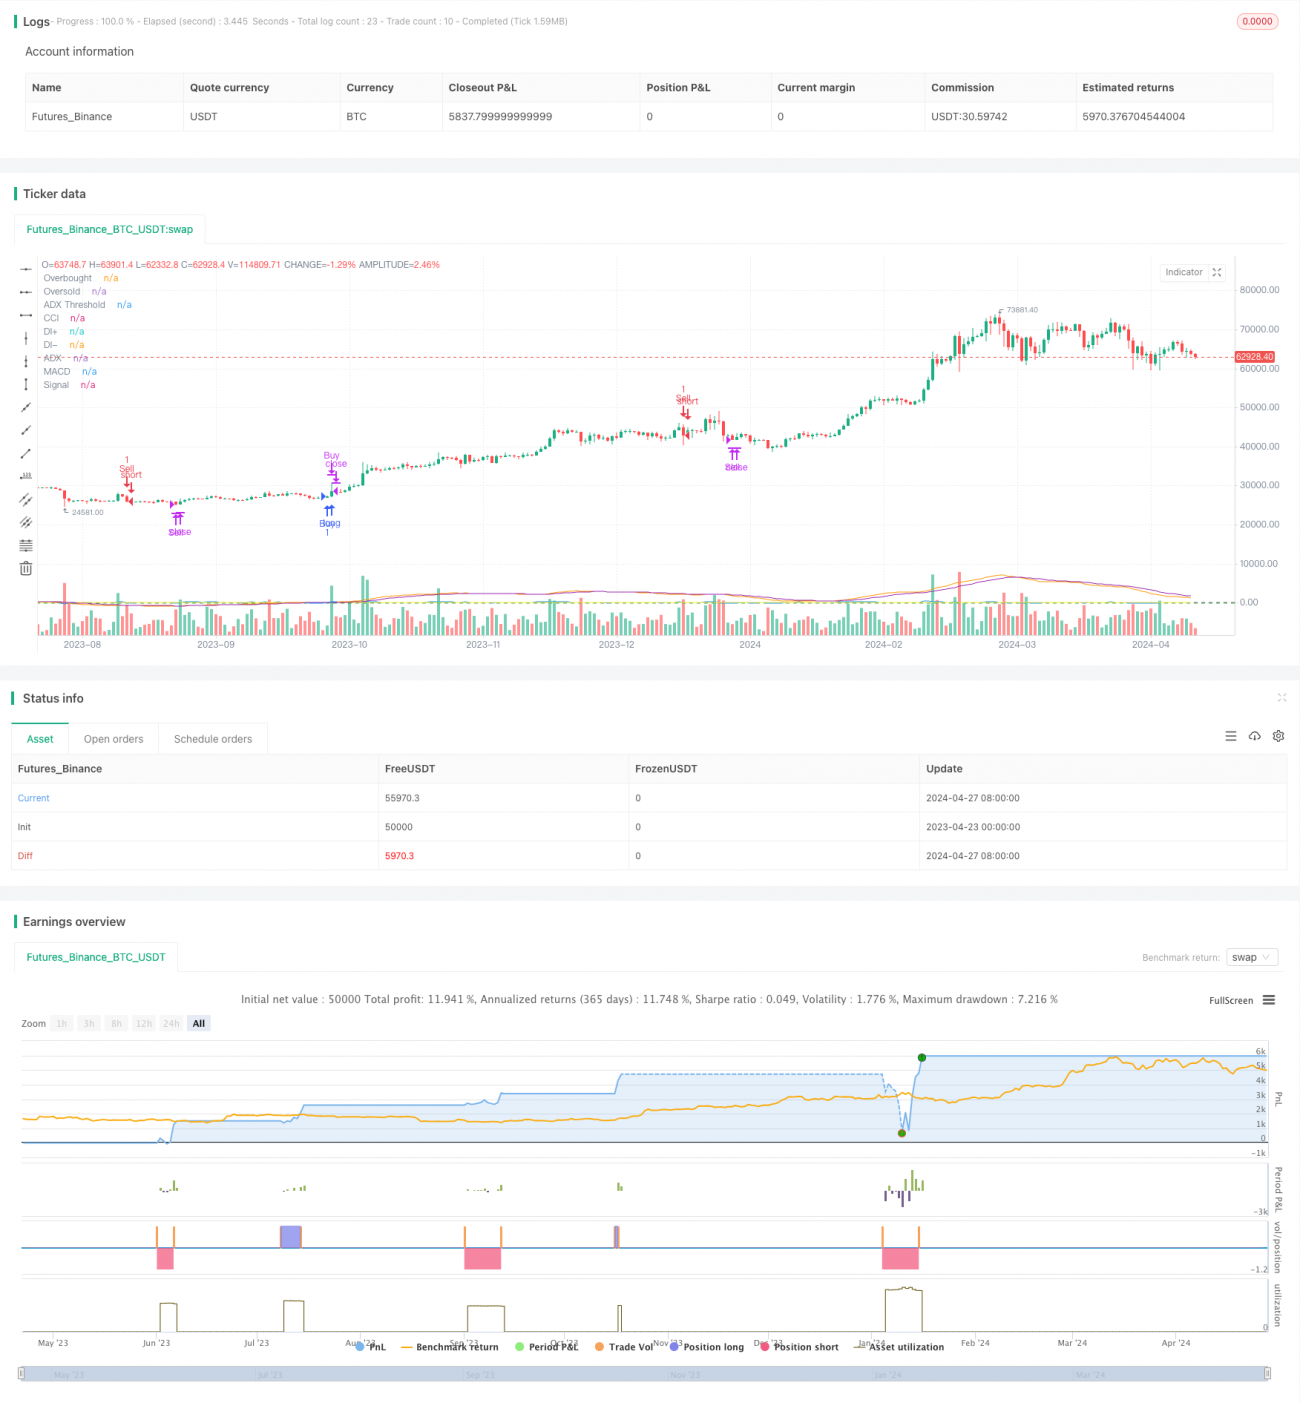
This strategy utilizes a combination of multiple technical indicators to generate trading signals. It combines the Commodity Channel Index (CCI), Directional Movement Index (DMI), Moving Average Convergence Divergence (MACD), and Average Directional Index (ADX) to determine buy and sell opportunities. When the combined conditions of CCI, DMI, MACD, and ADX are met, the strategy produces buy or sell signals. The strategy aims to capture market trends while considering momentum and volatility factors.
Strategy Principles
- The CCI indicator is used to determine overbought and oversold market conditions. When the CCI value crosses above the oversold level, it indicates a potential market reversal, and the strategy considers a buy signal. When the CCI value crosses below the overbought level, it suggests a potential market pullback, and the strategy considers a sell signal.
- The DMI indicator is used to determine the direction and strength of the market trend. When the +DI line is above the -DI line, it indicates an uptrend, while the opposite indicates a downtrend. The strategy uses the trend direction from DMI to determine the direction of trades.
- The MACD indicator is used to assess the trend and momentum of the market. When the MACD line is above the signal line, it indicates an uptrend, while the opposite indicates a downtrend. The strategy uses the relative positions of the MACD line and signal line to determine the timing of trades.
- The ADX indicator is used to gauge the strength of the market trend. When the ADX value is above a certain threshold (e.g., 20), it suggests a strong market trend, and the strategy is more inclined to follow the trend for trading.
- The strategy takes into account the signals from all four indicators and generates buy or sell signals when they collectively meet specific conditions. Buy conditions include the CCI crossing above the oversold level, +DI being above -DI, MACD line being above the signal line, and ADX being above the threshold. Sell conditions are the opposite.
Strategy Advantages
- Multi-indicator combination: The strategy utilizes multiple technical indicators, assessing market conditions from different perspectives, enhancing the reliability of trading signals.
- Trend tracking: Through indicators like DMI and MACD, the strategy effectively captures market trends and trades in the direction of the trend.
- Volatility consideration: The inclusion of the CCI indicator and ADX indicator allows the strategy to consider market volatility factors when determining trade timing, avoiding frequent trades in highly volatile markets.
- Risk management: The strategy sets clear entry and exit conditions, helping to control risk and manage positions.
Strategy Risks
- Parameter sensitivity: The performance of the strategy may be sensitive to indicator parameters, and different parameter settings may lead to different trading results. Optimization and testing of parameters are necessary to find the optimal combination for specific markets.
- Market adaptability: The strategy may underperform in certain market conditions, such as range-bound markets or trend reversal periods. Appropriate adjustments to the strategy are needed to adapt to different market environments.
- Slippage and trading costs: Frequent trading may result in higher slippage and trading costs, impacting the overall performance of the strategy. Optimizing trading frequency and controlling trading costs should be considered.
Strategy Optimization Directions
- Parameter optimization: Optimize the parameters of the indicators used in the strategy, such as the time periods for CCI and DMI, the fast and slow line periods for MACD, and the threshold for ADX, to find the optimal combination that improves the strategy's performance.
- Inclusion of additional indicators: Consider incorporating other technical indicators, such as the Relative Strength Index (RSI) or Stochastic Oscillator (KDJ), to further refine the conditions for generating trading signals and enhance the reliability of the strategy.
- Risk management optimization: Optimize the risk management aspects of the strategy, such as implementing stop-loss and take-profit mechanisms, dynamically adjusting position sizes, etc., to better control risks and protect account safety.
- Adaptability optimization: Adjust the buy and sell conditions of the strategy based on different market conditions, such as trending markets or range-bound markets, to improve the strategy's adaptability to various market environments.
Summary
This strategy combines multiple technical indicators, including CCI, DMI, MACD, and ADX, to generate buy and sell signals, aiming to capture market trends and seize trading opportunities. The strengths of the strategy lie in its multi-indicator combination, trend tracking, and volatility consideration. However, it also faces risks such as parameter sensitivity, market adaptability, and trading costs. Future improvements can be made through parameter optimization, inclusion of additional indicators, risk management optimization, and adaptability optimization, to enhance the stability and profitability of the strategy. Overall, this strategy provides a multi-dimensional approach to analyze the market for quantitative trading, but it still requires continuous optimization and refinement in practice.
- 1