资源加载中... loading...

Dynamic ATR Stop Loss and Take Profit Moving Average Crossover Strategy

Author: ChaoZhang, Date: 2024-05-29 17:19:21
Tags: SMAATRMA

img

Overview

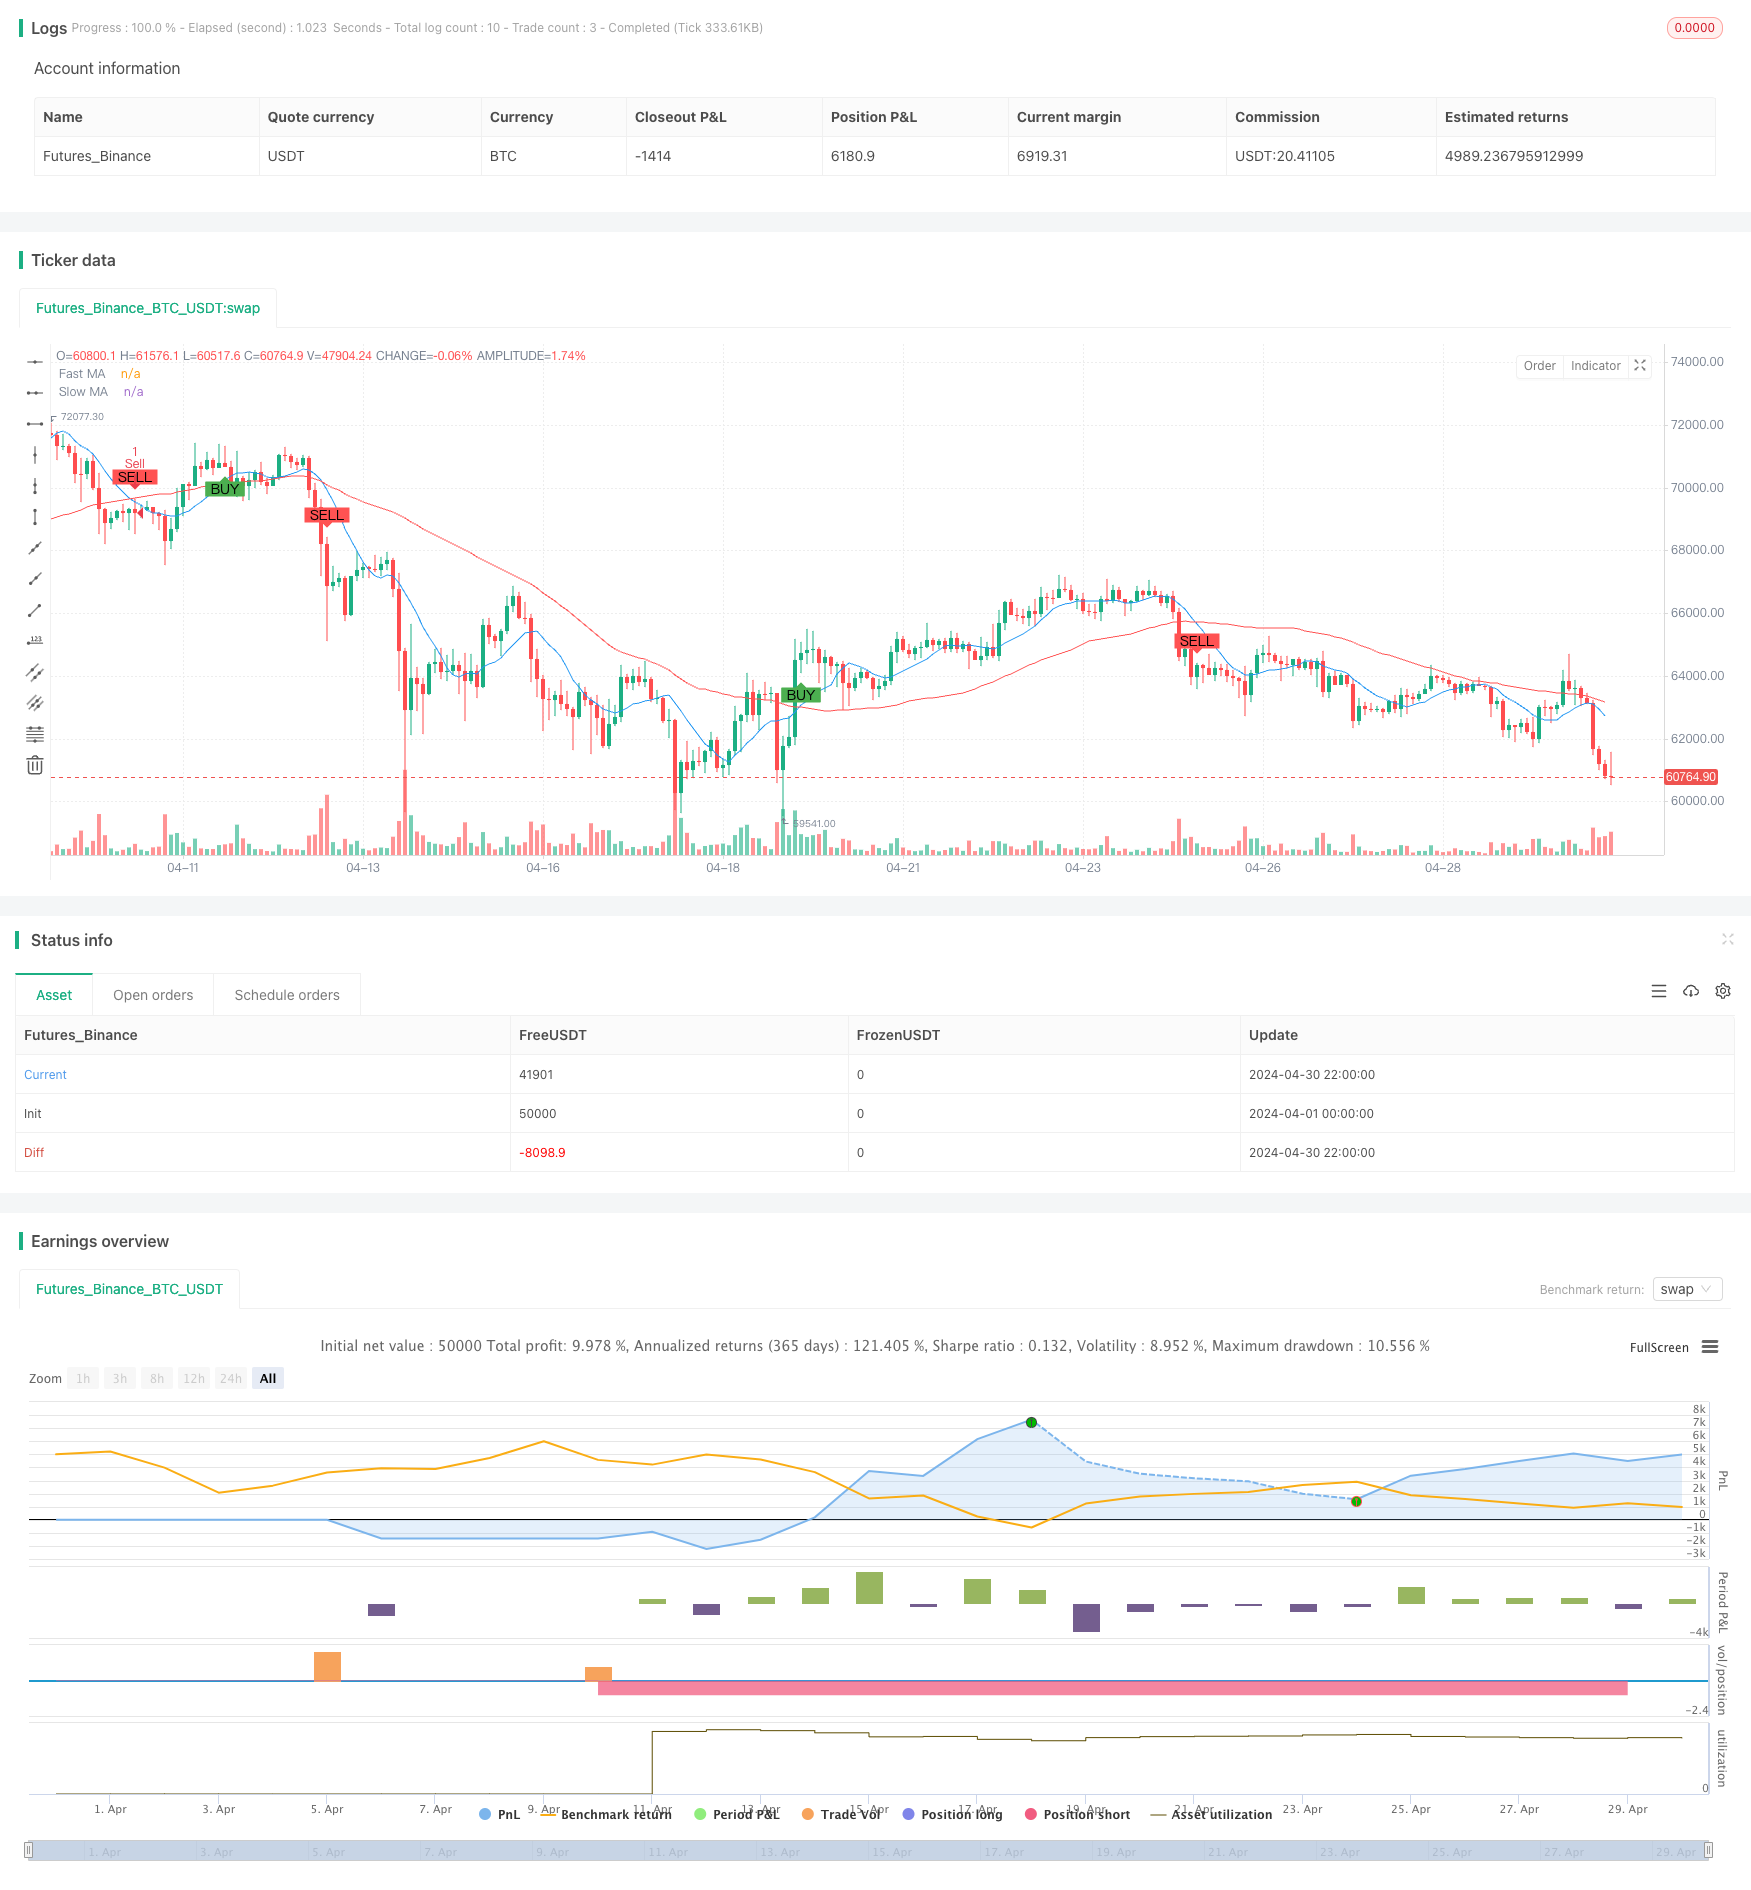
This strategy is a quantitative trading strategy based on moving average crossovers and dynamic ATR stop loss and take profit. The strategy uses two simple moving averages (SMAs) with different periods to generate trading signals while employing the Average True Range (ATR) to dynamically set stop loss and take profit levels for better risk control. Additionally, the strategy filters trading signals based on different trading sessions to improve its robustness.

Strategy Principles

The core principle of this strategy is to capture changes in price trends using moving average crossovers. When the fast moving average crosses above the slow moving average, a buy signal is generated; conversely, when the fast moving average crosses below the slow moving average, a sell signal is generated. Simultaneously, the strategy uses ATR to dynamically set stop loss and take profit levels. The take profit level is set at the entry price plus 3 times the ATR, while the stop loss level is set at the entry price minus 1.5 times the ATR. Furthermore, the strategy only generates trading signals during the European trading session to avoid trading during periods of low liquidity.

Strategy Advantages

  1. Simplicity: The strategy uses common technical indicators such as simple moving averages and ATR, making it easy to understand and implement.
  2. Dynamic risk control: By dynamically setting stop loss and take profit levels, the strategy can adaptively control risk based on market volatility.
  3. Time filtering: By limiting the trading session, the strategy can avoid trading during periods of low liquidity, enhancing its robustness.

Strategy Risks

  1. Parameter optimization risk: The strategy’s performance depends on the selection of moving average periods and the ATR calculation period. Different parameter settings may lead to significant differences in strategy performance, posing the risk of parameter optimization.
  2. Trend recognition risk: Moving average crossover strategies may generate numerous false signals in choppy markets, resulting in poor performance.
  3. Stop loss risk: Although the strategy sets dynamic stop loss levels, significant losses may still occur during severe market fluctuations.

Strategy Optimization Directions

  1. Signal filtering: Consider introducing other technical indicators or market sentiment indicators to further filter trading signals and improve signal quality.
  2. Dynamic parameter optimization: Utilize machine learning or adaptive algorithms to dynamically adjust strategy parameters to adapt to different market states.
  3. Risk management optimization: Incorporate more advanced risk management techniques, such as volatility adjustment and dynamic capital allocation, to further control strategy risk.

Summary

This strategy is a simple and easy-to-understand trend-following strategy that captures price trends using moving average crossovers while controlling risk with ATR. Although the strategy has certain risks, it can be further improved through parameter optimization, signal filtering, and risk management enhancements. For beginners, this strategy serves as an excellent learning and practice example.


/*backtest
start: 2024-04-01 00:00:00
end: 2024-04-30 23:59:59
period: 2h
basePeriod: 15m
exchanges: [{"eid":"Futures_Binance","currency":"BTC_USDT"}]
*/

//@version=5
strategy("Enhanced Moving Average Crossover Strategy", overlay=true)

// Input parameters
fastLength = input(10, title="Fast MA Length")
slowLength = input(50, title="Slow MA Length")
atrLength = input(14, title="ATR Length")
riskPerTrade = input(1, title="Risk Per Trade (%)") / 100

// Time-based conditions
isLondonSession = hour >= 8 and hour <= 15
isAsianSession = hour >= 0 and hour <= 7
isEuropeanSession = hour >= 7 and hour <= 14

// Moving Averages
fastMA = ta.sma(close, fastLength)
slowMA = ta.sma(close, slowLength)

// Average True Range (ATR) for dynamic stop loss and take profit
atr = ta.atr(atrLength)

// Buy and Sell Conditions
buySignal = ta.crossover(fastMA, slowMA)
sellSignal = ta.crossunder(fastMA, slowMA)

// Dynamic stop loss and take profit
stopLoss = close - atr * 1.5
takeProfit = close + atr * 3

// Strategy Logic
if (buySignal and isEuropeanSession)
    strategy.entry("Buy", strategy.long)
    strategy.exit("Take Profit/Stop Loss", "Buy", limit=takeProfit, stop=stopLoss)

if (sellSignal and isEuropeanSession)
    strategy.entry("Sell", strategy.short)
    strategy.exit("Take Profit/Stop Loss", "Sell", limit=takeProfit, stop=stopLoss)

// Plotting
plot(fastMA, color=color.blue, title="Fast MA")
plot(slowMA, color=color.red, title="Slow MA")
plotshape(series=buySignal, location=location.belowbar, color=color.green, style=shape.labelup, text="BUY")
plotshape(series=sellSignal, location=location.abovebar, color=color.red, style=shape.labeldown, text="SELL")

template: strategy.tpl:40:21: executing "strategy.tpl" at <.api.GetStrategyListByName>: wrong number of args for GetStrategyListByName: want 7 got 6