Trend-Following Cloud Momentum Divergence Strategy

Overview
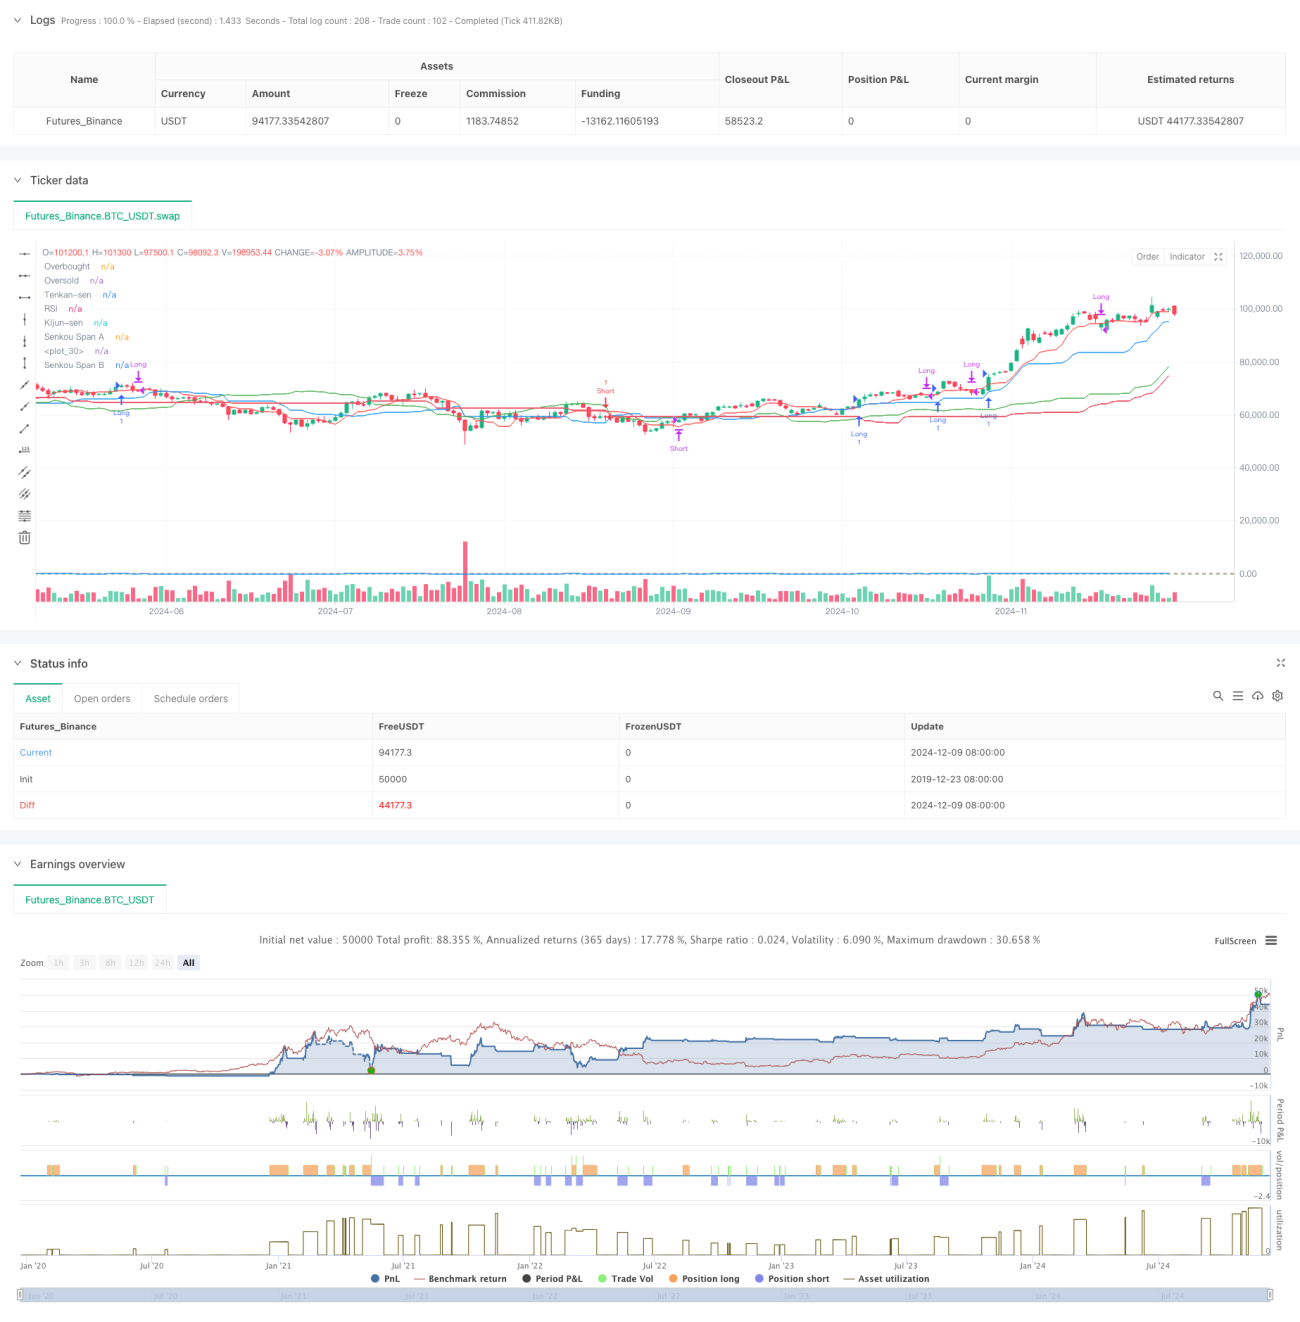
This strategy is a comprehensive trend-following trading system that integrates the Ichimoku Cloud, Relative Strength Index (RSI), and Moving Average Convergence Divergence (MACD). The strategy uses the cloud to determine overall trend direction, RSI to confirm price momentum, and MACD line crossovers to identify specific trading opportunities, enabling multi-dimensional market analysis and trading decisions.
Strategy Principles
The core logic is based on the synergy of three technical indicators:
- Ichimoku Cloud identifies trend environment, with bullish trends above the cloud and bearish trends below.
- RSI filters extreme conditions, requiring RSI above 30 for longs (non-oversold) and below 70 for shorts (non-overbought).
- MACD signal line crossovers trigger entries and exits, with bullish crossovers for longs and bearish crossovers for shorts.
Trading rules are as follows:
Long Entry Conditions:
- Price above the cloud
- RSI above 30
- MACD line crosses above signal line
Short Entry Conditions:
- Price below the cloud
- RSI below 70
- MACD line crosses below signal line
Strategy Advantages
- Multiple confirmation mechanism: Integration of three independent indicators reduces false signals.
- Strong trend following: Ichimoku Cloud ensures strategy operates in clear trends.
- Robust risk control: RSI filtering prevents entries in extreme overbought/oversold areas.
- Clear signals: MACD crossovers provide distinct entry and exit points.
- High adaptability: Strategy applicable across different market environments and instruments.
Strategy Risks
-
Trend reversal risk: Consecutive stops possible at trend turning points.
Suggestion: Increase trend confirmation timeframe requirements. -
Range-bound market risk: Frequent trades may occur in sideways markets.
Suggestion: Add signal filters, such as minimum movement requirements. -
Lag risk: Indicators have inherent lag, potentially missing optimal entry points.
Suggestion: Incorporate faster indicators or price action analysis. -
Parameter sensitivity: Incorrect parameter settings may lead to poor performance.
Suggestion: Optimize parameters through backtesting.
Optimization Directions
- Dynamic Parameter Adjustment:
- Automatically adjust cloud parameters based on volatility
- Dynamically adjust RSI thresholds based on market conditions
- Implement adaptive optimization for MACD parameters
- Enhanced Market Environment Filtering:
- Add volatility indicators to filter low volatility periods
- Incorporate volume confirmation
- Consider multiple timeframe information
- Improved Risk Management:
- Implement dynamic stop-loss strategy
- Add position sizing mechanism
- Design more flexible exit strategies
Summary
This strategy constructs a complete trend-following trading system by combining the Ichimoku Cloud, RSI, and MACD indicators. Its main strengths lie in its multiple confirmation mechanism and clear trading rules, while attention must be paid to risks at trend reversal points and in range-bound markets. Through dynamic parameter adjustment, market environment filtering, and risk management optimization, the strategy's stability and profitability can be further enhanced.
- 1