Dynamic Trend Momentum Optimization Strategy with G-Channel Indicator

Overview
This strategy is an advanced trend following trading system that integrates G-Channel, RSI, and MACD indicators. It identifies high-probability trading opportunities by dynamically calculating support and resistance zones while combining momentum indicators. The core lies in utilizing a custom G-Channel indicator to determine market trends while using RSI and MACD to confirm momentum changes for more accurate signal generation.
Strategy Principle
The strategy employs a triple-filtering mechanism to ensure signal reliability. First, the G-Channel dynamically constructs support and resistance zones by calculating maximum and minimum prices over a specified period. When prices break through the channel, the system identifies potential trend reversal points. Second, the RSI indicator confirms whether the market is in overbought or oversold conditions, helping to filter out more valuable trading opportunities. Finally, the MACD indicator confirms momentum direction and strength through histogram values. Trading signals are only generated when all three conditions are met.
Strategy Advantages
- Multi-dimensional signal confirmation mechanism significantly improves trading accuracy
- Dynamic stop-loss and take-profit settings effectively control risk
- G-Channel's adaptive nature allows the strategy to adapt to different market environments
- Comprehensive risk management system including position and money management
- Visual labeling system intuitively displays trading signals for analysis and optimization
Strategy Risks
- May generate false signals in choppy markets, requiring market environment identification
- Parameter optimization may lead to overfitting risk
- Multiple indicators may produce lag effects during high volatility periods
- Improper stop-loss placement may result in excessive drawdowns
Strategy Optimization Directions
- Introduce market environment identification module to use different parameter settings in different market states
- Develop adaptive stop-loss mechanism to dynamically adjust stop-loss levels based on market volatility
- Add volume analysis indicators to improve signal reliability
- Optimize G-Channel calculation method to reduce lag effects
Summary
This strategy builds a complete trading system through the comprehensive use of multiple technical indicators. Its core advantages lie in the multi-dimensional signal confirmation mechanism and comprehensive risk management system. Through continuous optimization and improvement, the strategy shows promise in maintaining stable performance across different market environments. Traders are advised to thoroughly test different parameter combinations and make appropriate adjustments based on specific market characteristics before live trading.
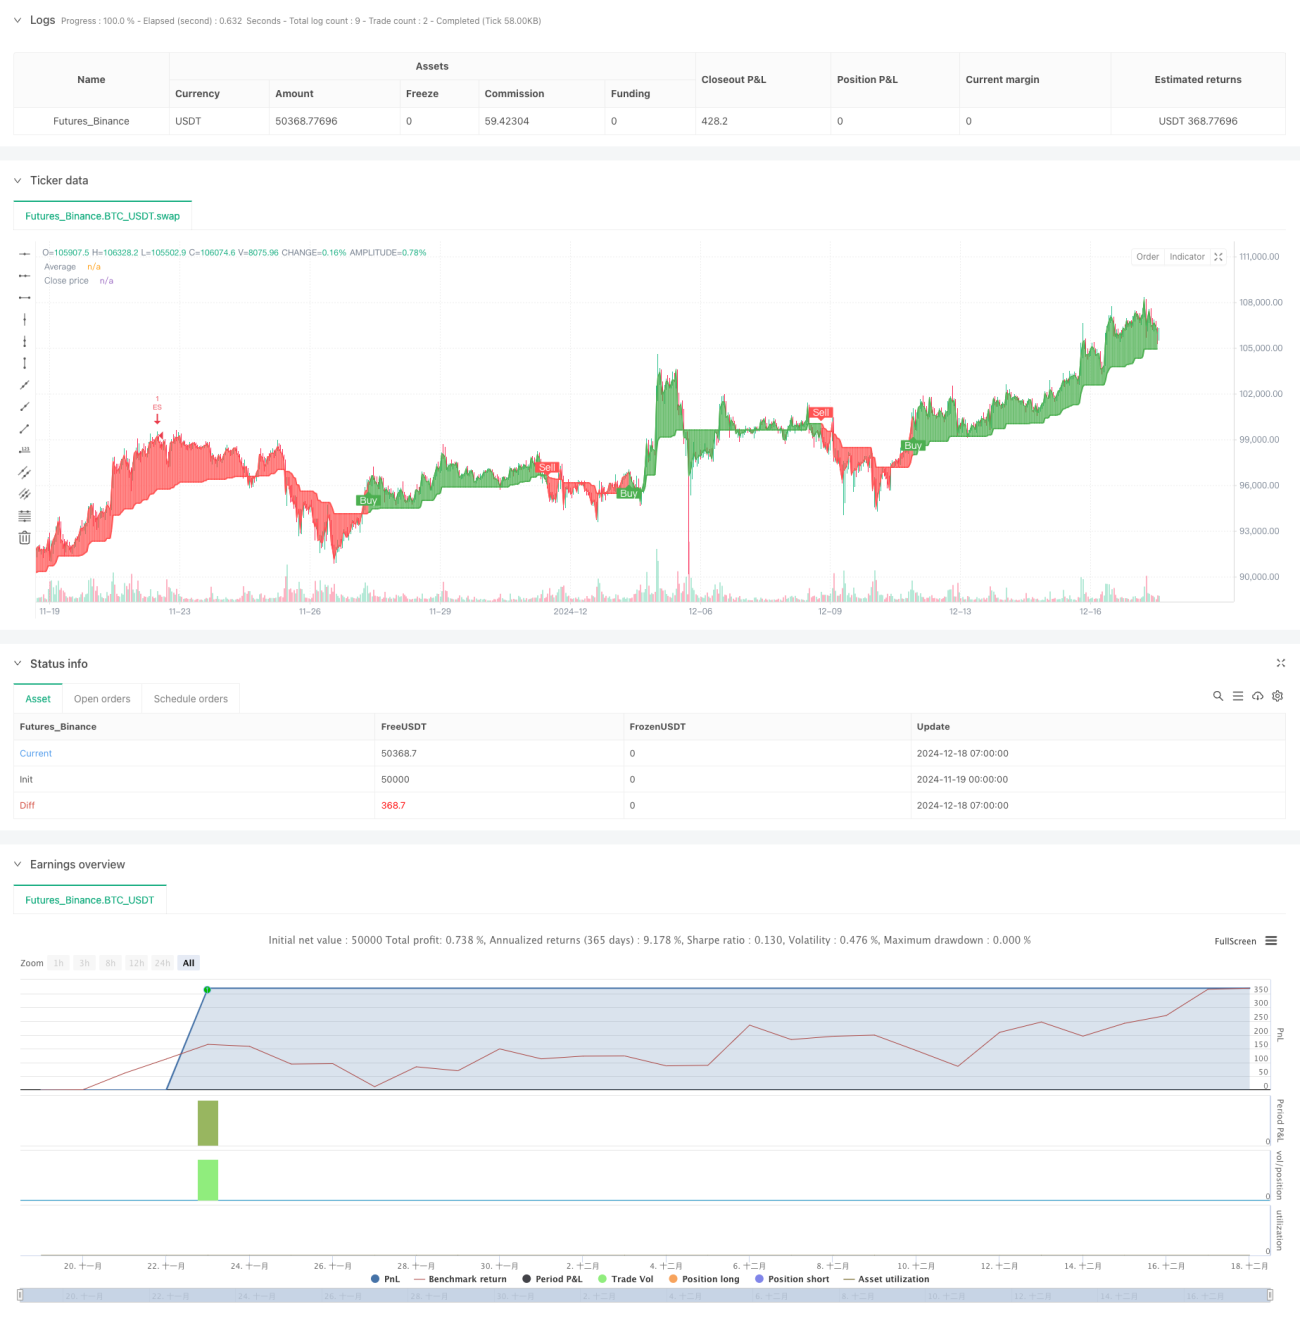
/*backtest
start: 2024-11-19 00:00:00
end: 2024-12-18 08:00:00
period: 1h
basePeriod: 1h
exchanges: [{"eid":"Futures_Binance","currency":"BTC_USDT"}]
*/

//@version=6
strategy("VinSpace Optimized Strategy", shorttitle="VinSpace Magic", overlay=true, default_qty_type=strategy.percent_of_equity, default_qty_value=10)

// Input Parameters- 1