Advanced Quantitative Trend Following and Cloud Reversal Composite Trading Strategy

Overview
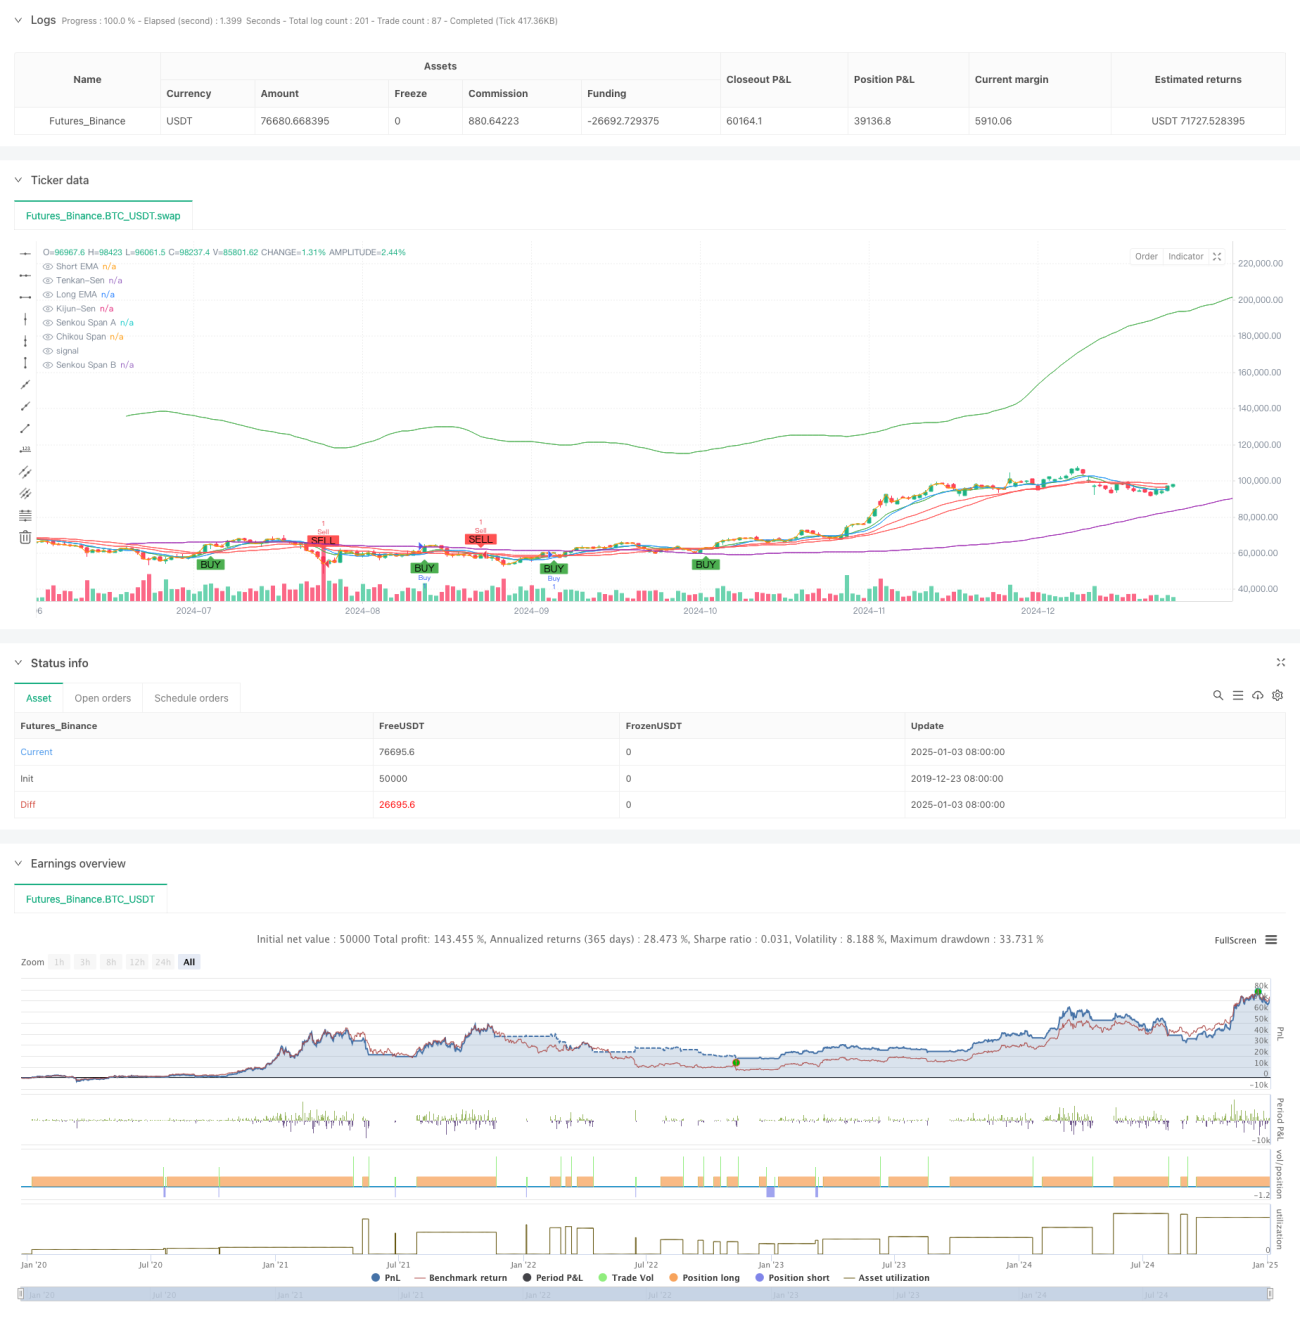
This strategy is a composite trading system combining Exponential Moving Average (EMA) crossover and Ichimoku Cloud. EMA crossover is primarily used to capture trend initiation signals and confirm buying opportunities, while the Ichimoku Cloud is used to identify market reversals and determine selling points. Through the coordination of multi-dimensional technical indicators, the strategy can effectively capture trends while timely avoiding risks.
Strategy Principle
The strategy operates through two core components:
- EMA Crossover Buy Signal: Uses the crossover of short-period (9-day) and long-period (21-day) exponential moving averages to confirm trend direction. A buy signal is generated when the short-term EMA crosses above the long-term EMA, indicating strengthening short-term momentum.
- Ichimoku Cloud Sell Signal: Determines trend reversals through price position relative to the cloud and internal cloud structure. Sell signals are triggered when price breaks below the cloud or when Leading Span A crosses below Leading Span B. The strategy includes stop-loss at 1.5% and take-profit at 3%.
Strategy Advantages
- Multi-dimensional Signal Confirmation: The combination of EMA crossover and Ichimoku Cloud validates trading signals from different perspectives.
- Comprehensive Risk Control: Fixed percentage stop-loss and profit targets effectively control risk for each trade.
- Strong Trend Capture Capability: EMA crossover captures trend initiation while Ichimoku Cloud effectively identifies trend endings.
- Clear and Objective Signals: Trading signals are automatically generated by technical indicators, reducing subjective judgment interference.
Strategy Risks
- Ranging Market Risk: May generate frequent false signals in sideways markets, leading to consecutive stops.
- Lag Risk: Both moving averages and Ichimoku Cloud have inherent lag, potentially missing optimal entry points in rapid market moves.
- Parameter Sensitivity: Strategy performance is sensitive to parameter settings, requiring adjustment in different market conditions.
Strategy Optimization
- Add Market Environment Filters: Include volatility or trend strength indicators to adjust strategy parameters based on market conditions.
- Optimize Stop-Loss Mechanism: Consider implementing dynamic stops, such as trailing stops or ATR-based stops.
- Enhance Signal Confirmation: Add volume and momentum indicators to improve signal reliability.
- Implement Position Sizing: Dynamically adjust position size based on signal strength and market volatility.
Summary
This strategy builds a trading system capable of both trend following and reversal capture through the organic combination of EMA crossover and Ichimoku Cloud. The strategy design is rational with proper risk control, showing good practical application value. Through the suggested optimization directions, there is room for further improvement. For live trading, it is recommended to first determine suitable parameter combinations through backtesting and make dynamic adjustments based on actual market conditions.
- 1