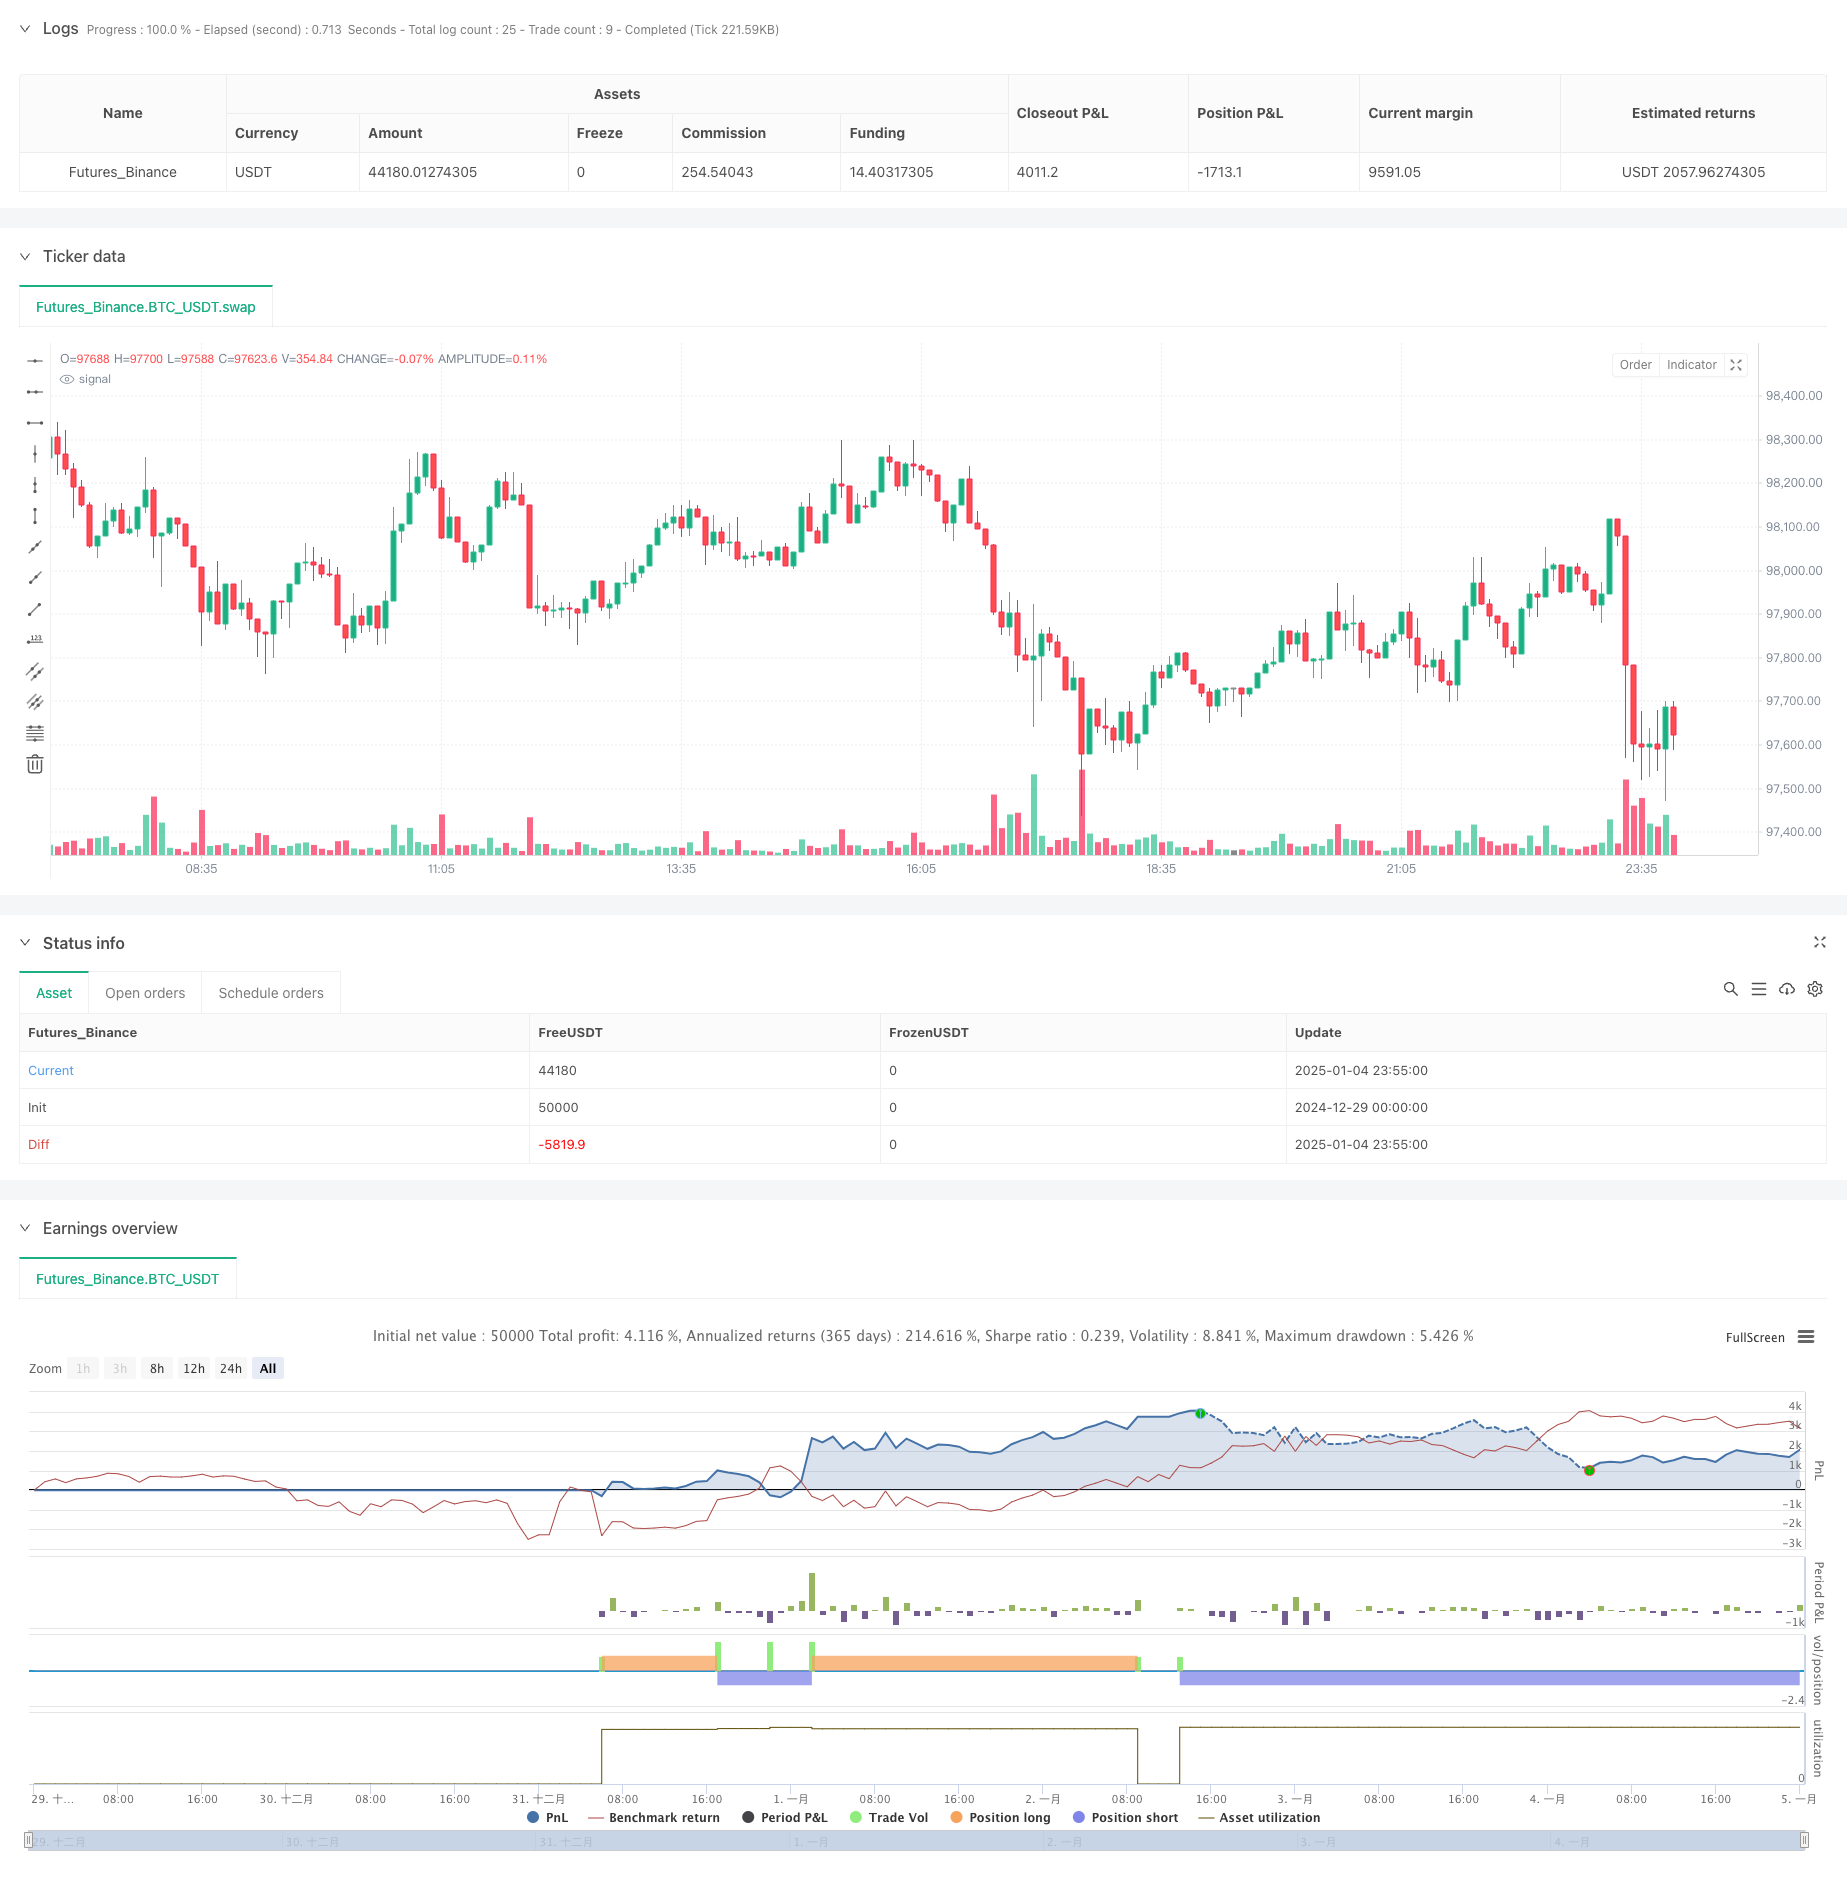
概述
该策略是一个基于RSI(相对强弱指标)和CCI(顺势指标)的双重技术分析交易系统。它通过结合这两个经典技术指标的超买超卖信号,配合风险回报比和固定止损的方式,构建了一个完整的交易决策框架。策略的核心在于通过双重指标的交叉确认来提高交易信号的可靠性,同时融入了完善的风险管理机制。
策略原理
策略主要基于以下几个核心原理运作: 1. 使用14周期的RSI指标和20周期的CCI指标作为信号生成的基础 2. 入场信号的触发条件: - 多头入场:RSI低于20(超卖)且CCI低于-200 - 空头入场:RSI高于80(超买)且CCI高于200 3. 风险管理设计: - 采用固定百分比止损(默认1%) - 基于风险回报比(默认2.0)自动计算止盈位置 4. 可视化系统: - 在图表上标注买卖信号点 - 绘制止损止盈参考线
策略优势
- 信号可靠性高:通过RSI和CCI的双重确认机制,能有效过滤虚假信号
- 风险控制完善:集成了固定止损和动态止盈的双重保护机制
- 参数灵活可调:主要指标参数均可根据不同市场特征进行优化
- 视觉反馈清晰:交易信号和风险管理位置直观显示
- 自动化程度高:从信号生成到仓位管理全程自动化执行
策略风险
- 信号滞后性:技术指标本质上具有一定滞后性,可能错过最佳入场点
- 震荡市不适用:在区间震荡市场中可能产生过多虚假信号
- 固定止损风险:统一的止损百分比可能不适合所有市场环境
- 参数依赖性:过度依赖预设参数可能导致在市场环境变化时表现失准 解决方案:
- 结合市场波动率动态调整参数
- 增加趋势过滤器减少震荡市虚假信号
- 引入自适应止损机制
策略优化方向
- 引入波动率指标:
- 使用ATR等指标动态调整止损距离
- 根据波动率调整RSI和CCI的触发阈值
- 增加趋势确认机制:
- 添加移动平均线作为趋势过滤器
- 引入趋势强度指标优化入场时机
- 完善风险管理:
- 实现动态风险回报比计算
- 增加部分止盈机制
- 优化信号生成:
- 添加成交量确认机制
- 引入价格结构分析
总结
这是一个将经典技术指标与现代风险管理理念相结合的完整交易系统。通过双重技术指标的确认机制提高了信号可靠性,配合严格的风险控制措施,形成了一个逻辑严密、实用性强的交易策略。虽然存在一定的局限性,但通过持续优化和完善,该策略具有良好的实战应用前景。继续在波动率感知、趋势确认和风险管理等方面进行优化,将进一步提升策略的稳定性和实用性。
策略源码
/*backtest
start: 2024-12-29 00:00:00
end: 2025-01-05 00:00:00
period: 5m
basePeriod: 5m
exchanges: [{"eid":"Futures_Binance","currency":"BTC_USDT"}]
*/

// TradingView Pine Script for RSI & CCI-Based Strategy
//@version=6
strategy("RSI & CCI Strategy", overlay=true)

// User Inputs
rsiLength = input.int(14, title="RSI Length")
rsiOverbought = input.int(80, title="RSI Overbought Level")
rsiOversold = input.int(20, title="RSI Oversold Level")

cciLength = input.int(20, title="CCI Length")
cciOverbought = input.int(200, title="CCI Overbought Level")
cciOversold = input.int(-200, title="CCI Oversold Level")

riskRewardRatio = input.float(2.0, title="Risk-Reward Ratio")
fixedStopLoss = input.float(1.0, title="Fixed Stop Loss (Percentage)", minval=0.1)

// RSI and CCI Calculations
rsi = ta.rsi(close, rsiLength)
cci = ta.cci(close, cciLength)

// Entry Conditions
longCondition = (rsi < rsiOversold) and (cci < cciOversold)
shortCondition = (rsi > rsiOverbought) and (cci > cciOverbought)

// Initialize variables for stop loss and take profit
var float longStopLoss = na
var float longTakeProfit = na
var float shortStopLoss = na
var float shortTakeProfit = na

// Plot Buy and Sell Signals
if (longCondition)
    label.new(bar_index, low, "BUY", style=label.style_label_up, color=color.green, textcolor=color.white)
    longEntryPrice = close
    longStopLoss := longEntryPrice * (1 - fixedStopLoss / 100)
    longTakeProfit := longEntryPrice + (longEntryPrice - longStopLoss) * riskRewardRatio
    // line.new(bar_index, longEntryPrice, bar_index, longStopLoss, color=color.red, width=1, extend=extend.none)
    // line.new(bar_index, longEntryPrice, bar_index, longTakeProfit, color=color.green, width=1, extend=extend.none)

if (shortCondition)
    label.new(bar_index, high, "SELL", style=label.style_label_down, color=color.red, textcolor=color.white)
    shortEntryPrice = close
    shortStopLoss := shortEntryPrice * (1 + fixedStopLoss / 100)
    shortTakeProfit := shortEntryPrice - (shortStopLoss - shortEntryPrice) * riskRewardRatio
    // line.new(bar_index, shortEntryPrice, bar_index, shortStopLoss, color=color.green, width=1, extend=extend.none)
    // line.new(bar_index, shortEntryPrice, bar_index, shortTakeProfit, color=color.red, width=1, extend=extend.none)

// Strategy Information and Alerts
if (longCondition)
    strategy.entry("Long", strategy.long)
    strategy.exit("Take Profit/Stop Loss", from_entry="Long", limit=longTakeProfit, stop=longStopLoss)

if (shortCondition)
    strategy.entry("Short", strategy.short)
    strategy.exit("Take Profit/Stop Loss", from_entry="Short", limit=shortTakeProfit, stop=shortStopLoss)
相关推荐