Multi-Timeframe Candlestick Pattern Trading Strategy

Overview
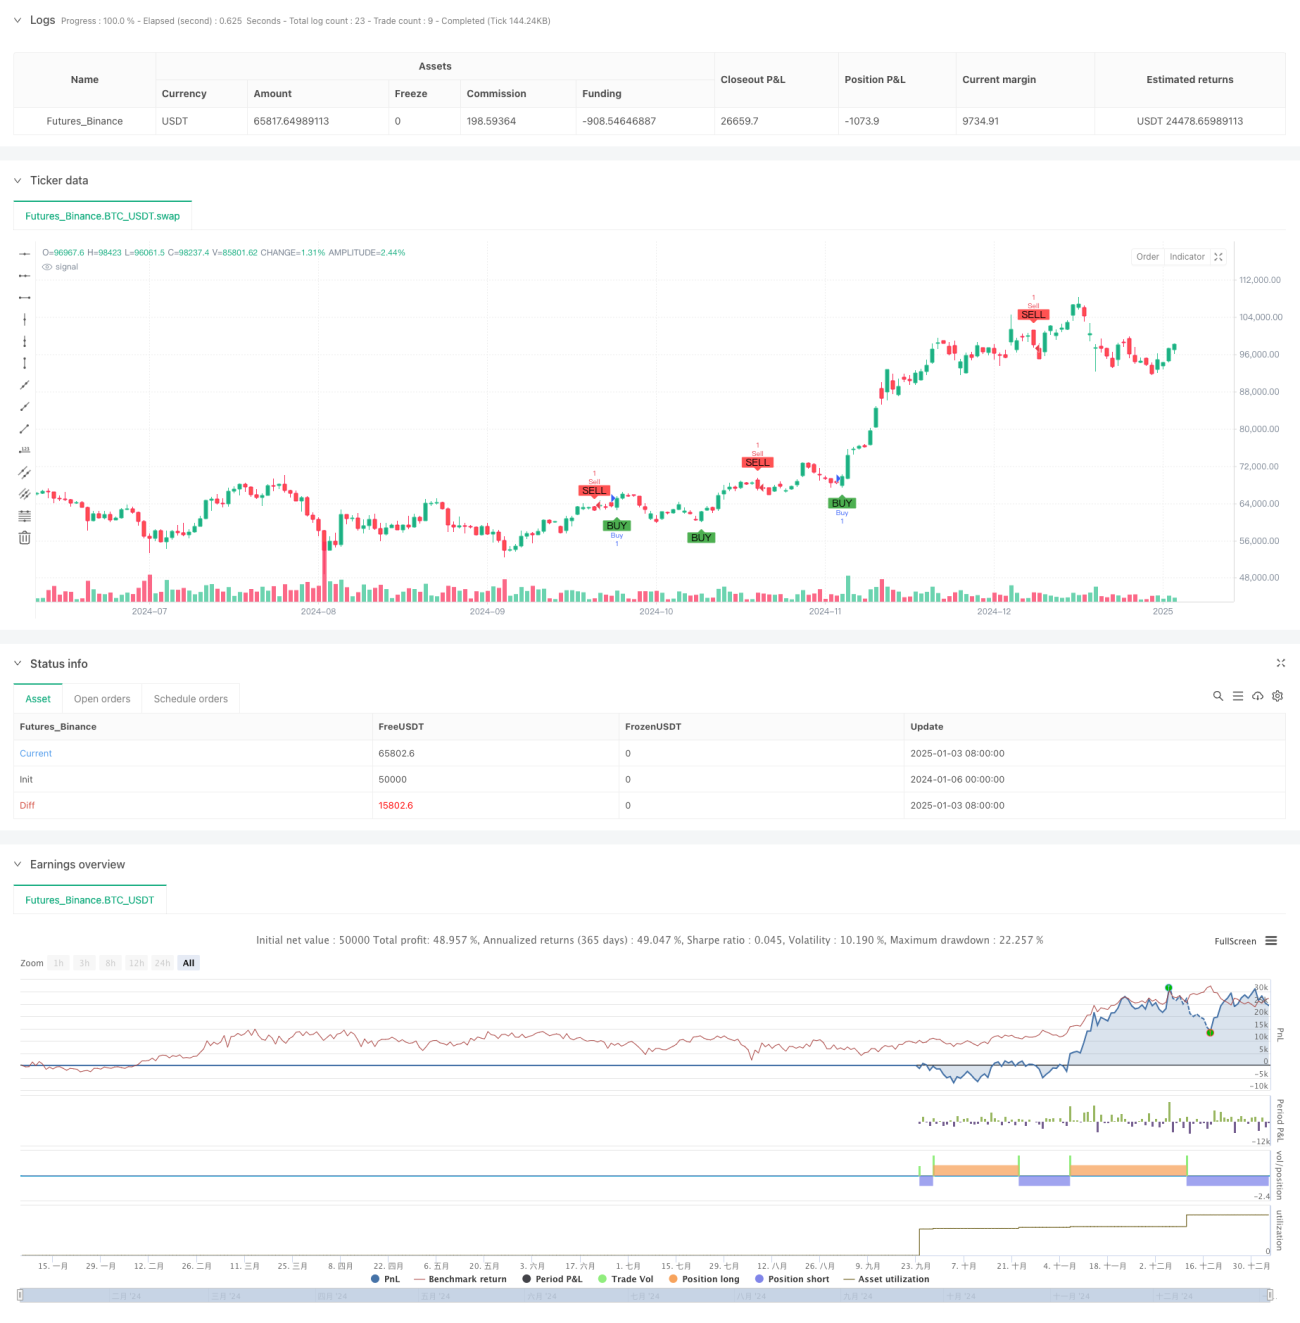
This is a multi-timeframe trading strategy based on candlestick pattern analysis, which generates trading signals by identifying bullish engulfing, bearish engulfing, and doji patterns. The strategy operates on daily timeframes, combining multiple technical indicators and pattern characteristics to identify market trend reversal points and optimal entry timing.
Strategy Principle
The core logic of the strategy is to programmatically identify three classic candlestick patterns:
- Bullish Engulfing: Previous candle is bearish, current candle is bullish and completely engulfs the previous candle
- Bearish Engulfing: Previous candle is bullish, current candle is bearish and completely engulfs the previous candle
- Doji Pattern: The difference between open and close prices is less than 10% of the current candle's body height
Buy signals are displayed below the candle when bullish engulfing patterns are identified; sell signals are displayed above the candle for bearish engulfing patterns; and doji patterns are marked at the candle top. The strategy implements signal annotation through the label.new() function and enhances signal visualization using the plotshape() function.
Strategy Advantages
- Clear Signals: Identifies candlestick patterns through strict mathematical definitions, avoiding subjective judgment
- Strong Visualization: Uses different colors and shapes to mark various signals, making them intuitive and easy to understand
- Controlled Risk: Based on mature technical analysis theory with a solid theoretical foundation
- Timely Notifications: Integrates trading signal alerts for automatic warnings
- Flexible Parameters: Supports customizable signal timeframes and color schemes
Strategy Risks
- Lag Risk: Pattern confirmation requires waiting for candle closure, potentially missing optimal entry points
- False Breakout Risk: Relying solely on candlestick patterns may trigger false signals
- Market Environment Risk: May generate excessive trading signals in choppy markets
- Parameter Sensitivity: Improper doji threshold settings can affect signal quality
Strategy Optimization Directions
- Incorporate Volume Indicators: Validate pattern effectiveness by combining volume changes
- Add Trend Filters: Include trend indicators like moving averages to filter counter-trend signals
- Optimize Signal Confirmation: Design multiple confirmation mechanisms to improve signal reliability
- Enhance Risk Control: Add stop-loss and take-profit functions, optimize money management
- Expand Pattern Library: Include recognition of more classic candlestick patterns
Summary
The strategy implements classic candlestick pattern analysis programmatically, offering good operability and extensibility. Through appropriate parameter settings and risk control, it can provide valuable reference for trading decisions. Future improvements can focus on adding more technical indicators and optimizing signal confirmation mechanisms to enhance strategy stability and reliability.
- 1