Dual-Period RSI Trend Momentum Strategy with Pyramiding Position Management System

Overview
This strategy is a trend-following trading system based on dual-period RSI (Relative Strength Index) combined with pyramiding position management. The strategy compares RSI indicators of two different periods (14 and 30) to enter trades at trend initiation and adds positions through limit orders during trend continuation, maximizing trend capture. The system includes comprehensive risk control mechanisms, including position management and dynamic exit conditions.
Strategy Principle
The strategy employs dual-period RSI crossover signals as trading triggers combined with pyramiding position management. Specifically:
- Entry signals: Uses 14-period RSI breakthrough of oversold (30) and overbought (70) levels as entry signals
- Position adding: Implements secondary position adding through limit orders set at 1.5% price deviation after initial entry
- Exit signals: Uses 30-period RSI as exit indicator, triggering closure when RSI falls from overbought or rebounds from oversold zones
- Position control: System allows maximum of two positions (pyramiding=2) with independently configurable entry quantities
Strategy Advantages
- Strong trend capture: Better identifies and tracks medium to long-term trends through dual-period RSI coordination
- Optimized risk-reward ratio: Uses pyramiding strategy to amplify returns after trend confirmation
- Flexible position management: Adjustable entry and additional position sizes based on market conditions and capital
- Dynamic stop-loss design: Uses long-period RSI as exit indicator to avoid premature exits
- Strong parameter adaptability: Key parameters can be optimized for different market characteristics
Strategy Risks
- Choppy market risk: May incur losses from frequent trading in range-bound markets
- Slippage risk: Additional position orders using limit orders may miss optimal entry timing in volatile markets
- Capital management risk: Double positions may lead to significant drawdowns
- Trend reversal risk: RSI indicator's inherent lag may delay stop-loss execution during trend reversals
- Parameter optimization risk: Over-optimization may lead to poor real-trading performance
Strategy Optimization Directions
- Introduce trend filters: Add moving averages or ADX indicators to improve entry signal reliability
- Optimize position management: Design dynamic position sizing system based on volatility
- Enhance stop-loss mechanism: Consider adding trailing stops or ATR-based stop-loss solutions
- Add market environment filters: Incorporate volatility indicators to adjust strategy parameters in different market conditions
- Improve position adding logic: Dynamically adjust position addition price deviation based on volatility
Summary
The strategy achieves effective trend capture through the combination of dual-period RSI and pyramiding positions. It implements a complete trading system including entry, position adding, stop-loss, and position management elements. Through parameter optimization and risk management improvements, the strategy shows promise for stable performance in actual trading. Traders are advised to thoroughly test and adjust parameters according to specific market characteristics before live implementation.
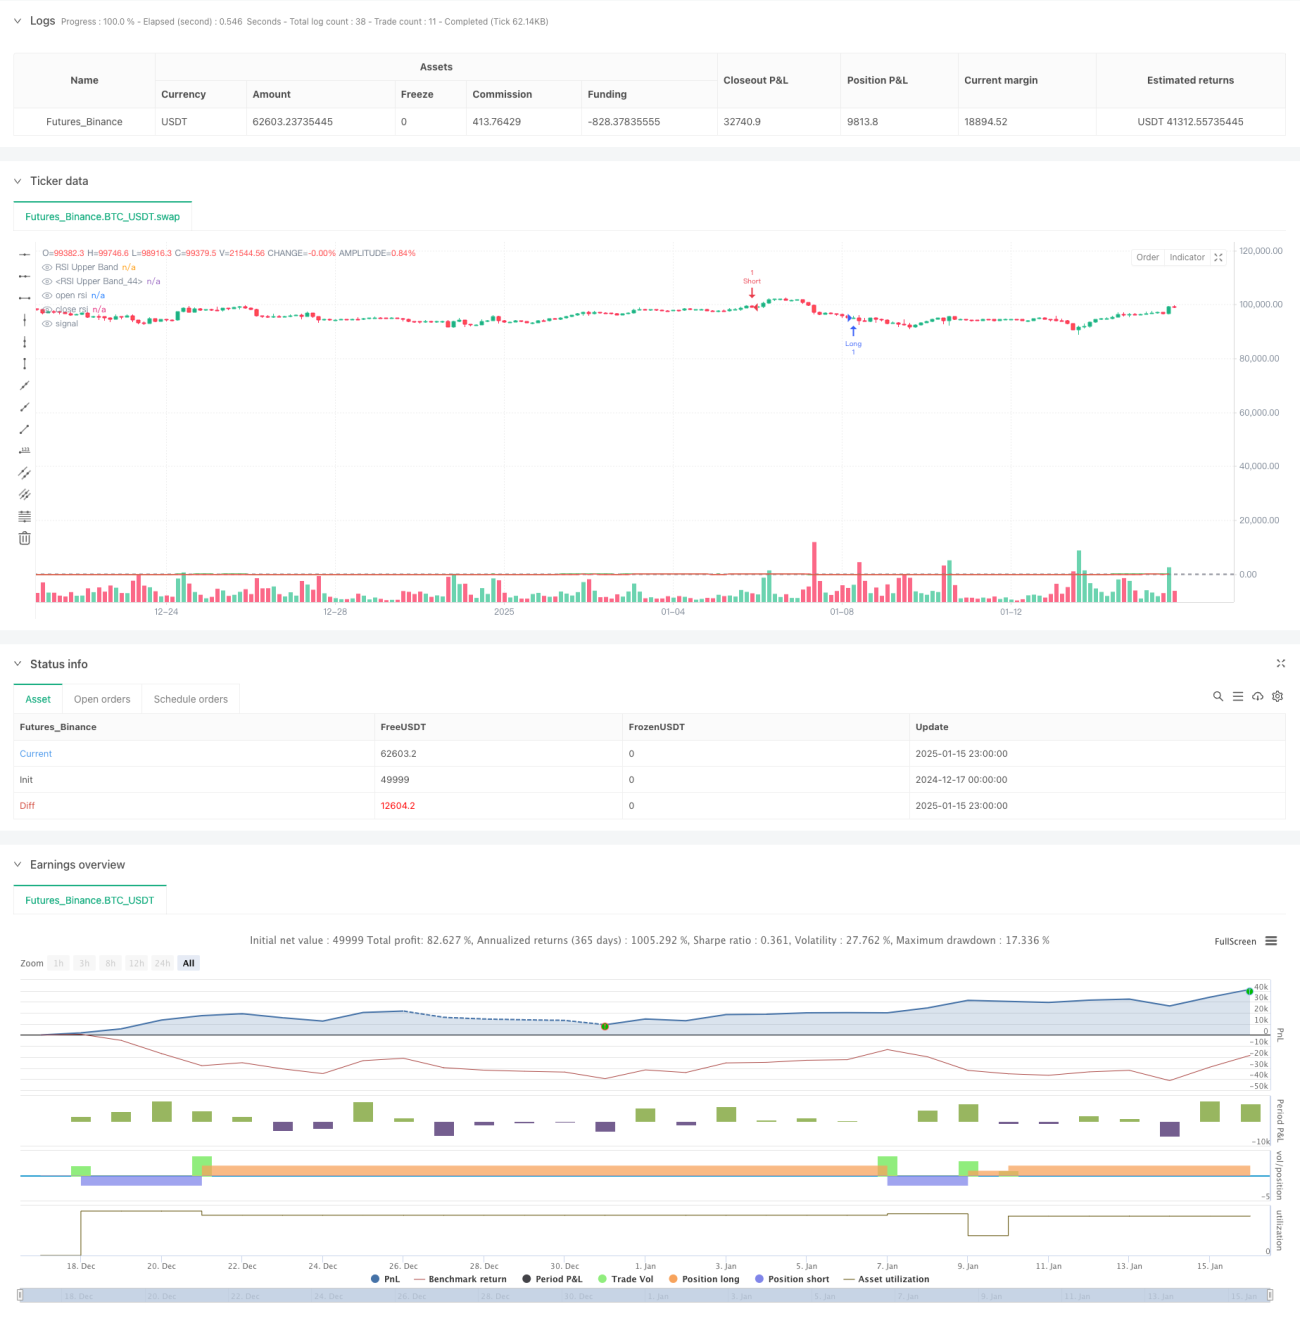
/*backtest
start: 2024-12-17 00:00:00
end: 2025-01-16 00:00:00
period: 3h
basePeriod: 3h
exchanges: [{"eid":"Futures_Binance","currency":"BTC_USDT","balance":49999}]
*/

//@version=5
strategy("RSI Top Strategy", overlay=true, pyramiding=2)

qty1 = input( 1 , "Qty first entry", group="Strategy settings")- 1