Multi-EMA Trend Following Strategy with Dynamic Volatility Filter

Overview
This strategy is an intelligent trading system that combines trend following with volatility filtering. It identifies market trends using Exponential Moving Averages (EMA), determines entry timing through True Range (TR) and dynamic volatility filters, and manages risk using a volatility-based dynamic stop-loss/take-profit mechanism. The strategy supports two trading modes: Scalp and Swing, which can be flexibly switched based on different market environments and trading styles.
Strategy Principles
The core logic includes the following key components:
- Trend Identification: Uses 50-period EMA as a trend filter, only taking long positions above EMA and short positions below EMA.
- Volatility Filtering: Calculates EMA of True Range (TR) and uses an adjustable filter coefficient (default 1.5) to filter market noise.
- Entry Conditions: Combines analysis of three consecutive candles, requiring price movement to show continuity and acceleration characteristics.
- Stop-Loss/Take-Profit: Set based on current TR in scalp mode and based on previous highs/lows in swing mode, achieving dynamic risk management.
Strategy Advantages
- Strong Adaptability: Adapts to different market environments through the combination of dynamic volatility filtering and trend following.
- Comprehensive Risk Management: Provides dynamic stop-loss/take-profit mechanisms for both trading modes, allowing flexible selection based on market characteristics.
- Good Parameter Adjustability: Key parameters such as filter coefficient and trend period can be optimized according to trading instrument characteristics.
- Excellent Visualization: Provides clear buy/sell signal markers and stop-loss/take-profit level displays for easy trade monitoring.
Strategy Risks
- Trend Reversal Risk: May experience consecutive stops at trend turning points.
- False Breakout Risk: May trigger false signals during sudden volatility increases.
- Parameter Sensitivity: Improper filter coefficient settings may lead to too many or too few signals.
- Slippage Impact: May face significant slippage in fast markets, affecting strategy performance.
Strategy Optimization Directions
- Add Trend Strength Filtering: Can introduce indicators like ADX to evaluate trend strength and improve trend following effectiveness.
- Optimize Stop-Loss/Take-Profit: Can consider introducing trailing stops to protect more profits.
- Improve Swing Mode: Can add more swing-trading-specific conditions to enhance medium to long-term holding capability.
- Add Volume Analysis: Combine volume changes to confirm breakout validity.
Summary
This strategy constructs a complete trading system by organically combining trend following, volatility filtering, and dynamic risk management. Its strengths lie in its adaptability, controllable risk, while providing significant optimization potential. Through proper parameter settings and appropriate trading mode selection, the strategy can maintain stable performance in different market environments. Traders are advised to conduct thorough backtesting and parameter optimization before live trading, and make appropriate adjustments based on specific trading instrument characteristics.
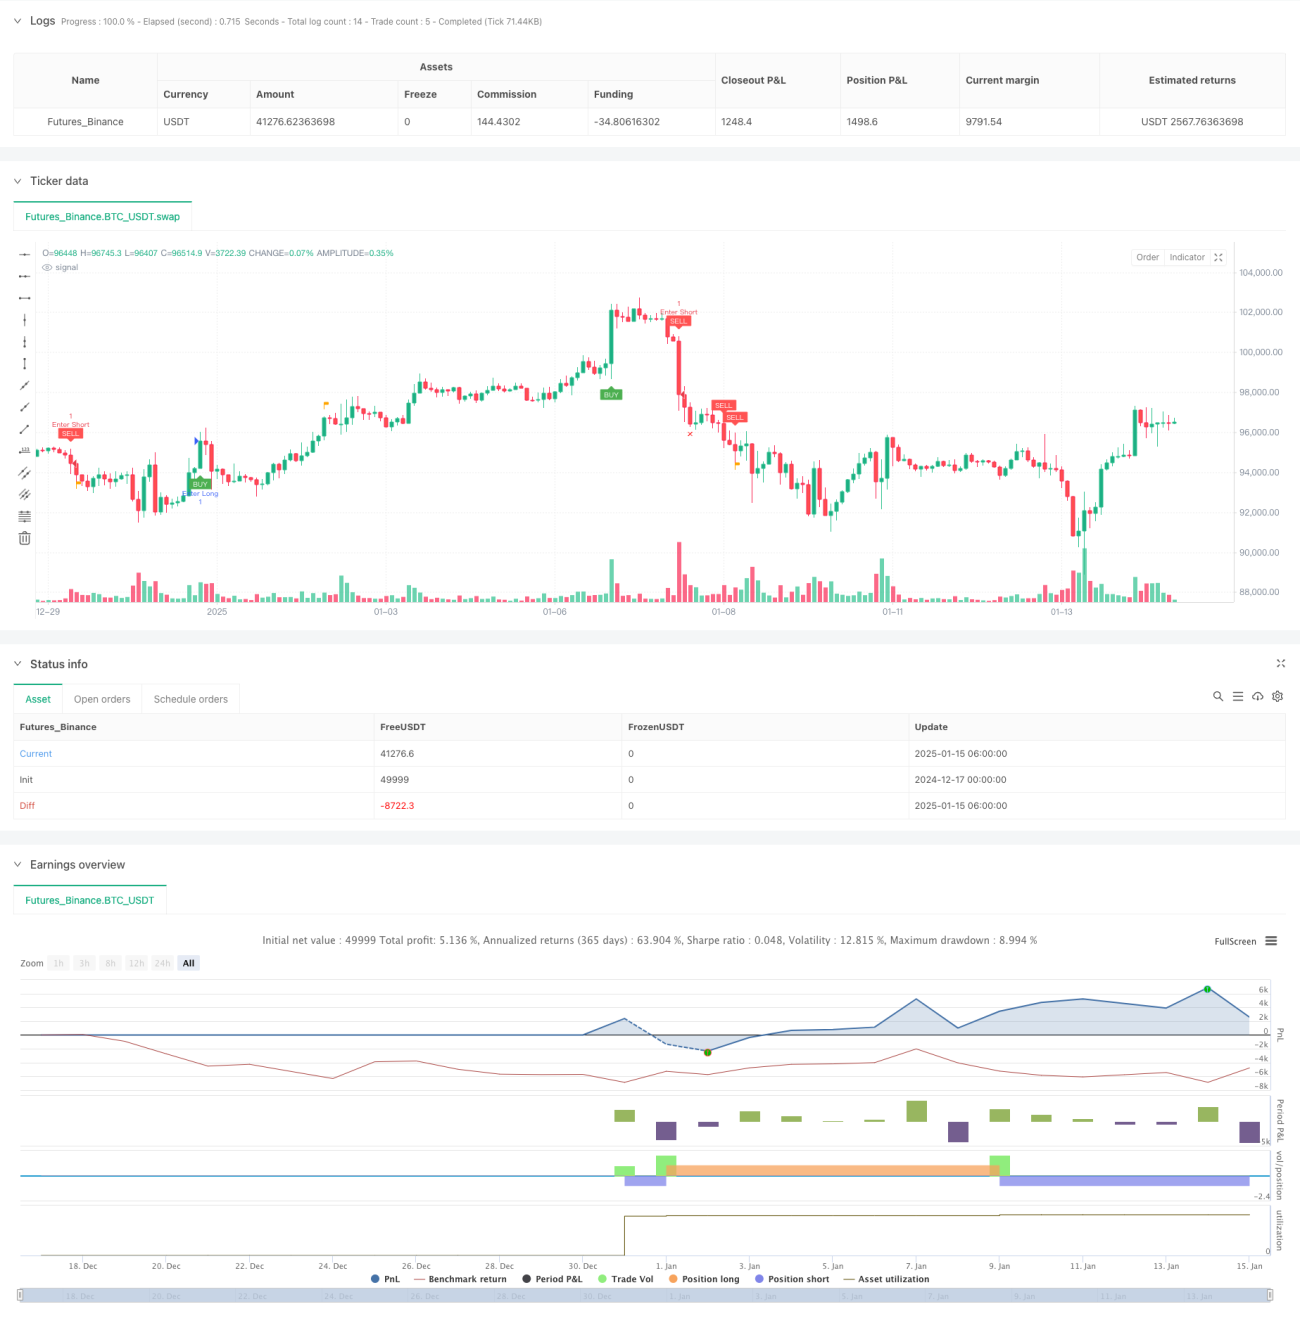
/*backtest
start: 2024-12-17 00:00:00
end: 2025-01-15 08:00:00
period: 2h
basePeriod: 2h
exchanges: [{"eid":"Futures_Binance","currency":"BTC_USDT","balance":49999}]
*/

// This Pine Script™ code is subject to the terms of the Mozilla Public License 2.0 at https://mozilla.org/MPL/2.0/
// © Creativ3mindz

//@version=5- 1