概述
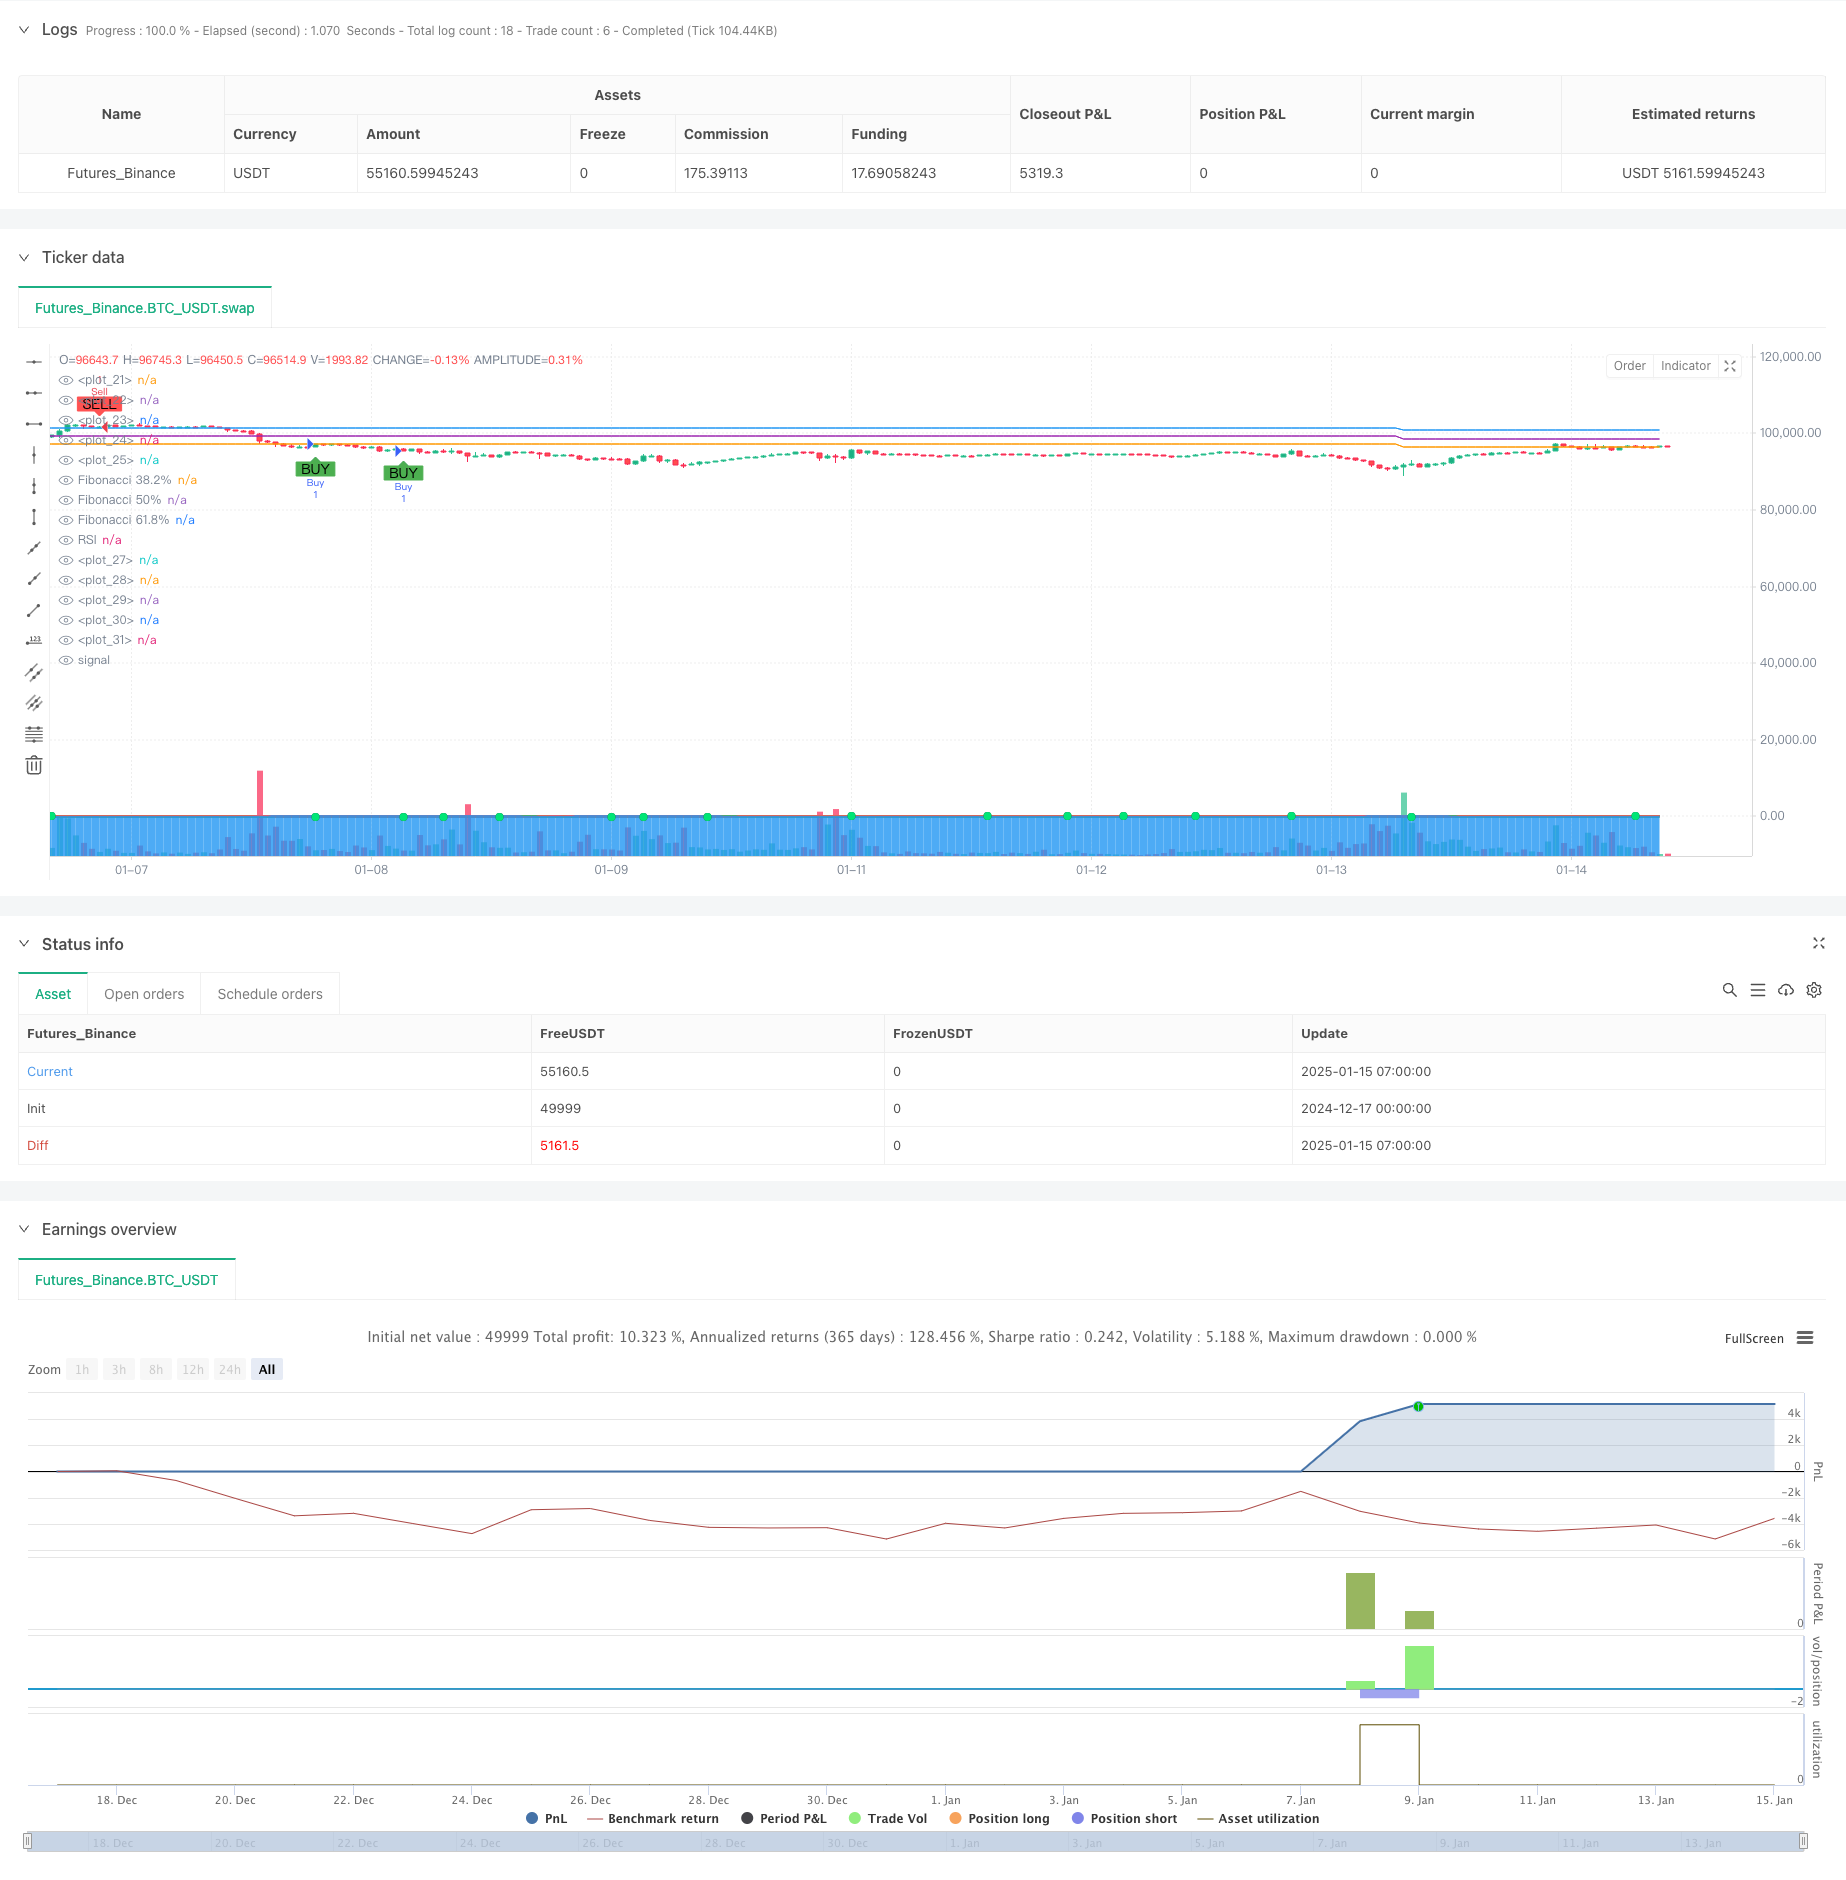
这是一个结合了WaveTrend指标、斐波那契回调水平和RSI指标的综合量化交易策略。策略通过多重技术指标的协同配合,在市场趋势与价格波动中寻找最佳的交易机会。策略采用动态调整的方式持续跟踪市场走势,通过多重信号确认来提高交易的准确性。
策略原理
策略主要基于以下几个核心要素: 1. WaveTrend指标:通过计算价格的指数移动平均(EMA)和标准差,构建了一个动态的波动通道。当WaveTrend的快线(WT1)与慢线(WT2)发生交叉时,产生交易信号。 2. 斐波那契回调水平:策略动态计算并更新价格的最高点和最低点,实时绘制38.2%、50%和61.8%三个关键的斐波那契回调水平。 3. RSI指标:使用14周期的相对强弱指数(RSI)来确认市场的超买超卖状态。 4. 多重信号确认:策略要求WaveTrend交叉信号、RSI超买超卖信号以及价格与斐波那契水平的关系同时满足特定条件才会触发交易。
策略优势
- 信号可靠性高:通过多重技术指标的协同配合,有效降低了虚假信号的影响。
- 风险控制完善:设置了基于点数的止盈止损机制,能够有效控制每笔交易的风险。
- 适应性强:策略能够动态调整斐波那契水平,适应不同市场环境。
- 信号明确:交易信号清晰,易于理解和执行。
策略风险
- 市场波动风险:在剧烈波动的市场中,可能会出现止损点位过于宽松的情况。
- 信号滞后性:由于使用了移动平均等技术指标,信号可能存在一定的滞后性。
- 资金管理风险:固定的止盈止损点位可能不适合所有市场环境。
策略优化方向
- 动态止盈止损:建议将固定点数的止盈止损改为基于ATR指标的动态止盈止损机制。
- 市场环境过滤:增加趋势强度过滤器,在不同市场环境下调整策略参数。
- 信号优化:可以考虑加入成交量指标来辅助确认交易信号。
- 参数优化:建议对WaveTrend和RSI的参数进行优化,以适应不同的交易品种和时间周期。
总结
这是一个设计合理、逻辑清晰的综合量化交易策略。通过多重技术指标的配合使用,能够有效捕捉市场机会并控制风险。策略的主要优势在于其可靠的信号系统和完善的风险控制机制。通过建议的优化方向,策略的稳定性和适应性还可以进一步提升。
策略源码
/*backtest
start: 2024-12-17 00:00:00
end: 2025-01-15 08:00:00
period: 1h
basePeriod: 1h
exchanges: [{"eid":"Futures_Binance","currency":"BTC_USDT","balance":49999}]
*/

//@version=5
strategy(title="Şinasi Özel Tarama", shorttitle="Şinasi Tarama", overlay=true)

// LazyBear WaveTrend Göstergesi
n1 = input(10, "Channel Length")
n2 = input(21, "Average Length")
obLevel1 = input(60, "Over Bought Level 1")
obLevel2 = input(53, "Over Bought Level 2")
osLevel1 = input(-60, "Over Sold Level 1")
osLevel2 = input(-53, "Over Sold Level 2")

ap = hlc3
esa = ta.ema(ap, n1)
d = ta.ema(math.abs(ap - esa), n1)
ci = (ap - esa) / (0.015 * d)
tci = ta.ema(ci, n2)

wt1 = tci
wt2 = ta.sma(wt1, 4)

plot(0, color=color.gray)
plot(obLevel1, color=color.red)
plot(osLevel1, color=color.green)
plot(obLevel2, color=color.red)
plot(osLevel2, color=color.green)

plot(wt1, color=color.green)
plot(wt2, color=color.red)
plot(wt1 - wt2, color=color.blue, style=plot.style_area, transp=80)
plot(ta.crossover(wt1, wt2) ? wt2 : na, color=color.black, style=plot.style_circles, linewidth=3)
plot(ta.crossover(wt1, wt2) ? wt2 : na, color=(wt2 - wt1 > 0 ? color.red : color.lime), style=plot.style_circles, linewidth=2)
barcolor(ta.crossover(wt1, wt2) ? (wt2 - wt1 > 0 ? color.aqua : color.yellow) : na)

// Fibonacci seviyelerini çizmek için yeni en yüksek ve en düşük fiyatları her yeni mumda güncelleme
var float fibLow = na
var float fibHigh = na

// Fibonacci seviyelerini yeniden hesapla
if (na(fibLow) or na(fibHigh))
    fibLow := low
    fibHigh := high
else
    fibLow := math.min(fibLow, low)
    fibHigh := math.max(fibHigh, high)

fib38 = fibLow + 0.382 * (fibHigh - fibLow)
fib50 = fibLow + 0.5 * (fibHigh - fibLow)
fib618 = fibLow + 0.618 * (fibHigh - fibLow)

plot(fib38, color=color.orange, linewidth=1, title="Fibonacci 38.2%")
plot(fib50, color=color.purple, linewidth=1, title="Fibonacci 50%")
plot(fib618, color=color.blue, linewidth=1, title="Fibonacci 61.8%")

// RSI hesaplama
rsiPeriod = input(14, title="RSI Length")
rsiValue = ta.rsi(close, rsiPeriod)
plot(rsiValue, color=color.blue, title="RSI")

// Buy ve Sell sinyalleri

// Buy sinyali
buyCondition = rsiValue < 30 and close < fib38 and close < fib50 and close < fib618 and ta.crossover(wt1, wt2)
plotshape(buyCondition, title="Buy Signal", location=location.belowbar, color=color.green, style=shape.labelup, text="BUY")

// Sell sinyali
sellCondition = rsiValue > 70 and close > fib38 and close > fib50 and close > fib618 and ta.crossunder(wt1, wt2)
plotshape(sellCondition, title="Sell Signal", location=location.abovebar, color=color.red, style=shape.labeldown, text="SELL")

// Strateji giriş ve çıkış
// Buy (Alım) işlemi
if (buyCondition)
    strategy.entry("Buy", strategy.long)

// Sell (Satım) işlemi
if (sellCondition)
    strategy.entry("Sell", strategy.short)

// TP (Take Profit) seviyesinin 3500 pip olarak ayarlanması
// SL (Stop Loss) seviyesinin 7000 pip olarak ayarlanması

pipValue = syminfo.mintick * 10 // Pip değeri

// Buy TP (Alım TP) seviyesi
buyTPCondition = buyCondition
strategy.exit("Buy Exit", "Buy", limit=close + 300 * pipValue, stop=close - 700 * pipValue)

// Sell TP (Satım TP) seviyesi
sellTPCondition = sellCondition
strategy.exit("Sell Exit", "Sell", limit=close - 3500 * pipValue, stop=close + 7000 * pipValue)
相关推荐