
Overview
This strategy is a trend following system based on the 200-period Simple Moving Average (MA200), combined with technical indicators including the Relative Strength Index (RSI), Average Directional Index (ADX), and Average True Range (ATR) to form a complete trading decision framework. The strategy implements effective risk control through dynamic stop-loss and profit targets. Backtesting results show that the strategy has achieved good win rates across multiple trading instruments, demonstrating strong adaptability and stability.
Strategy Principles
The core logic of the strategy is built on the following key points:
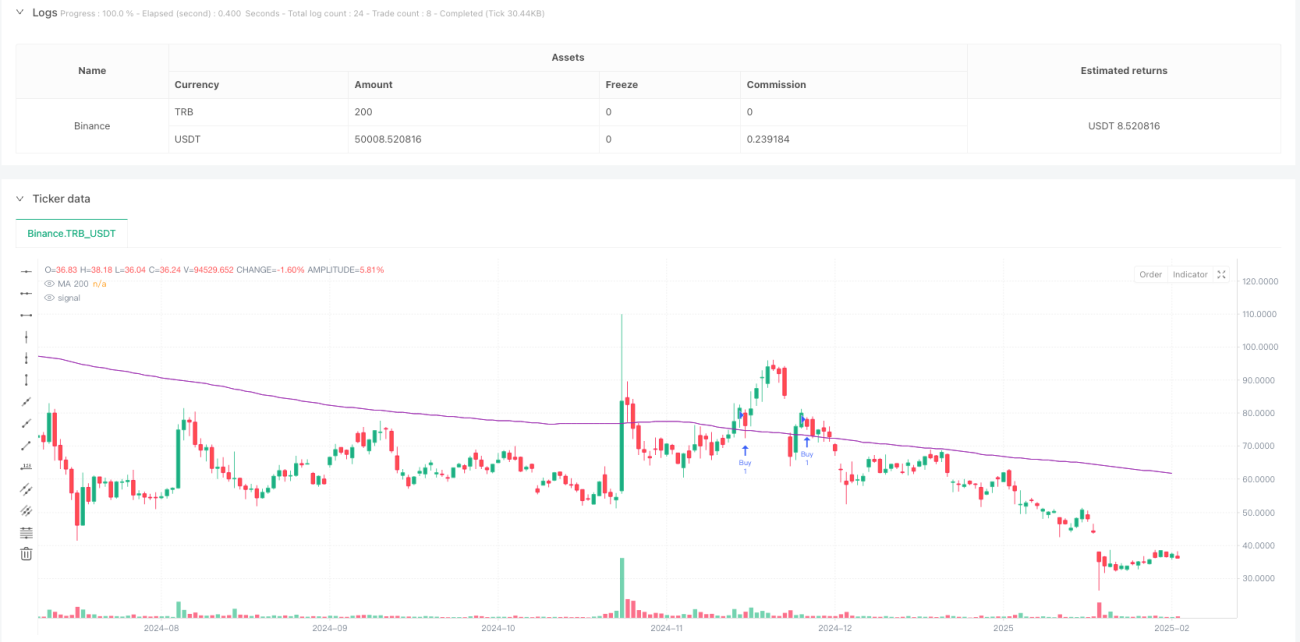
- Uses MA200 as the primary trend indicator, generating initial signals when price breaks through MA200
- Employs RSI for overbought/oversold judgment, requiring RSI>40 for buy signals and RSI<60 for sell signals
- Incorporates ADX to judge trend strength, requiring ADX>20 to ensure clear trends
- Filters false breakouts through 2-period signal confirmation
- Sets dynamic stop-loss based on ATR, with fixed take profit at 2%
Strategy Advantages
- Multiple indicator collaboration validates signals, improving reliability
- Dynamic stop-loss design effectively controls risk
- Signal delay confirmation mechanism reduces false breakout impacts
- Clear strategy logic with reasonable parameter settings, highly practical
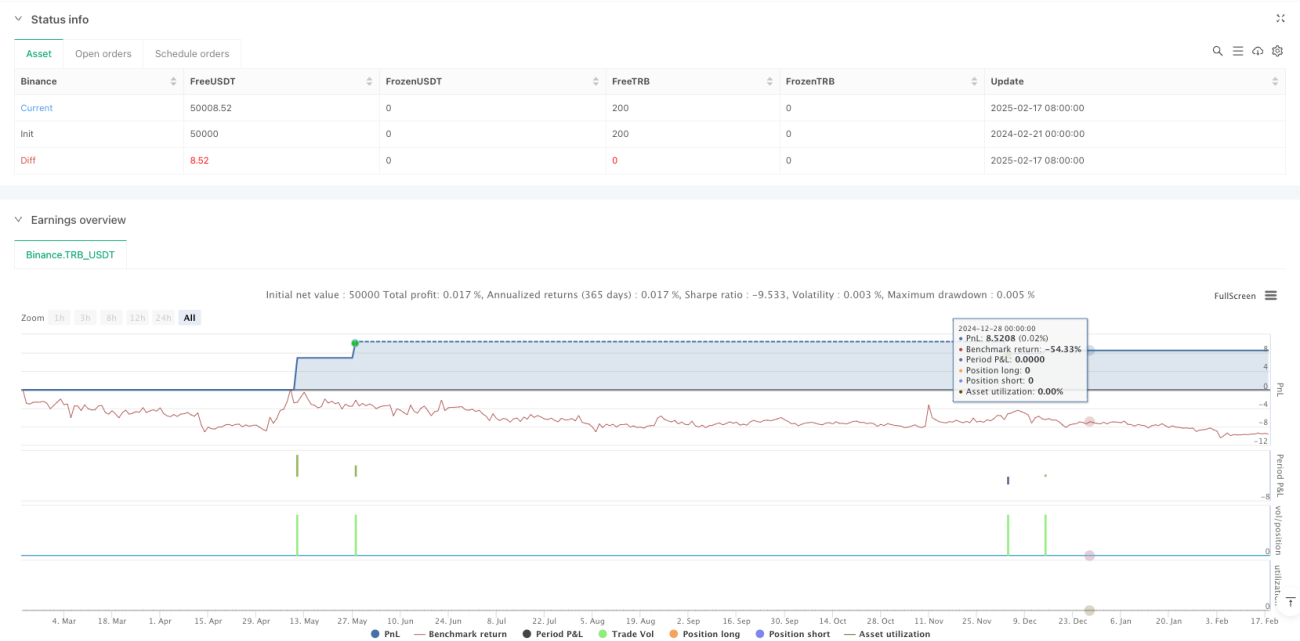
- Backtesting shows maintained high win rates across multiple trading instruments
Strategy Risks
- Long MA200 period may lead to delayed entry timing
- Fixed 2% profit target might exit too early in strong trends
- RSI and ADX parameters may need optimization for different market characteristics
- Signal confirmation mechanism might miss trading opportunities in fast markets
Strategy Optimization Directions
- Consider introducing adaptive moving average periods
- Design dynamic profit target calculation methods
- Add volume indicators as auxiliary judgment
- Optimize dynamic adjustment mechanism for signal confirmation periods
- Introduce volatility filters to adjust position sizing during high volatility periods
Summary
The strategy builds a robust trend following system by combining multiple technical indicators. The design emphasizes risk control through dynamic stop-loss and signal confirmation mechanisms to improve trading reliability. While there is room for optimization, it is overall a practical trading strategy with real value. Future improvements can be made through parameter optimization and additional auxiliary indicators to further enhance strategy performance.
- 1