概述
该策略是一个综合性的技术分析系统,结合了多种K线形态和趋势线形态进行交易信号生成。策略通过识别多个经典的K线形态(如吞没形态、锤子线、启明星等)以及图表形态(如双顶双底、三角形、旗形等)来判断市场趋势的转折点,并在合适的时机发出交易信号。同时,策略还整合了肩头肩形态的识别,为交易决策提供更全面的技术分析支持。
策略原理
策略主要基于以下几个核心组件: 1. K线形态识别系统,包括多个经典的看涨和看跌形态,如吞没形态、锤子线、上吊线、启明星、黄昏星、刺穿线、乌云盖顶和孕线等。 2. 趋势线形态分析系统,用于识别双顶双底、对称三角形、上升三角形、下降三角形、旗形、三角旗和通道等形态。 3. 特殊形态识别系统,专门用于识别头肩顶和头肩底等复杂形态。 4. 风险管理系统,通过设置止损和止盈来控制交易风险。
策略优势
- 多维度分析:通过结合多种技术指标和图形形态,提供更全面的市场分析视角。
- 风险控制完善:策略内置了止损和止盈机制,能够有效控制每笔交易的风险。
- 形态识别准确:通过严格的数学计算和条件判断,确保形态识别的准确性。
- 适应性强:策略可以在不同的市场环境和时间周期下运行。
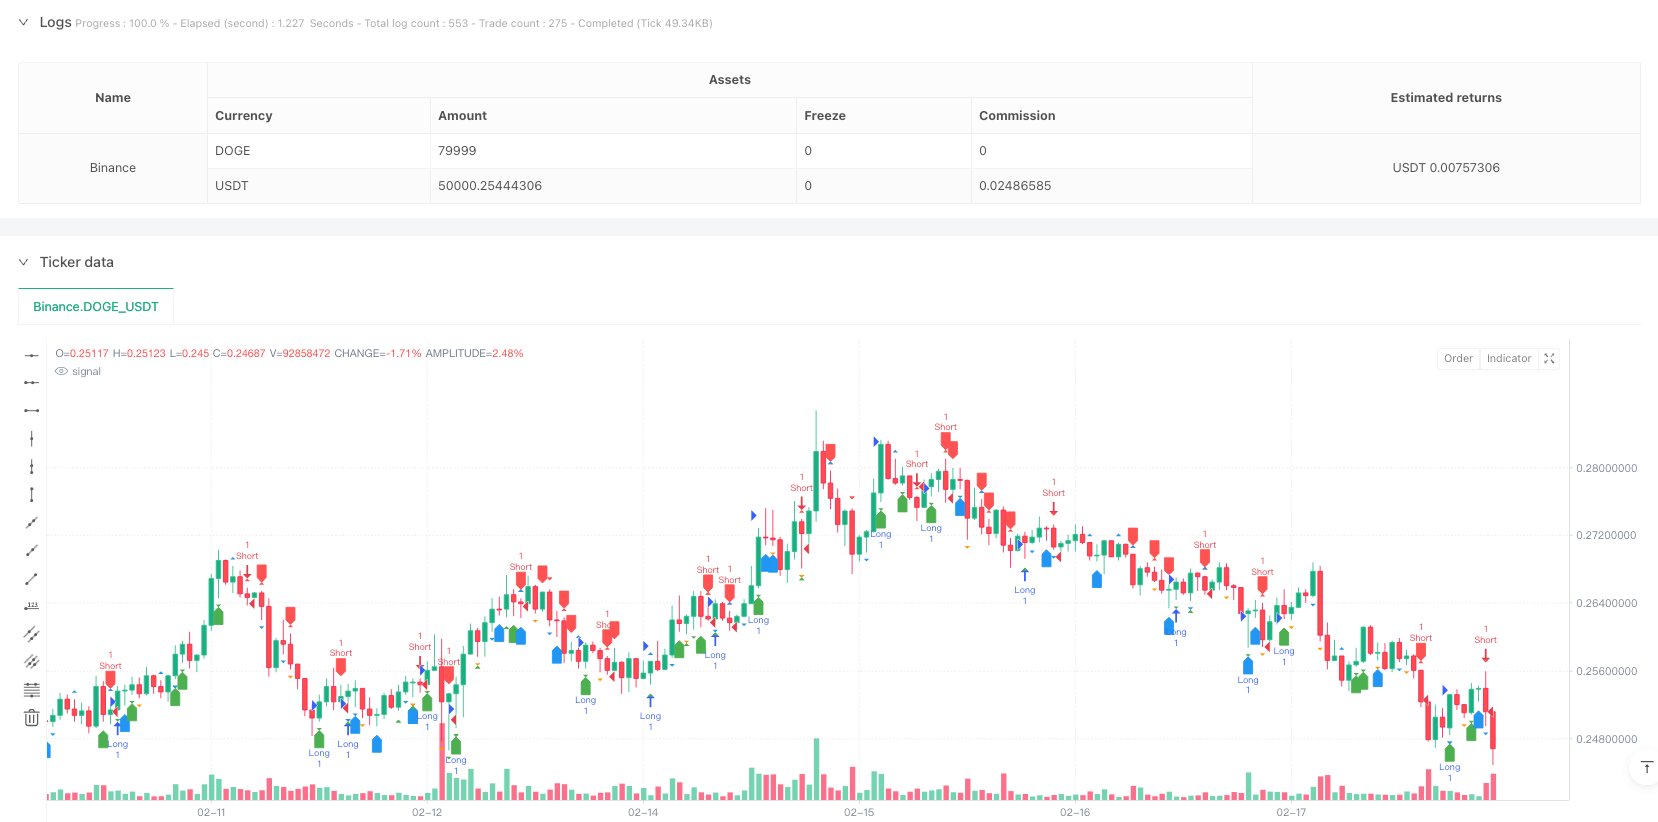
- 可视化支持:提供清晰的图形标记,帮助交易者直观理解市场状况。
策略风险
- 假突破风险:在横盘区间可能出现假突破信号,导致错误交易。
- 滞后性风险:形态识别具有一定的滞后性,可能影响入场时机。
- 市场环境依赖:在剧烈波动或者趋势不明显的市场环境下,策略效果可能减弱。
- 参数敏感性:策略的多个判断条件都依赖于参数设置,参数选择不当可能影响策略表现。
策略优化方向
- 引入量价关系分析:结合成交量指标,提高形态识别的可靠性。
- 优化止损设置:可以根据波动率动态调整止损距离。
- 增加趋势过滤器:引入趋势判断指标,避免在横盘市场过度交易。
- 完善风险管理:增加持仓时间限制和最大损失限制等风险控制手段。
- 添加市场环境识别:开发市场环境判断模块,在不同市场条件下调整策略参数。
总结
该策略通过综合运用多种技术分析方法,构建了一个完整的交易系统。策略的优势在于多维度分析和完善的风险控制,但同时也面临假突破和滞后性等风险。通过持续优化和改进,策略有望在实际交易中取得更好的表现。建议交易者在实盘使用前进行充分的回测和参数优化,并结合市场实际情况灵活调整策略参数。
策略源码
/*backtest
start: 2025-01-20 00:00:00
end: 2025-02-19 00:00:00
period: 1h
basePeriod: 1h
exchanges: [{"eid":"Binance","currency":"DOGE_USDT"}]
*/

//@version=6
strategy("Advanced Candlestick and Line Chart Patterns with Head and Shoulders", overlay=true)

// --- Candlestick Patterns ---
isBullishEngulfing = close > open[1] and open < close[1]
isBearishEngulfing = close < open[1] and open > close[1]

isHammer = (high - low) > 2 * (open - close) and (close - low) / (0.001 + high - low) > 0.6 and (open - low) / (0.001 + high - low) > 0.6
isHangingMan = isHammer and close < open
isDoji = math.abs(close - open) <= 0.1 * (high - low)
isMorningStar = close[2] < open[2] and close[1] > open[1] and close > open and close > close[2] and open[1] > close[2]
isEveningStar = close[2] > open[2] and close[1] < open[1] and close < open and close < close[2] and open[1] < close[2]
isPiercingLine = close > open and close[1] < open[1] and close > open[1] and open < close[1]
isDarkCloudCover = close < open and close[1] > open[1] and close < open[1] and open > close[1]
isBullishHarami = close > open[1] and open < close[1] and close > open and close[1] > open
isBearishHarami = close < open[1] and open > close[1] and close < open and close[1] < open

// --- Line Chart Patterns ---

// Double Top and Double Bottom
doubleTop = (high[2] > high[1] and high[1] < high and close < open[1])
doubleBottom = (low[2] < low[1] and low[1] > low and close > open[1])

// Symmetrical Triangles
symmetricalTriangle = (high[2] > high[1] and low[2] < low[1] and high > high[1] and low > low[1])

// Ascending Triangle
ascendingTriangle = (high[2] < high[1] and low[2] > low[1] and high > high[1] and low > low[1])

// Descending Triangle
descendingTriangle = (high[2] > high[1] and low[2] < low[1] and high < high[1] and low < low[1])

// Flags and Pennants
isFlag = (high[1] > high[2] and low[1] > low[2] and high < high[1] and low < low[1])
isPennant = (high[2] < high[1] and low[2] > low[1] and high > high[1] and low < low[1])

// Channel Formation
isChannel = (high[2] > high[1] and low[2] < low[1] and high > high[1] and low < low[1])

// Diamond Pattern
isDiamond = (high[2] < high[1] and low[2] > low[1] and high > high[1] and low < low[1] and high[1] < high and low[1] > low)

// --- Head and Shoulders Patterns ---
// Head and Shoulders
isHeadAndShoulders = high[2] > high[1] and high[1] < high and close < open[1]

// Inverse Head and Shoulders
isInverseHeadAndShoulders = low[2] < low[1] and low[1] > low and close > open[1]

// --- Visual Representation ---
plotshape(series=isBullishEngulfing, location=location.belowbar, color=color.green, style=shape.labelup, title="Bullish Engulfing")
plotshape(series=isBearishEngulfing, location=location.abovebar, color=color.red, style=shape.labeldown, title="Bearish Engulfing")

plotshape(series=isHammer, location=location.belowbar, color=color.green, style=shape.triangledown, title="Hammer")
plotshape(series=isHangingMan, location=location.abovebar, color=color.red, style=shape.triangleup, title="Hanging Man")

plotshape(series=isDoji, location=location.belowbar, color=color.blue, style=shape.labelup, title="Doji")
plotshape(series=isMorningStar, location=location.belowbar, color=color.green, style=shape.triangledown, title="Morning Star")
plotshape(series=isEveningStar, location=location.abovebar, color=color.red, style=shape.triangleup, title="Evening Star")

plotshape(series=isPiercingLine, location=location.belowbar, color=color.green, style=shape.triangleup, title="Piercing Line")
plotshape(series=isDarkCloudCover, location=location.abovebar, color=color.red, style=shape.triangledown, title="Dark Cloud Cover")

plotshape(series=isBullishHarami, location=location.belowbar, color=color.green, style=shape.triangledown, title="Bullish Harami")
plotshape(series=isBearishHarami, location=location.abovebar, color=color.red, style=shape.triangleup, title="Bearish Harami")

// Line Chart Pattern Visualization
plotshape(series=doubleTop, location=location.abovebar, color=color.red, style=shape.triangledown, title="Double Top")
plotshape(series=doubleBottom, location=location.belowbar, color=color.green, style=shape.triangleup, title="Double Bottom")

plotshape(series=symmetricalTriangle, location=location.belowbar, color=color.blue, style=shape.triangledown, title="Symmetrical Triangle")
plotshape(series=ascendingTriangle, location=location.belowbar, color=color.blue, style=shape.triangledown, title="Ascending Triangle")
plotshape(series=descendingTriangle, location=location.abovebar, color=color.blue, style=shape.triangleup, title="Descending Triangle")

plotshape(series=isFlag, location=location.belowbar, color=color.orange, style=shape.triangledown, title="Flag")
plotshape(series=isPennant, location=location.belowbar, color=color.purple, style=shape.triangledown, title="Pennant")

plotshape(series=isChannel, location=location.belowbar, color=color.blue, style=shape.triangledown, title="Channel")
plotshape(series=isDiamond, location=location.abovebar, color=color.blue, style=shape.triangledown, title="Diamond")

// Head and Shoulders Pattern Visualization
plotshape(series=isHeadAndShoulders, location=location.abovebar, color=color.red, style=shape.triangledown, title="Head and Shoulders")
plotshape(series=isInverseHeadAndShoulders, location=location.belowbar, color=color.green, style=shape.triangleup, title="Inverse Head and Shoulders")

// --- Strategy Logic ---
longCondition = isBullishEngulfing or isHammer or isMorningStar or isPiercingLine or isBullishHarami or doubleBottom or isInverseHeadAndShoulders
shortCondition = isBearishEngulfing or isHangingMan or isEveningStar or isDarkCloudCover or isBearishHarami or doubleTop or isHeadAndShoulders

if (longCondition)
    strategy.entry("Long", strategy.long)
if (shortCondition)
    strategy.entry("Short", strategy.short)

// Stop-Loss and Take-Profit
strategy.exit("Take Profit/Stop Loss", "Long", stop=low - 10, limit=high + 10)
strategy.exit("Take Profit/Stop Loss", "Short", stop=high + 10, limit=low - 10)
相关推荐