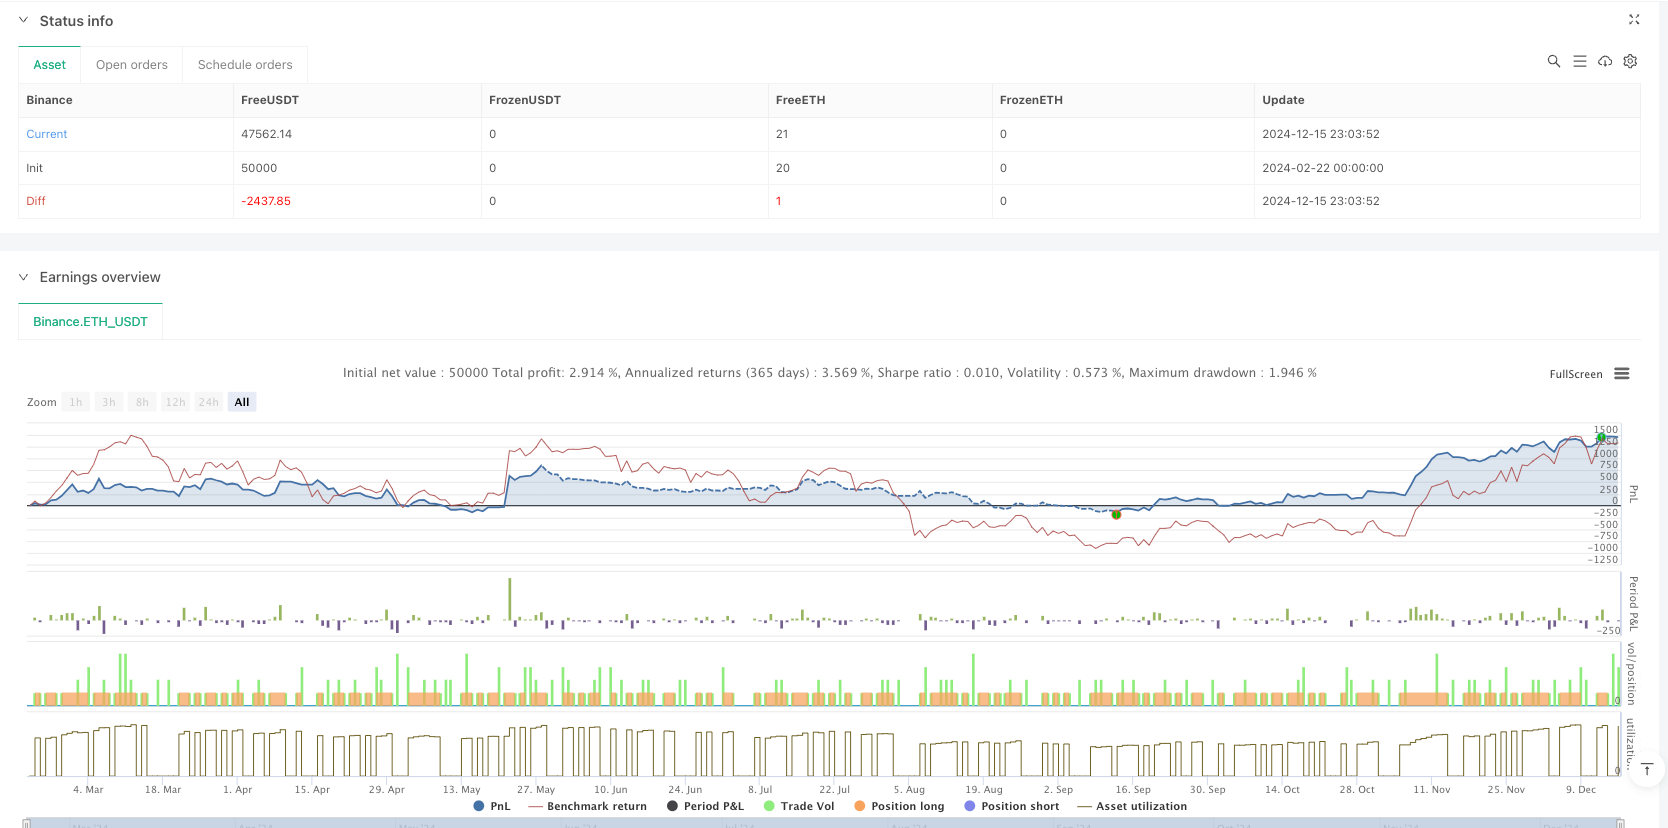

概述
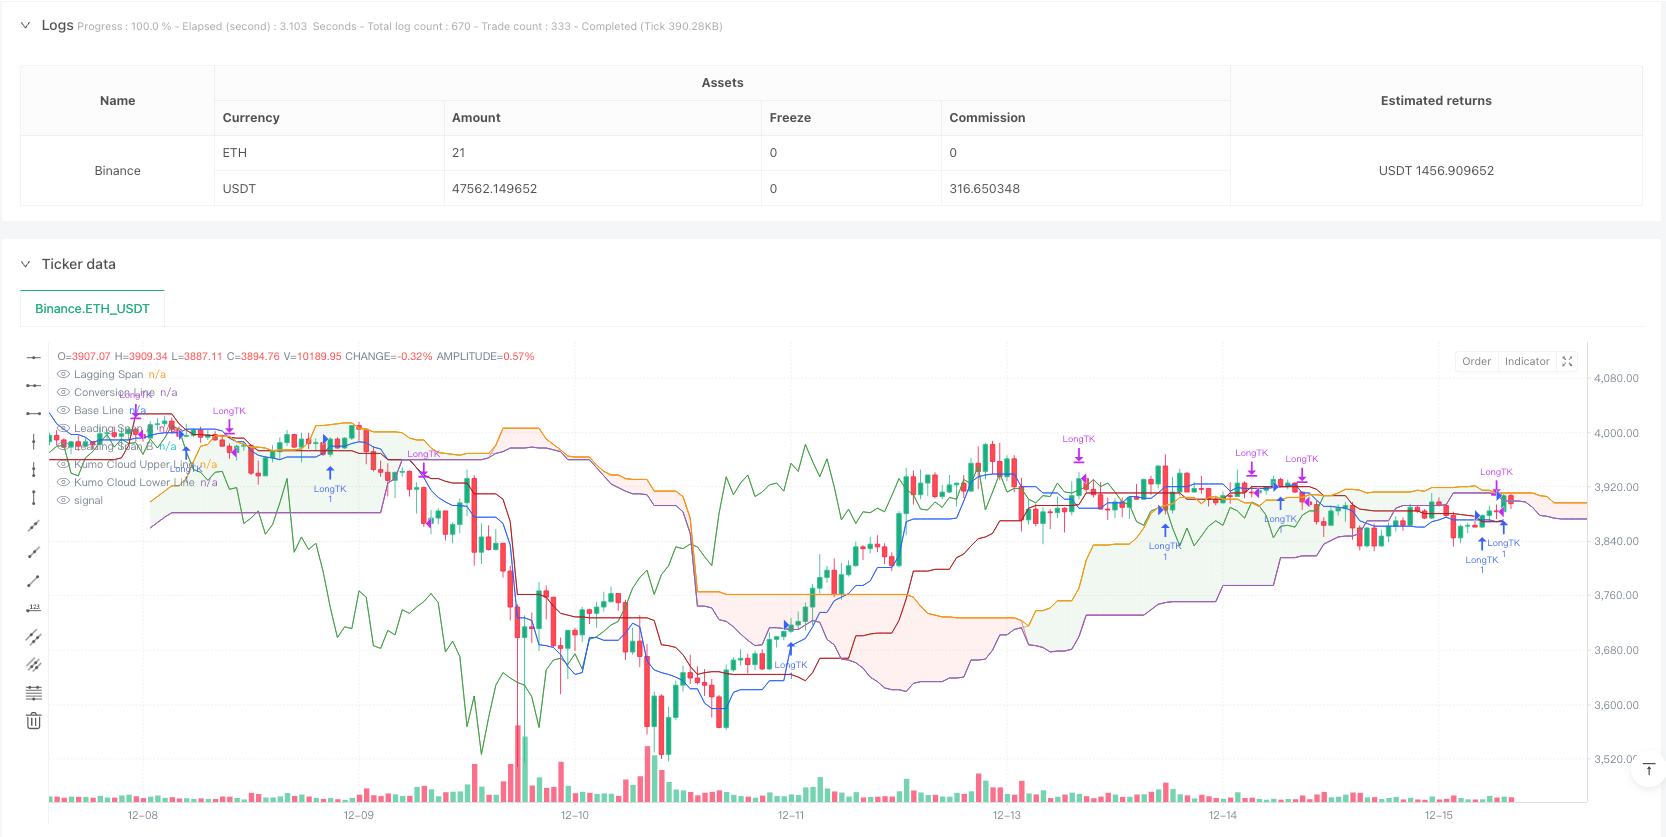
该策略是基于经典市云转向系统(Ichimoku Kinko Hyo)的改良版本,通过转换线与基准线的动态交叉来识别交易信号。策略在传统的市云系统基础上,增加了自动交易信号的生成和执行逻辑,并配合可视化标签来提高市场趋势的可读性。
策略原理
策略的核心是基于市云系统的五条主要曲线:转换线(9周期)、基准线(26周期)、领先线A、领先线B(52周期)和滞后线。其中最关键的交易信号来自于转换线与基准线的交叉。当转换线上穿基准线时产生做多信号,下穿时平仓。策略使用了动态唐奇安通道来计算各条线,通过取最高价和最低价的平均值来反映价格波动。
策略优势
- 系统化的趋势跟踪 - 通过多重时间框架的指标组合,能够全面捕捉市场趋势。
- 视觉直观 - 使用颜色标签和云图显示,交易信号清晰可见。
- 风险管理集成 - 具有内置的止损机制,当市场反转时自动平仓。
- 适应性强 - 参数可调整,能够适应不同市场环境。
- 信号稳定 - 使用均线交叉来过滤虚假信号,提高交易质量。
策略风险
- 趋势反转延迟 - 由于使用了移动平均线,存在一定的滞后性。
- 震荡市不适用 - 在横盘整理阶段可能产生虚假信号。
- 参数敏感性 - 不同的参数设置会显著影响策略表现。
- 云图复杂性 - 多条线路的交织可能造成信号解读困难。
策略优化方向
- 引入波动率过滤 - 可以添加ATR指标来调整仓位大小。
- 优化进场时机 - 结合RSI等动量指标来确认交易信号。
- 完善止损机制 - 可以设置基于云图支撑位的动态止损。
- 增加交易量确认 - 在信号生成时检查交易量,提高可靠性。
- 添加市场环境过滤 - 通过趋势强度指标来选择适合的交易环境。
总结
该策略通过改良传统市云系统,构建了一个完整的趋势跟踪交易系统。虽然存在一定的滞后性,但通过信号过滤和风险管理的优化,能够在趋势市场中获得稳定表现。建议交易者在实盘使用时,结合市场环境和个人风险偏好来调整参数,并持续监控策略表现。
策略源码
/*backtest
start: 2024-02-22 00:00:00
end: 2024-12-16 00:00:00
period: 1h
basePeriod: 1h
exchanges: [{"eid":"Binance","currency":"ETH_USDT"}]
*/

//@version=6

strategy(title="Ichimoku Cloud with Lables", shorttitle="Ichimoku", overlay=true)
conversionPeriods = input.int(9, minval=1, title="Conversion Line Length")
basePeriods = input.int(26, minval=1, title="Base Line Length")
laggingSpan2Periods = input.int(52, minval=1, title="Leading Span B Length")
displacement = input.int(26, minval=1, title="Lagging Span")
donchian(len) => math.avg(ta.lowest(len), ta.highest(len))
conversionLine = donchian(conversionPeriods)
baseLine = donchian(basePeriods)
leadLine1 = math.avg(conversionLine, baseLine)
leadLine2 = donchian(laggingSpan2Periods)
plot(conversionLine, color=#2962FF, title="Conversion Line")
plot(baseLine, color=#B71C1C, title="Base Line")


plot(close, offset = -displacement + 1, color=#43A047, title="Lagging Span", display = display.none)
p1 = plot(leadLine1, offset = displacement - 1, color=#A5D6A7,
	 title="Leading Span A")
p2 = plot(leadLine2, offset = displacement - 1, color=#EF9A9A,
	 title="Leading Span B")
plot(leadLine1 > leadLine2 ? leadLine1 : leadLine2, offset = displacement - 1, title = "Kumo Cloud Upper Line", display = display.none)
plot(leadLine1 < leadLine2 ? leadLine1 : leadLine2, offset = displacement - 1, title = "Kumo Cloud Lower Line", display = display.none)
fill(p1, p2, color = leadLine1 > leadLine2 ? color.rgb(67, 160, 71, 90) : color.rgb(244, 67, 54, 90))

if barstate.islast
    label.new(bar_index+5,baseLine,style=label.style_none,xloc=xloc.bar_index,text="Base",color=color.white,textcolor=#B71C1C)
    label.new(bar_index +8, conversionLine,style=label.style_none,xloc=xloc.bar_index,text="Conversion",color=color.white,textcolor=#2962FF)
	label.new(bar_index+(displacement-1)+5,leadLine1,style=label.style_none,xloc=xloc.bar_index,text="Lead1",color=color.white,textcolor=#A5D6A7)
	label.new(bar_index+(displacement-1)+5,leadLine2,style=label.style_none,xloc=xloc.bar_index,text="Lead2",color=color.white,textcolor=#EF9A9A)

// --- TRADING LOGIC ---

// 1) Detect bullish cross (Conversion crosses above Base)
longSignal = ta.crossover(conversionLine, baseLine)

// 2) Detect bearish cross (Conversion crosses below Base)
closeSignal = ta.crossunder(conversionLine, baseLine)

// 3) If bullish cross occurs, open a new long
if longSignal
    strategy.entry("LongTK", strategy.long)

// 4) If bearish cross occurs, close the open long
if closeSignal
    // Closes all orders opened with the ID "LongTK"
    strategy.close("LongTK")
相关推荐