资源加载中... loading...

Dual Moving Average Crossover Strategy with Daily Profit Target

Author: ChaoZhang, Date: 2024-09-26 14:50:35
Tags: MASMACROSSOVER

img

Overview

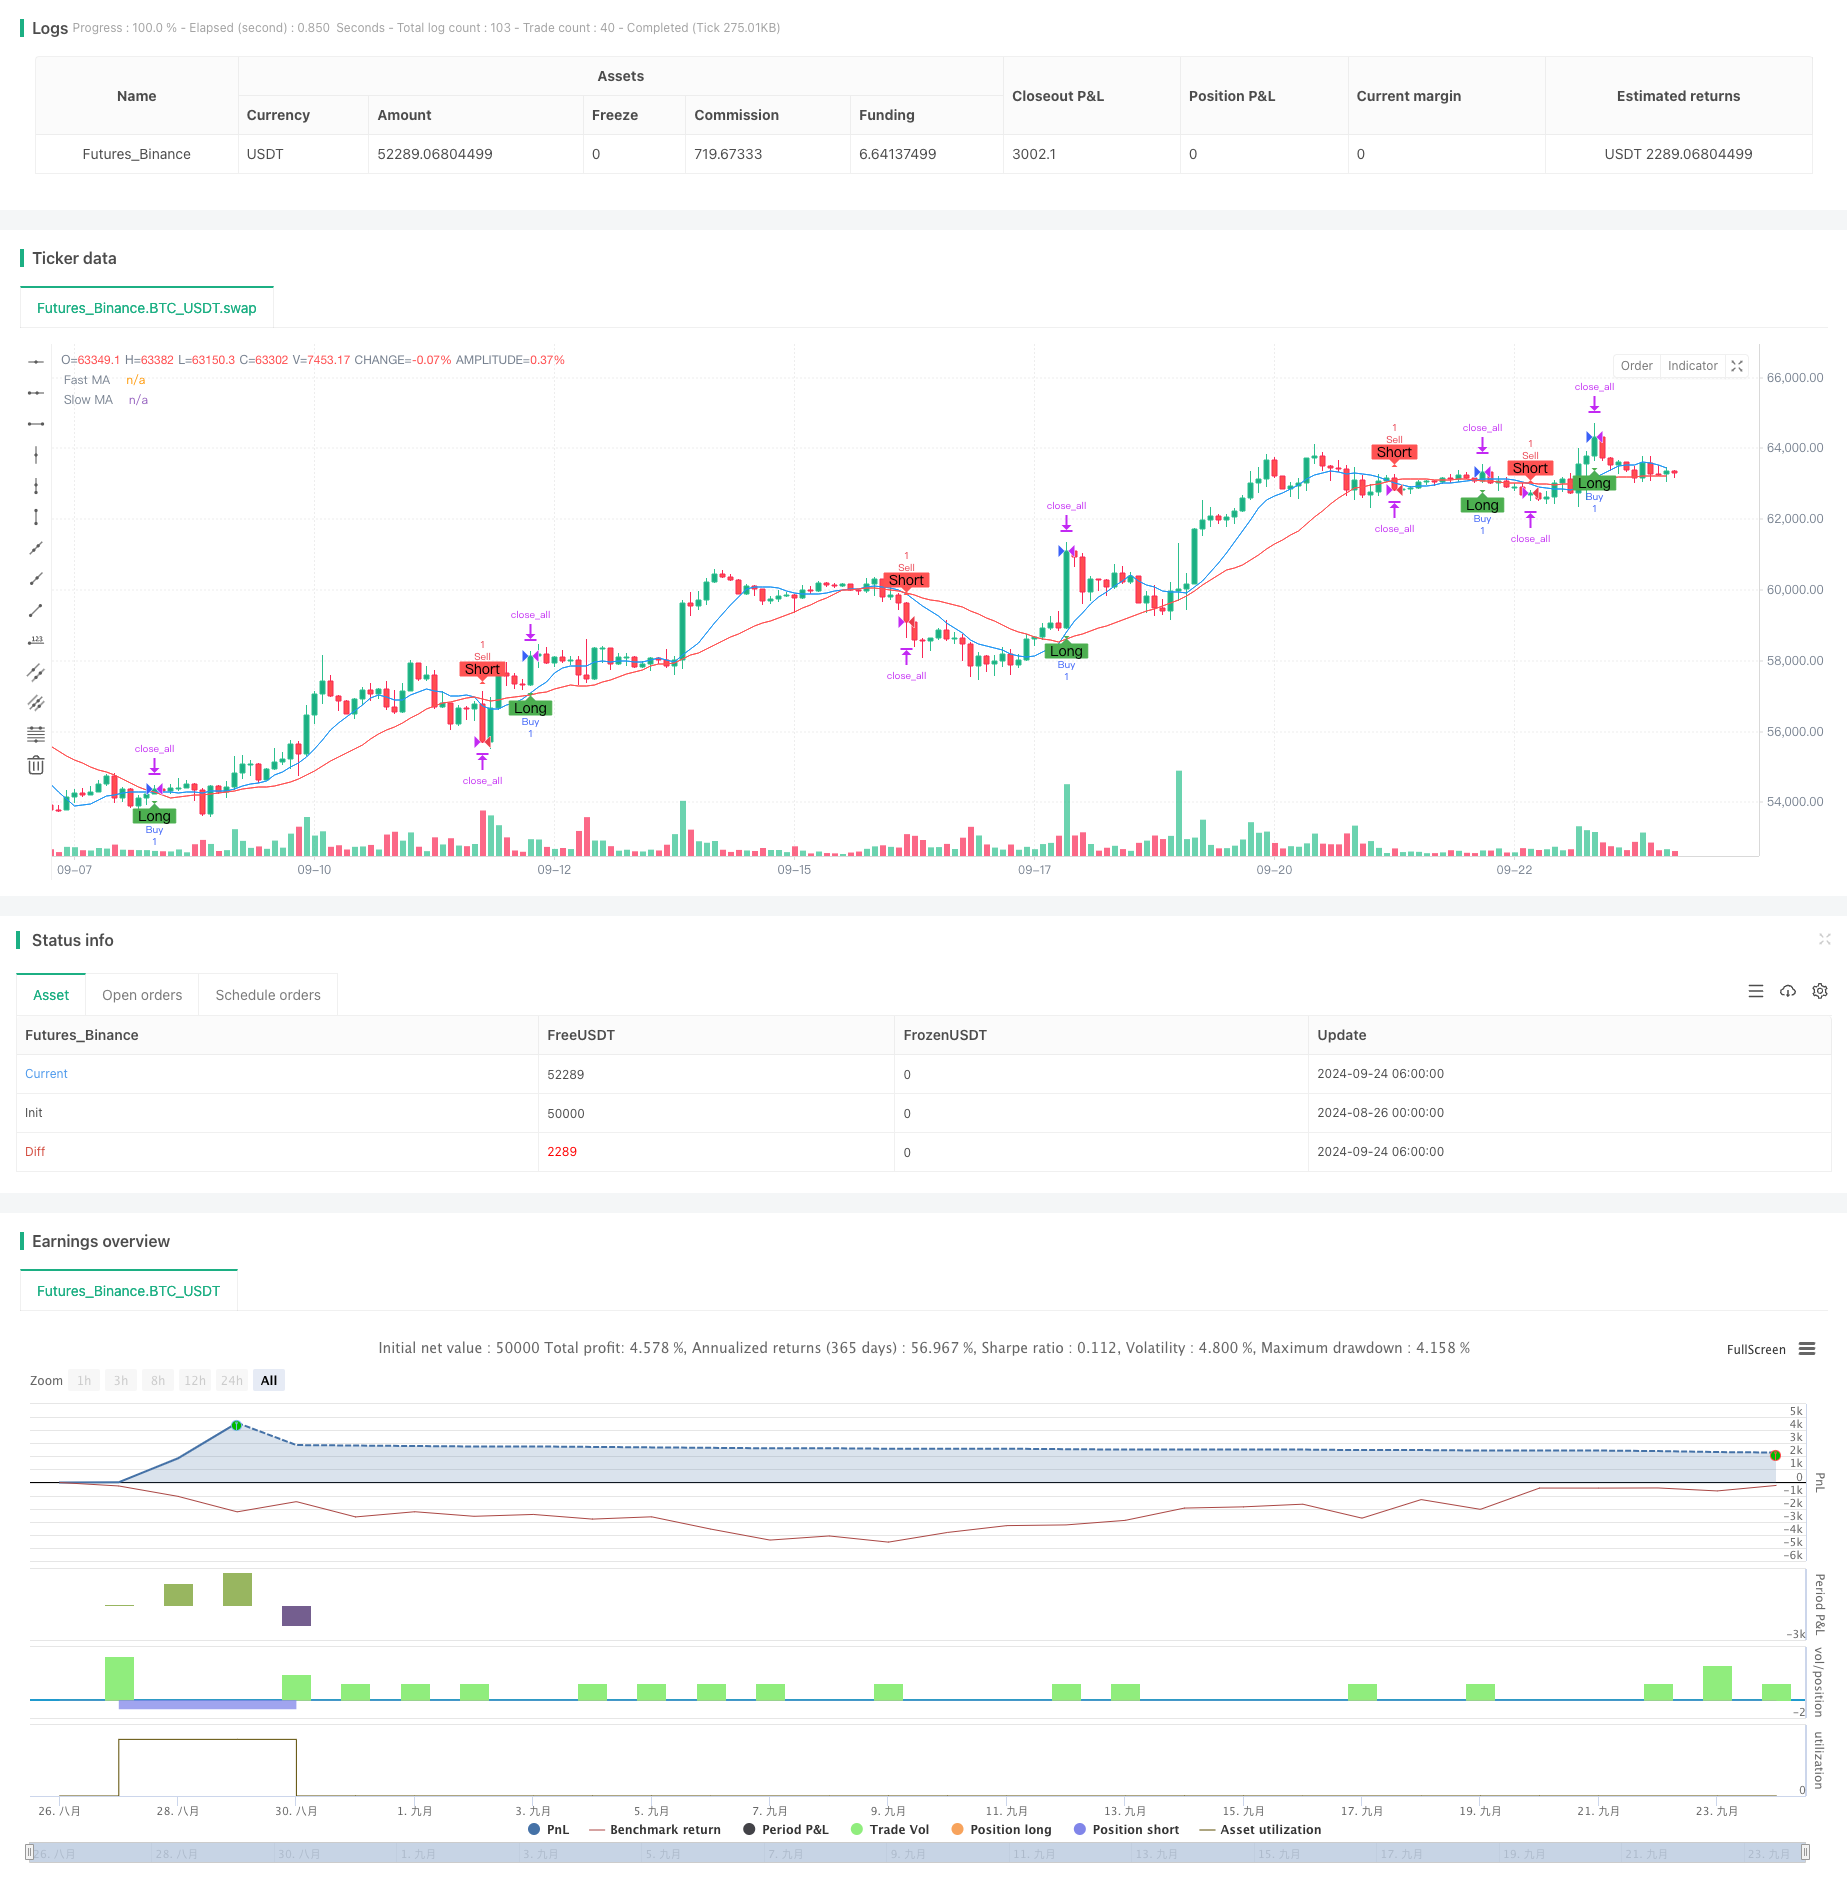
This strategy is an intraday trading system based on dual moving average crossovers, combining fixed stop-loss and trailing stop, with a daily profit target. The strategy primarily uses the crossover of fast and slow moving averages to generate buy and sell signals, while controlling risk and locking in profits through stop-losses and profit targets.

Strategy Principles

  1. Moving Average Calculation: The strategy uses two Simple Moving Averages (SMA), a fast and a slow SMA based on user-defined periods.

  2. Trade Signal Generation:

    • Buy Signal: Triggered when the fast SMA crosses above the slow SMA.
    • Sell Signal: Triggered when the fast SMA crosses below the slow SMA.
  3. Risk Management:

    • Fixed Stop-Loss: Sets a fixed monetary amount for stop-loss on each trade.
    • Trailing Stop: Uses an adjustable trailing stop to protect profits.
  4. Daily Profit Target:

    • Sets a daily profit target, automatically closing positions and stopping trading when reached.
    • Can be disabled by setting the target to 0.
  5. Visualization:

    • Plots fast and slow moving averages on the chart.
    • Uses markers to display buy and sell signals.

Strategy Advantages

  1. Trend Following: Utilizes moving average crossovers to capture market trends, helping to enter at the beginning of trends.

  2. Risk Control: Effectively controls risk for each trade and overall through fixed stop-loss and trailing stop.

  3. Profit Management: Daily profit target helps control risk exposure and protect realized profits.

  4. Flexibility: Allows users to adjust key parameters such as moving average periods, stop-loss amounts, and profit targets to adapt to different market conditions.

  5. Visual Assistance: Intuitively displays moving averages and trade signals on the chart, facilitating analysis and backtesting.

Strategy Risks

  1. Frequent Trading: May generate excessive false signals in choppy markets, leading to frequent trading and increased fees.

  2. Lagging Nature: Moving averages are inherently lagging indicators, potentially reacting too slowly in highly volatile markets.

  3. Fixed Stop-Loss Risk: A fixed monetary stop-loss may not be flexible enough in markets with varying volatility.

  4. Daily Target Limitation: Mandatory daily targets may cause missing out on significant market opportunities.

  5. Parameter Sensitivity: Strategy performance may be highly sensitive to parameter settings, requiring frequent optimization.

Optimization Directions

  1. Dynamic Parameter Adjustment: Consider automatically adjusting moving average periods and stop-loss levels based on market volatility.

  2. Additional Filters: Introduce extra technical or market sentiment indicators to reduce false signals.

  3. Time Filtering: Implement time filtering to avoid highly volatile periods such as market opening and closing.

  4. Position Management: Implement dynamic position sizing, adjusting trade size based on market conditions and account performance.

  5. Multi-Timeframe Analysis: Incorporate longer-term trend analysis to improve entry timing accuracy.

  6. Machine Learning Optimization: Utilize machine learning algorithms to optimize parameter selection and signal generation processes.

Summary

The Dual Moving Average Crossover Strategy with Daily Profit Target is a trading system that combines classical technical analysis with modern risk management techniques. It captures market trends through simple yet effective moving average crossovers, complemented by stop-losses and profit targets for risk management. The strategy’s strengths lie in its simplicity and flexibility, but it also faces challenges inherent to moving average systems, such as lagging nature and parameter sensitivity. Through continuous optimization and the introduction of more advanced features like dynamic parameter adjustment and multi-factor analysis, this strategy has the potential to maintain stable performance across various market environments. For investors seeking a systematic trading approach, this serves as a valuable foundational strategy framework to consider.


/*backtest
start: 2024-08-26 00:00:00
end: 2024-09-24 08:00:00
period: 2h
basePeriod: 2h
exchanges: [{"eid":"Futures_Binance","currency":"BTC_USDT"}]
*/

//@version=5
strategy("NQ Futures $200/day Strategy", overlay=true)

// Input Parameters
fastLength = input.int(9, title="Fast MA Length")
slowLength = input.int(21, title="Slow MA Length")
dailyTarget = input.float(200, title="Daily Profit Target (Set to 0 to disable)", step=0.01)  
stopLossAmount = input.float(100, title="Stop Loss Amount", step=0.01)
trailOffset = input.float(20, title="Trailing Stop Offset", step=0.01)

// Moving Averages
fastMA = ta.sma(close, fastLength)
slowMA = ta.sma(close, slowLength)

// Crossover Conditions for Buy and Sell
longCondition = ta.crossover(fastMA, slowMA)
shortCondition = ta.crossunder(fastMA, slowMA)

// Entry conditions
if (longCondition)
    strategy.entry("Buy", strategy.long)

if (shortCondition)
    strategy.entry("Sell", strategy.short)

// Set Stop Loss and Trailing Stop
if (strategy.opentrades > 0)
    strategy.exit("Exit Long", from_entry="Buy", stop=strategy.position_avg_price - stopLossAmount, trail_offset=trailOffset)
    strategy.exit("Exit Short", from_entry="Sell", stop=strategy.position_avg_price + stopLossAmount, trail_offset=trailOffset)

// Conditional Daily Profit Target (disabled if dailyTarget is 0)
if (dailyTarget > 0 and strategy.netprofit >= dailyTarget)
    strategy.close_all(comment="Daily Target Reached")

// Plotting the moving averages on the main chart
plot(fastMA, color=color.blue, title="Fast MA")
plot(slowMA, color=color.red, title="Slow MA")

// Plot "Long" and "Short" signals on the main chart
plotshape(series=longCondition, title="Long Signal", location=location.belowbar, color=color.green, style=shape.labelup, text="Long")
plotshape(series=shortCondition, title="Short Signal", location=location.abovebar, color=color.red, style=shape.labeldown, text="Short")

// Markers for entry on the price chart
plotshape(series=longCondition, title="Buy Marker", location=location.belowbar, color=color.green, style=shape.triangledown, size=size.small)
plotshape(series=shortCondition, title="Sell Marker", location=location.abovebar, color=color.red, style=shape.triangleup, size=size.small)

template: strategy.tpl:40:21: executing "strategy.tpl" at <.api.GetStrategyListByName>: wrong number of args for GetStrategyListByName: want 7 got 6