Moving Average Based Supply-Demand Zone Trading System with Dynamic Risk Management

Overview
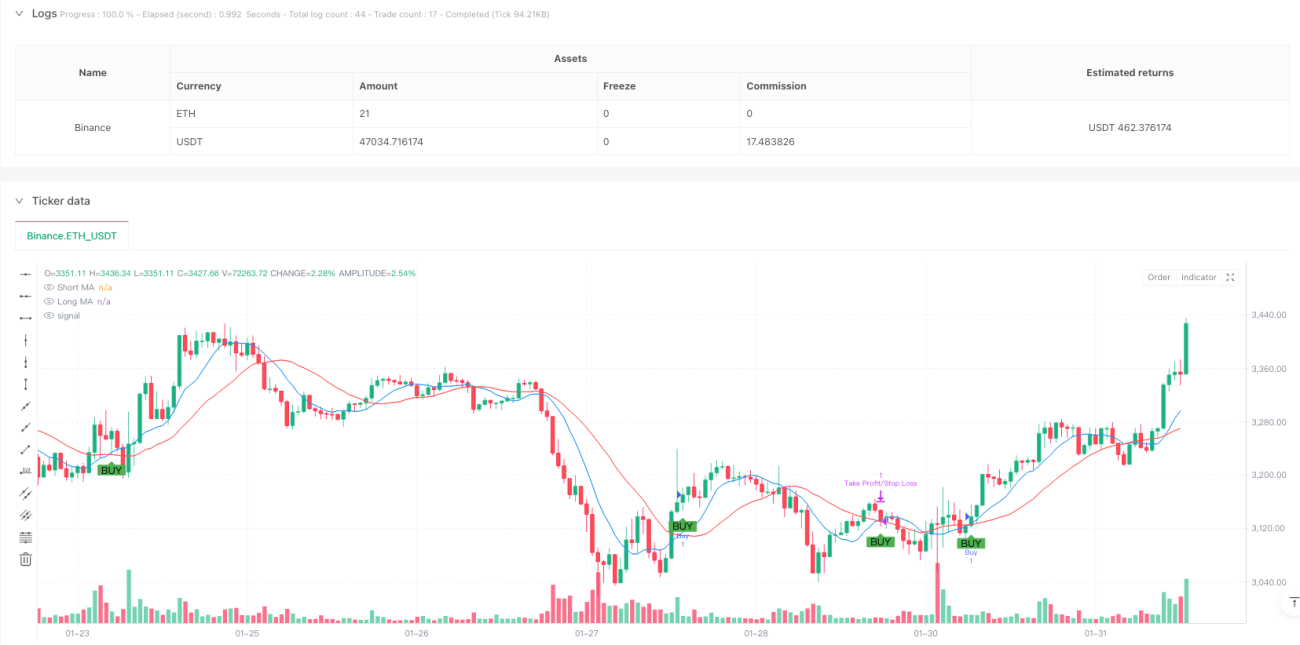
This is a comprehensive trading strategy that combines moving average crossovers, supply/demand zone identification, and dynamic risk management. The strategy determines trade direction through short-term and long-term moving average crossovers, utilizes supply/demand zones as key support and resistance levels, and manages risk with percentage-based stop-loss and take-profit levels. The strategy's core principle is to only enter trades near specific supply/demand zones to improve win rate.
Strategy Principles
The strategy employs 9-period and 21-period Simple Moving Averages (SMA) to determine trend direction. Buy signals are generated when price is within 1% of a demand zone (support) and the short-term MA crosses above the long-term MA; sell signals occur when price is within 1% of a supply zone (resistance) and the short-term MA crosses below the long-term MA. Supply/demand zones are identified based on significant highs/lows within 50 periods, requiring at least 2 confirmation candles. The system automatically sets dynamic stop-loss (default 1%) and take-profit (default 2%) levels based on entry price.
Strategy Advantages
- Multiple confirmation mechanism: Combines technical indicators (MA crossover) and price structure (supply/demand zones) to reduce false breakout risks
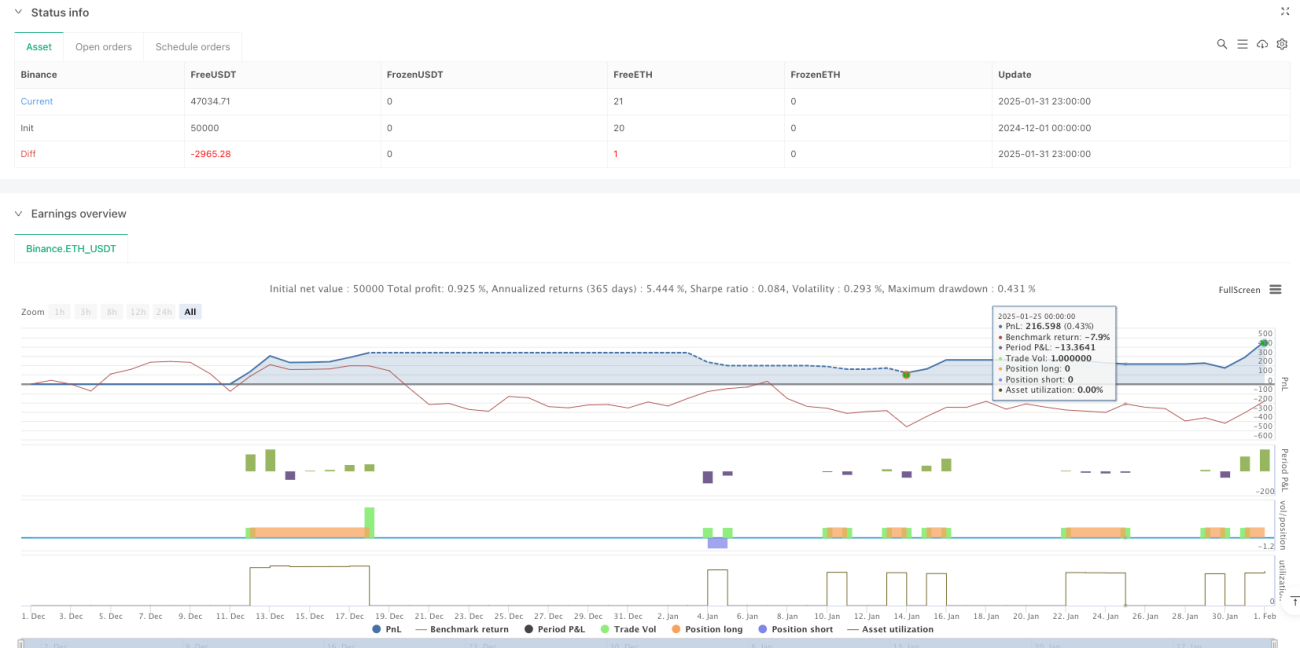
- Dynamic risk management: Stop-loss and take-profit levels based on entry price percentages, adapting to different market conditions
- Visual trade signals: Clear visualization of supply/demand zones and trade signals for analysis and verification
- Flexible parameters: MA periods, supply/demand zone confirmation conditions, and risk management levels can be adjusted for different markets
- Clear strategy logic: Well-defined entry and exit conditions for backtesting and optimization
Strategy Risks
- Choppy market risk: Frequent MA crossovers may generate excessive false signals
- Slippage risk: Trading near supply/demand zones may face significant slippage
- Parameter sensitivity: Optimal parameters may vary significantly across different market conditions
- Fixed stop-loss risk: Percentage-based stops may not suit all market environments
- Money management risk: Strategy lacks position sizing functionality
Optimization Directions
- Volume confirmation: Incorporate volume indicators in MA crossover and supply/demand zone analysis to improve signal reliability
- Dynamic parameter optimization: Automatically adjust stop-loss/take-profit percentages and zone ranges based on market volatility
- Trend filtering: Add longer-term trend analysis to avoid trading against major trends
- Enhanced money management: Include volatility-based position sizing calculations
- Improved zone identification: Introduce additional technical indicators to confirm supply/demand zone validity
Summary
This strategy system combines classical technical analysis methods with modern risk management concepts. By trading near significant price zones and incorporating moving average crossover signals, the strategy provides a relatively reliable trading framework. The dynamic stop-loss and take-profit design helps adapt to different market conditions, but practical application requires optimization based on specific market characteristics. Thorough parameter optimization and backtesting are recommended before live trading.
- 1