ATR Dynamic Trend Following and EMA Crossover Trading Strategy

Overview
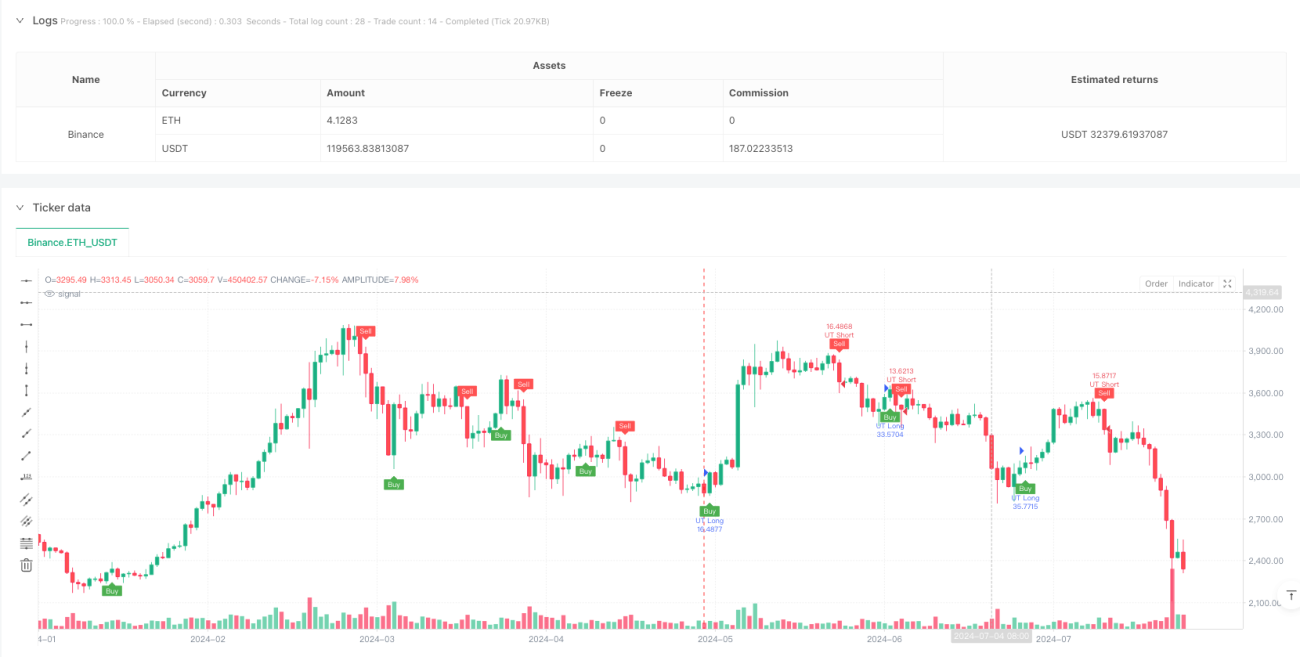
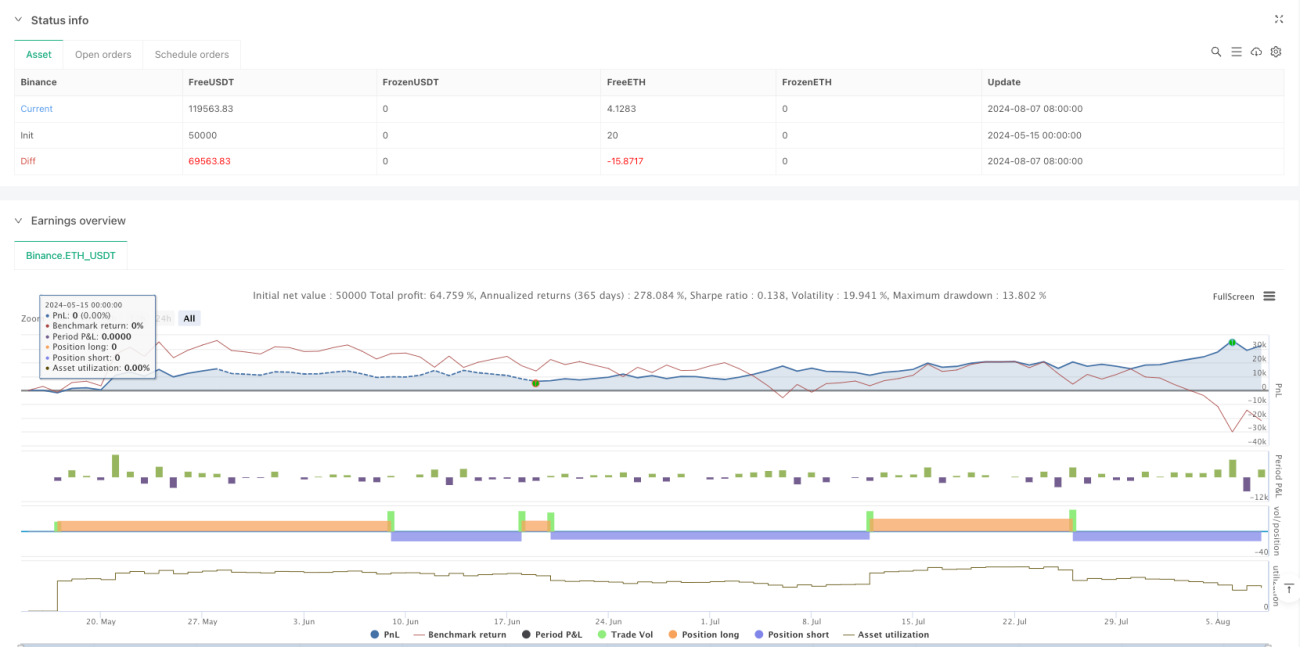
This is a trend following strategy based on the ATR (Average True Range) indicator, combining dynamic stop-loss and EMA crossover signals. The strategy calculates ATR to determine market volatility and uses this information to establish a dynamic trailing stop line. Trading signals are generated when price and EMA (Exponential Moving Average) break through the ATR trailing stop line. The strategy also offers the option to use regular or Heikin Ashi candles for calculations, adding flexibility.
Strategy Principles
The core logic of the strategy is based on the following key calculations:
- Using ATR indicator to measure market volatility with adjustable period
- Calculating dynamic stop-loss distance based on ATR value, adjusted by sensitivity parameter a
- Building ATR trailing stop line that dynamically adjusts with price movement
- Using 1-period EMA crossover with ATR trailing stop line to determine trading signals
- Opening long positions when EMA breaks above ATR trailing stop line, short when breaking below
- Option to use regular closing price or Heikin Ashi HLC3 price as calculation basis
Strategy Advantages
- Strong Dynamic Adaptability: ATR trailing stop automatically adjusts to market volatility, maintaining strategy stability in different market conditions
- Comprehensive Risk Control: Continuous position protection through dynamic stop-loss line
- Good Parameter Adjustability: Can adapt to different market characteristics by adjusting ATR period and sensitivity
- Clear and Reliable Signals: Provides clear entry and exit signals through EMA crossover
- Concise Calculation Logic: Clear strategy logic, easy to understand and maintain
- Good Visualization: Provides graphical display of trading signals and trends
Strategy Risks
- Choppy Market Risk: May generate frequent false breakout signals in sideways markets
- Slippage Impact: May face significant slippage in fast markets, affecting strategy performance
- Parameter Sensitivity: Different parameter combinations may lead to large performance variations
- Trend Dependency: Strategy may not perform well in non-trending markets
- Stop-Loss Range: Abnormal ATR values may lead to unreasonable stop-loss positions
Strategy Optimization Directions
- Add Trend Filter: Introduce additional trend judgment indicators to reduce false signals in choppy markets
- Optimize Parameter Adaptation: Develop mechanism to automatically optimize ATR period and sensitivity
- Improve Signal Confirmation: Add volume or other technical indicators for signal confirmation
- Enhance Stop-Loss Mechanism: Combine fixed and trailing stops with ATR-based stops
- Add Position Management: Dynamically adjust position size based on market volatility
Summary
This is a complete trading strategy combining dynamic trailing stops and moving average systems. It captures market volatility characteristics through the ATR indicator and provides trading signals using EMA crossover, forming a logically rigorous trading system. The strategy's strengths lie in its dynamic adaptability and risk control capabilities, but attention needs to be paid to its performance in sideways markets. Through the suggested optimization directions, there is room for further improvement of the strategy.
- 1