多维度技术指标交叉确认买入信号优化策略

概述
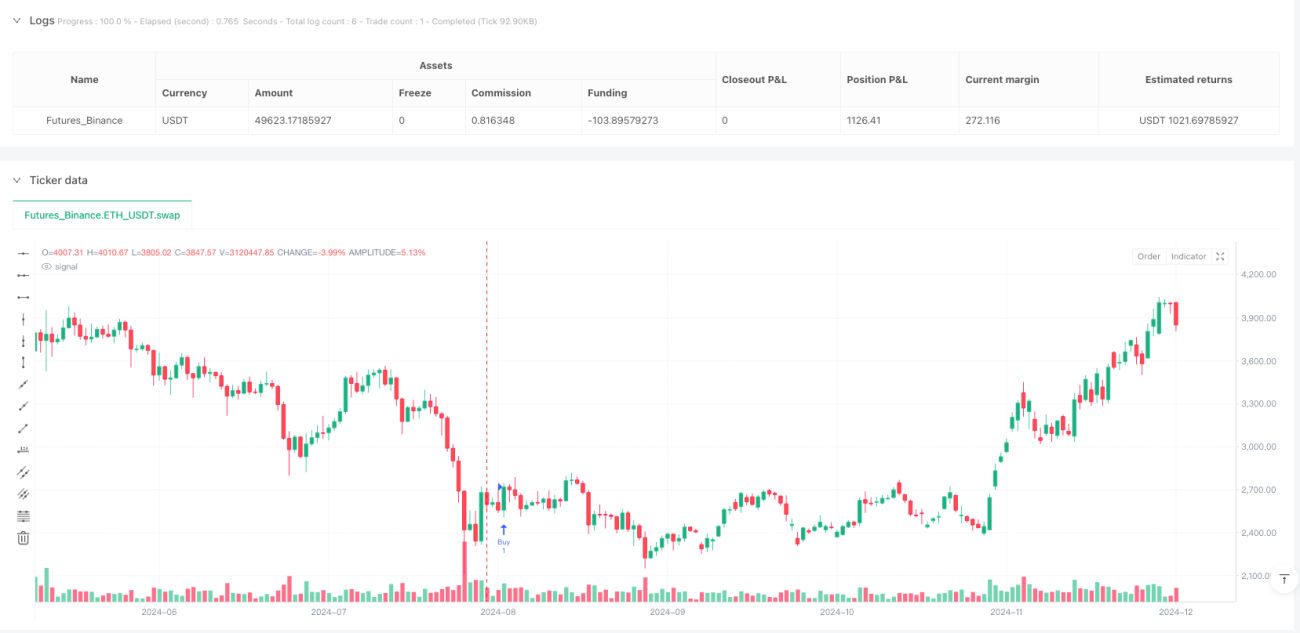
这是一种综合性的买入信号优化策略,通过结合多种技术分析指标和蜡烛图形态来识别市场中的买入机会。该策略的核心特点是其高度可定制性,允许交易者设置最少需满足的条件数量(从9个预定义条件中选择)来触发买入信号。这种灵活的设计使得策略可以适应不同的市场环境和个人交易偏好,同时保持决策的客观性和系统性。
策略原理
该策略基于多维度的技术分析架构,通过综合评估以下9个关键条件:
- 黄金交叉信号:50日简单移动平均线上穿200日简单移动平均线,表明长期趋势可能正在转向看涨。
- RSI反弹信号:相对强弱指标(RSI)低于40并开始上升,表明资产可能处于超卖状态并正开始反弹。
- MACD交叉信号:MACD线上穿信号线,这是一个经典的看涨动量指标。
- 随机指标低位交叉:随机指标%K线从30以下水平上穿%D线,表明价格可能正从超卖水平反弹。
- 斐波那契回调支撑:价格处于关键的斐波那契回调水平(38.2%、50%或61.8%)并显示反转迹象,结合阳线形态确认潜在支撑。
- 抛物线转向指标确认:SAR点位于价格柱之下,表明当前趋势为上升。
- ADX趋势强度确认:平均方向指数(ADX)大于15且上升,同时正向方向指标(+DI)大于负向方向指标(-DI),确认上升趋势的强度。
- 成交量确认:价格上涨时成交量增加,表明买盘力量正在加强。
- 看涨反转K线形态:形成锤子线、倒锤子线或启明星等经典看涨反转K线形态。
策略通过计算满足的条件数量,当满足条件数量达到或超过用户设定的最小阈值时,触发买入信号。默认设置为至少满足2个条件,但用户可以根据自己的风险偏好和市场环境调整这一阈值。
策略优势
该策略具有以下几个显著优势:
- 高度可定制性:交易者可以通过调整最少需满足的条件数量来控制策略的敏感度,在保守和激进之间找到平衡点。
- 多维度确认机制:通过结合不同类型的技术指标(趋势、动量、成交量、支撑阻力和形态分析),减少了单一指标可能带来的误导信号。
- 综合分析框架:策略同时考虑了长期趋势(移动平均线)、中期动量(MACD、RSI)和短期价格行为(K线形态),提供了全面的市场视角。
- 自适应性强:由于采用条件计数机制而非固定条件组合,该策略可以适应不同市场阶段的特性。
- 实用的风险管理:通过要求多个条件同时满足,有效降低了误判风险。
- 易于实施和回测:基于TradingView平台开发,使用标准指标,便于快速部署和历史验证。
策略风险
尽管该策略设计合理,但仍存在以下潜在风险:
- 过度优化风险:9个条件之间可能存在高度相关性,如同时使用多个动量指标可能导致信号冗余。
- 滞后性问题:部分指标如移动平均线本身具有滞后性,可能导致在趋势已经发展后才触发信号。
- 参数敏感性:标准参数可能不适用于所有市场或时间框架,需要针对不同交易品种进行优化。
- 市场环境依赖:该策略在趋势市场中可能表现良好,但在震荡市场中可能产生过多假信号。
- 退出策略缺失:代码中只定义了入场信号,没有明确的退出机制,这可能导致良好的入场后因缺乏有效退出而损失利润。
- 计算复杂性:多条件评估增加了计算复杂度,在实时交易中可能导致轻微延迟。
为减轻这些风险,建议交易者:(1)根据不同市场周期调整最小条件数量;(2)添加适当的止损和获利策略;(3)在不同市场环境中测试策略性能;(4)考虑增加过滤条件以减少假信号。
策略优化方向
基于对代码的深入分析,以下是该策略的潜在优化方向:
- 添加动态条件权重:不同市场环境下,某些指标可能比其他指标更可靠。可以实现一个动态权重系统,根据当前市场特征自动调整各条件的重要性。
- 整合时间过滤器:增加交易时间过滤功能,避开市场开盘和收盘等波动性较大的时段。
- 改进退出逻辑:开发与入场逻辑同样全面的退出策略,可考虑利用逆向条件或设置尾随止损。
- 添加波动率调整机制:在高波动率环境下适当提高最小条件数量要求,在低波动率环境下可相应降低。
- 引入机器学习优化:利用机器学习算法自动识别哪些条件组合在特定市场环境下效果最佳。
- 整合基本面过滤器:在技术分析基础上增加简单的基本面过滤条件,如避开重大经济数据发布期。
- 改进斐波那契回调计算:当前使用260个周期的极值可能不适用于所有市场,可考虑实现自适应周期选择。
- 优化K线形态识别:当前的形态识别相对简单,可以增加更复杂和可靠的形态识别算法。
这些优化措施能够显著提高策略的稳健性和适应性,尤其是在不同市场环境的切换过程中。
总结
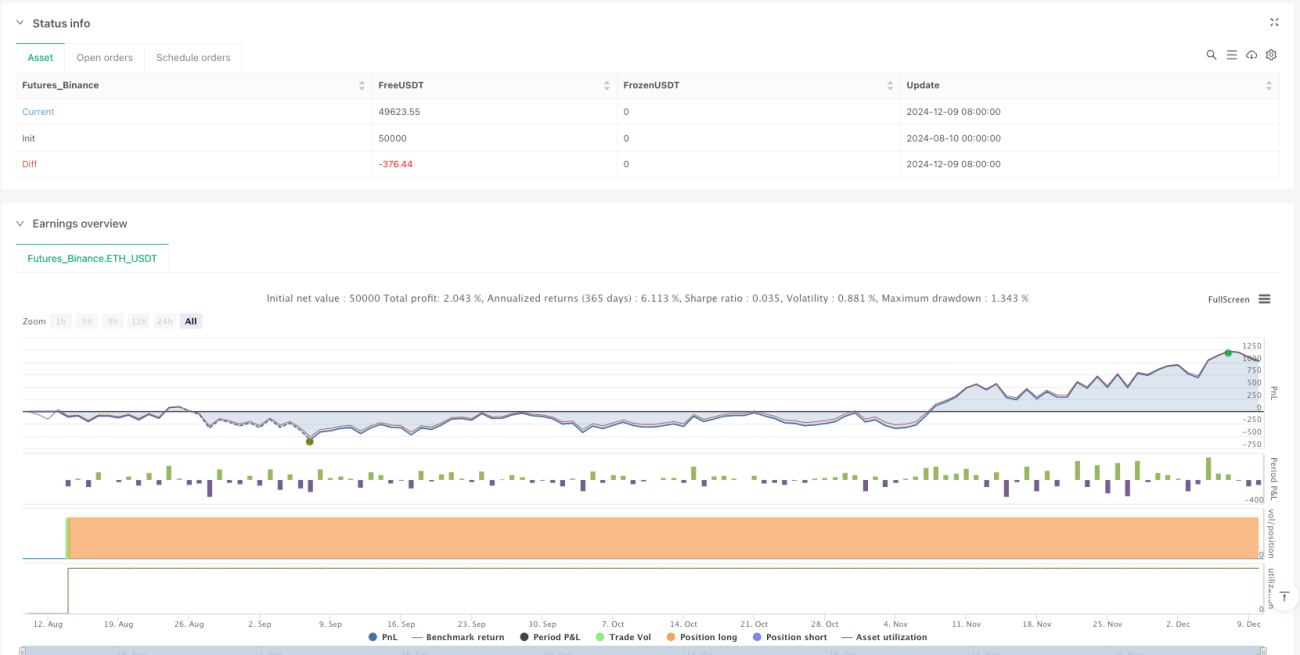
"多维度技术指标交叉确认买入信号优化策略"是一个全面而灵活的交易系统,通过综合分析多种技术指标和价格形态来识别潜在的买入机会。其核心优势在于可定制性和多维度确认机制,使交易者能够根据个人风险偏好和市场条件调整策略敏感度。
虽然该策略存在一些固有风险,如参数敏感性和缺乏完善的退出机制,但通过建议的优化方向,特别是添加动态权重系统和改进退出逻辑,这些问题可以得到有效解决。总的来说,这是一个结构合理、逻辑清晰的买入信号生成框架,既适合经验丰富的交易者进行高级定制,也适合新手通过简单参数调整来获取客观的市场入场信号。
该策略的真正价值不仅在于其买入信号生成能力,更在于它提供了一个可扩展的框架,交易者可以在此基础上不断迭代和改进,发展出更加符合个人交易风格的完整交易系统。
- 1