
Strategy Overview
The Volume Reversal Trend Capture Strategy is a quantitative trading method based on abnormal trading volume and price behavior, designed to identify key moments when the market is likely to reverse direction. The core of this strategy is to find candles with significantly higher-than-average volume and, upon confirming a volume decrease, make trading decisions opposite to the previous trend direction. It leverages the psychological shifts that occur after high volume activity, known as the "middle finger pattern"—where markets typically experience short-term reversals after heavy participation. The strategy employs limit orders to enter the market and sets stop-loss and take-profit levels based on fixed points or ATR, while also including time filtering functionality to avoid low-liquidity market periods.
Strategy Principles
The core principle of this strategy is based on the trend reversal phenomenon following abnormal market volume. The specific operational logic is as follows:
-
Identifying Abnormal Volume: The system detects whether the previous candle has significantly higher-than-average volume. During regular trading hours (RTH), volume needs to exceed the recent average volume by 3 times (adjustable); during after-hours or special sessions (ETH), it needs to exceed 5 times. The average volume calculation automatically excludes RTH edge periods, 4-6 PM after closing, and Sunday pre-market sessions.
-
Confirming Volume Decrease: The current candle's volume must be lower than the previous abnormal volume candle, indicating that large trading activity has ended.
-
Determining Trend Direction: The trend direction is determined by comparing the closing price before the abnormal volume candle with its relationship to the SMA (Simple Moving Average).
-
Counter-trend Entry Signals:
- Long signal: When the trend before the abnormal volume candle is bearish (closing price below SMA), and the current candle shows decreased volume.
- Short signal: When the trend before the abnormal volume candle is bullish (closing price above SMA), and the current candle shows decreased volume.
-
Entry Execution:
- Long: Set a limit buy order at the lowest price of the abnormal volume candle.
- Short: Set a limit sell order at the highest price of the abnormal volume candle.
-
Risk Management: Depending on different instrument characteristics, the system provides two methods for setting stop-loss/take-profit:
- For specific instruments (such as NQ): Use fixed points to set stop-loss and take-profit.
- For other instruments: Option to choose dynamic stop-loss/take-profit based on ATR, or use fixed points.
-
Time Filtering: The strategy can optionally filter trading signals during the first and last 15 minutes of RTH, and always filters signals during the after-hours closing period (4-6 PM) and Sunday pre-market sessions.
Strategy Advantages
-
Capturing Key Turning Points: The strategy focuses on capturing market turning points accompanied by abnormal trading volume, which often represent significant shifts in market sentiment and provide high-probability trading opportunities.
-
Precise Entry Points: By using limit orders at the high/low points of abnormal volume candles, the strategy ensures trading at technically important price levels, improving entry precision.
-
Adaptive Volume Identification: The strategy dynamically adjusts abnormal volume judgment criteria based on different trading sessions (regular trading hours vs. after-hours/special sessions), better aligning with actual market conditions.
-
Flexible Risk Management: Provides stop-loss/take-profit options based on fixed points and ATR, allowing for personalized settings according to different instrument characteristics and volatility.
-
Intelligent Time Filtering: Automatically identifies and filters low-liquidity and unstable trading periods, avoiding false signals that often occur near market opening and closing.
-
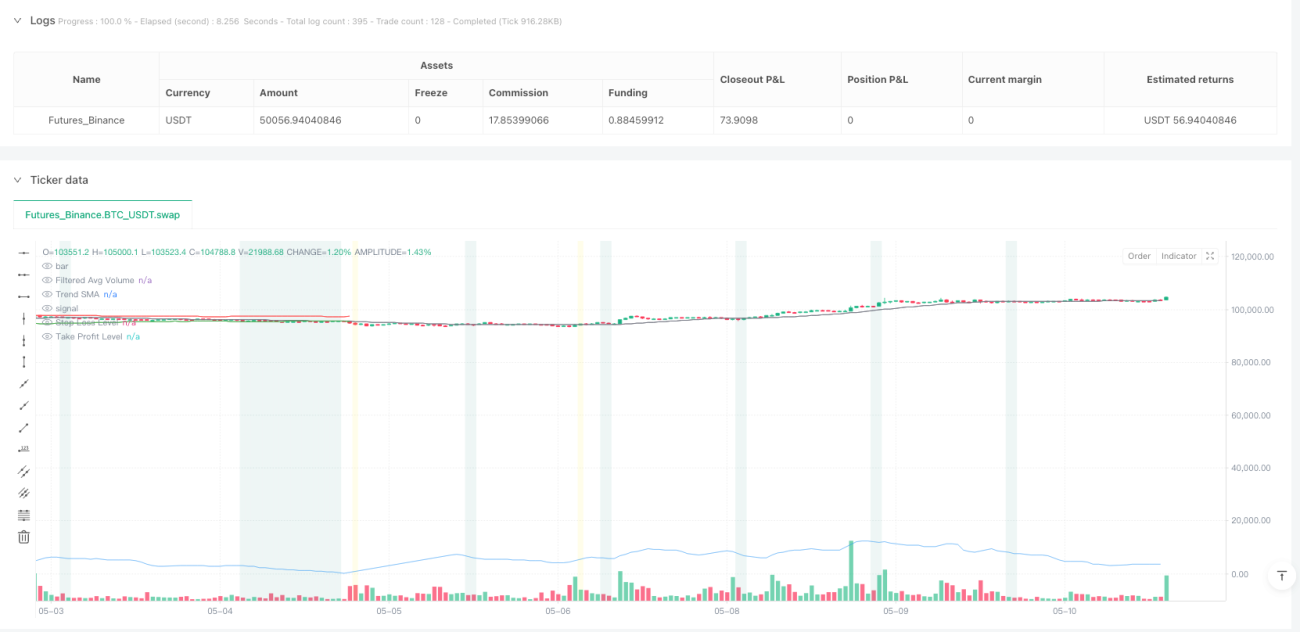
Clear Visual Feedback: The strategy provides intuitive visual indications on the chart, including highlighted abnormal volume candles, trend SMA lines, stop-loss and take-profit levels, facilitating monitoring and analysis by traders.
-
Automated Execution: Once conditions are met, the system automatically executes limit order placement and stop-loss/take-profit settings, reducing human intervention and maintaining trading discipline.
Strategy Risks
-
False Breakout Risk: Abnormal volume may cause prices to temporarily break through important levels, but may quickly retrace afterward, creating false signals. To mitigate this risk, consider adding confirmation indicators, such as RSI overbought/oversold confirmation or breakout duration requirements.
-
News-Driven Event Impact: Major economic data or company announcements may cause abnormal trading volume, but these reactions often persist longer rather than immediately reversing. It is recommended to pause the strategy or add filtering conditions before and after important economic data releases.
-
Market Environment Change Risk: Counter-trend trading in strong trending markets may face continuously adverse price movements. Consider adding long-term trend filters to avoid counter-trend operations in strong trending environments.
-
Limit Order Non-Execution Risk: If the price does not reach the set limit level in the next candle, the trading signal may become invalid. Consider setting a maximum validity period, or converting to market orders under specific conditions.
-
Low Liquidity Risk: Despite the strategy's time filtering functionality, certain instruments may still face liquidity issues during specific periods. It is advisable to adjust trading session restrictions based on the characteristics of the trading instrument.
-
Parameter Optimization Risk: Excessive optimization of strategy parameters may lead to overfitting historical data and poor future performance. Ensure parameters are within reasonable ranges and validate strategy robustness through out-of-sample testing.
Strategy Optimization Directions
-
Multi-Timeframe Confirmation: Add higher timeframe trend filters to ensure higher win rates in the direction of larger trends. For example, check the daily trend direction and only enter positions when aligned with the daily trend.
-
Volume Quality Assessment: Beyond pure volume size, consider adding volume quality assessment, such as Volume Weighted Average Price (VWAP) deviation, to better understand market behavior behind large trading volumes.
-
Dynamic Stop-Loss Strategy: Implement volatility-based dynamic stop-losses that automatically adjust stop-loss positions as trades move favorably, locking in partial profits. For example, use trailing stops or move stops to breakeven after breaking through key levels.
-
Multi-Instrument Correlation Filtering: For correlated instruments (such as stock index futures and spot, gold and silver, etc.), adding confirmation indicators from related instruments can improve signal quality. Signals may be more reliable when multiple correlated instruments simultaneously display abnormal volume and price behavior.
-
Machine Learning Optimization: Analyze the characteristics of the most successful abnormal volume patterns in historical data through machine learning algorithms, dynamically adjusting entry conditions and parameters. For example, use decision trees or random forests to predict the best action given specific abnormal volume characteristics.
-
Volatility Adjustment: Adjust abnormal volume judgment criteria and stop-loss/take-profit levels based on the current market volatility state. Increase abnormal volume threshold and reduce stop-loss distance in high-volatility environments; do the opposite in low-volatility environments.
-
Add Fundamental Filtering: Adjust strategy parameters or pause trading during major economic data release days or quarterly earnings seasons to avoid false signals caused by news interference.
Summary
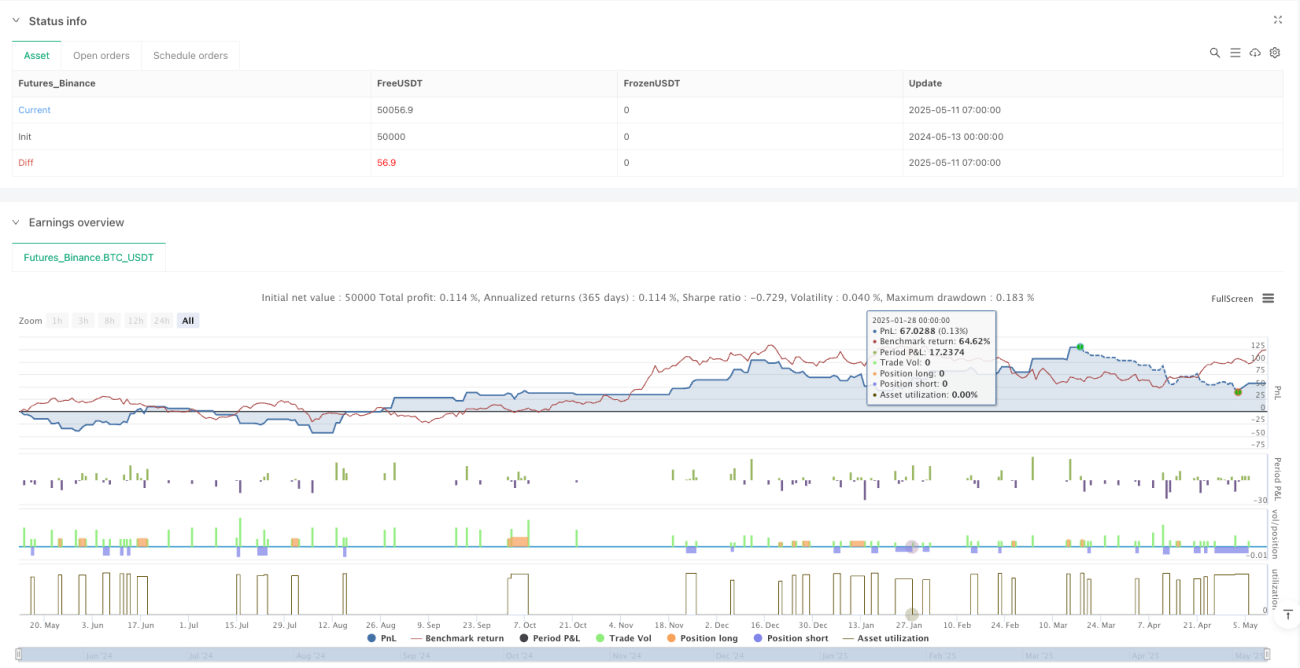
The Volume Reversal Trend Capture Strategy is a quantitative trading system focusing on trading volume and price behavior, capturing potential reversal points by identifying changes in market sentiment following abnormal trading volume. The strategy clearly defines entry, exit conditions, and risk management rules technically, and includes intelligent time filtering mechanisms to avoid low-quality market periods.
The core advantage of the strategy lies in its precise capture of the market's "middle finger pattern"—short-term reversal opportunities that often form when market participants surge in and subsequently withdraw. By precisely positioning limit orders at key price levels and coupling with reasonable stop-loss and take-profit management, the strategy provides a disciplined trading method.
However, users should be aware of the strategy's potential risks in strong trending markets and its sensitivity to news events. By adding multi-timeframe confirmation, dynamically adjusting parameters, and enhancing risk management mechanisms, the strategy can further optimize its performance stability and adaptability.
Overall, the Volume Reversal Trend Capture Strategy provides traders with a trading system based on market behavior and psychological principles, particularly suitable for volatile markets and range-bound conditions. With reasonable settings and continuous optimization, this strategy has the potential to become an effective tool in a trading portfolio.
- 1