
Overview
This strategy is a quantitative trading system based on multi-timeframe analysis, primarily utilizing MACD indicator, RSI indicator, VWAP moving averages, and ATR volatility filter to execute trades based on comprehensive signals from 30-minute and 1-hour timeframes. The strategy supports both long and short positions, confirming signals through technical indicator crossovers across different timeframes, combined with volatility conditions filtering to improve trade quality. The strategy incorporates fixed percentage take-profit and stop-loss mechanisms, while also exiting trades when technical indicators reverse, aiming to capture medium to short-term price movements.
Strategy Principles
The core principle of this strategy is to filter low-quality signals through multiple confirmation conditions, primarily including the following key components:
-
Multi-Timeframe MACD Crossover Signals:
- Using MACD(12,26,9) on 30-minute charts to identify primary entry signals
- Optionally using 1-hour MACD trend as a confirmation condition
-
RSI Overbought/Oversold Filtering:
- Long positions require 30-minute RSI > 55
- Short positions require 30-minute RSI < 45
- 1-hour RSI serves as additional trend confirmation
-
Dual VWAP Price Position Confirmation:
- Long entries require price to be simultaneously above both 30-minute and 1-hour VWAPs
- Short entries require price to be simultaneously below both 30-minute and 1-hour VWAPs
-
Volatility Filter:
- Using ATR(14) on 30-minute charts compared to its 20-period moving average
- Only entering trades when current volatility is greater than or equal to its average value, avoiding false signals in low-volatility environments
-
Multi-Level Exit Mechanism:
- Fixed percentage take-profit (1.5%) and stop-loss (0.5%)
- Exit on 30-minute MACD reverse crossover
- Exit on 1-hour MACD trend reversal
Through this multi-level condition filtering and confirmation, the strategy aims to capture medium to short-term movements with clear directionality, while filtering out low-quality signals to improve win rate and risk-reward ratio.
Advantages Analysis
-
Multi-Timeframe Confirmation: By combining signals from 30-minute and 1-hour timeframes, the strategy can better identify genuine trends and reduce the impact of false signals. The 1-hour MACD trend confirmation feature is particularly helpful in avoiding counter-trend trading.
-
Volatility Adaptability: The ATR volatility filter ensures that the strategy only enters trades when the market has sufficient momentum, avoiding trading in low-volatility ranges, which effectively reduces the risk of sideways oscillation.
-
Flexible Exit Mechanism: The strategy includes not only fixed take-profit and stop-loss levels but also dynamic exit mechanisms based on indicator reversals, allowing for timely exits when the market begins to reverse before reaching the take-profit level, thereby protecting profits.
-
Dual Price Position Confirmation: Requiring price to be simultaneously above (for longs) or below (for shorts) VWAPs in two timeframes further confirms price momentum and direction, reducing false breakouts.
-
Built-in Risk Management: The strategy incorporates stop-loss mechanisms and position sizing (default 5% of account equity per trade), which helps control risk exposure for each trade and protects capital.
Risk Analysis
-
Low Win Rate Challenge: As noted in the code comments, the strategy may face a low win rate issue. This is because while multiple condition filtering improves signal quality, it also significantly reduces trading frequency, resulting in a smaller sample size with limited statistical significance.
-
Parameter Sensitivity: The strategy uses multiple adjustable parameters, including MACD lengths, RSI thresholds, and ATR filter parameters. Small changes in these parameters may significantly impact strategy performance, posing a risk of over-optimization.
-
Limitations of Fixed Percentage Take-Profit/Stop-Loss: Using the same take-profit (1.5%) and stop-loss (0.5%) ratios for all market environments may not adapt to different volatility conditions. In high-volatility markets, the stop-loss may be too tight; in low-volatility markets, the take-profit may be too distant.
-
Multi-Timeframe Lag: Using signals from longer timeframes (such as 1-hour) as confirmation may introduce lag, causing missed entry opportunities or delayed exits.
-
Lack of Market Environment Adaptability: The strategy does not include mechanisms to differentiate between different market environments (trending/ranging), which may lead to poor performance under certain market conditions.
Solutions:
- Consider introducing adaptive take-profit/stop-loss mechanisms based on ATR or other volatility indicators
- Add market environment recognition modules to adjust strategy parameters or trading logic under different conditions
- Implement more rigorous backtesting and forward testing validation to avoid over-optimization
- Consider adding trading filters, such as time filters or trend strength filters, to further improve signal quality
Optimization Directions
-
Dynamic Take-Profit/Stop-Loss Optimization: Change the fixed percentage take-profit/stop-loss to dynamic values based on ATR, for example, using 1.5×ATR as stop-loss and 3×ATR as take-profit. This allows the strategy to better adapt to different market volatility environments, providing looser stops in high-volatility periods and tighter profit targets in low-volatility periods.
-
Market Environment Classification: Introduce market environment recognition mechanisms to distinguish between trending and ranging markets. ADX, Bollinger Band width, or the relationship between price and long-term moving averages can be used to identify market states and adjust strategy parameters or even completely switch trading logic accordingly.
-
Entry Timing Optimization: The current strategy enters on the current candle when a MACD crossover occurs, potentially facing slippage or execution delays. Consider entering at the open of the next candle after crossover confirmation, or setting limit orders to enter at specific price zones for better execution prices.
-
Time Filter: Add trading time filters to avoid specific inefficient trading sessions. For example, avoid trading during the end of the Asian session or the European-American transition periods when liquidity may be lower or volatility irregular.
-
Indicator Parameter Adaptability: Design MACD, RSI, and ATR parameters as adaptive values that automatically adjust based on recent market volatility or cyclicality. For example, use shorter MACD parameters in high-volatility markets and longer parameters in low-volatility markets.
-
Signal Strength Grading: Establish a strength scoring system for entry signals based on multiple factors (such as MACD histogram size, RSI deviation, VWAP distance, etc.) to score signals, only executing trades with strength exceeding specific thresholds, or dynamically adjusting position size based on signal strength.
-
Machine Learning Enhancement: Introduce machine learning models to predict which signals are more likely to generate profitable trades, training models to identify the most valuable pattern combinations based on historical data. This can improve the strategy's adaptability and win rate.
These optimization directions aim to enhance the strategy's robustness, adaptability, and long-term performance while maintaining its core logic. Through these improvements, the strategy can better respond to changes in different market environments and conditions.
Summary
The Multi-Timeframe MACD-RSI Crossover Volatility-Filtered Quantitative Trading Strategy is a comprehensively designed trading system that identifies high-quality trading opportunities by combining multiple technical indicators and signals from multiple timeframes. The core advantages of this strategy lie in its multi-level signal confirmation mechanism and built-in risk management features, enabling it to capture price movements while controlling risk.
Despite the challenge of a relatively low win rate, the strategy maintains a positive expected value by increasing the average profit of winning trades. By implementing the suggested optimization measures, particularly dynamic take-profit/stop-loss, market environment classification, and signal strength grading, strategy performance can be further enhanced.
This strategy is suitable for medium to short-term traders, especially those seeking a systematic trading approach based on technical analysis who value risk management. The strategy's multi-condition confirmation mechanism, while reducing trading frequency, improves the quality of each trade, aligning with the trading philosophy that "less is more," emphasizing quality over quantity.
In practical application, it is recommended that traders first test this strategy in a simulated environment, particularly testing the effects of various optimization measures, before cautiously applying it to live trading. Meanwhile, continuously monitoring changes in market conditions and adjusting strategy parameters accordingly will help maintain stable long-term performance.
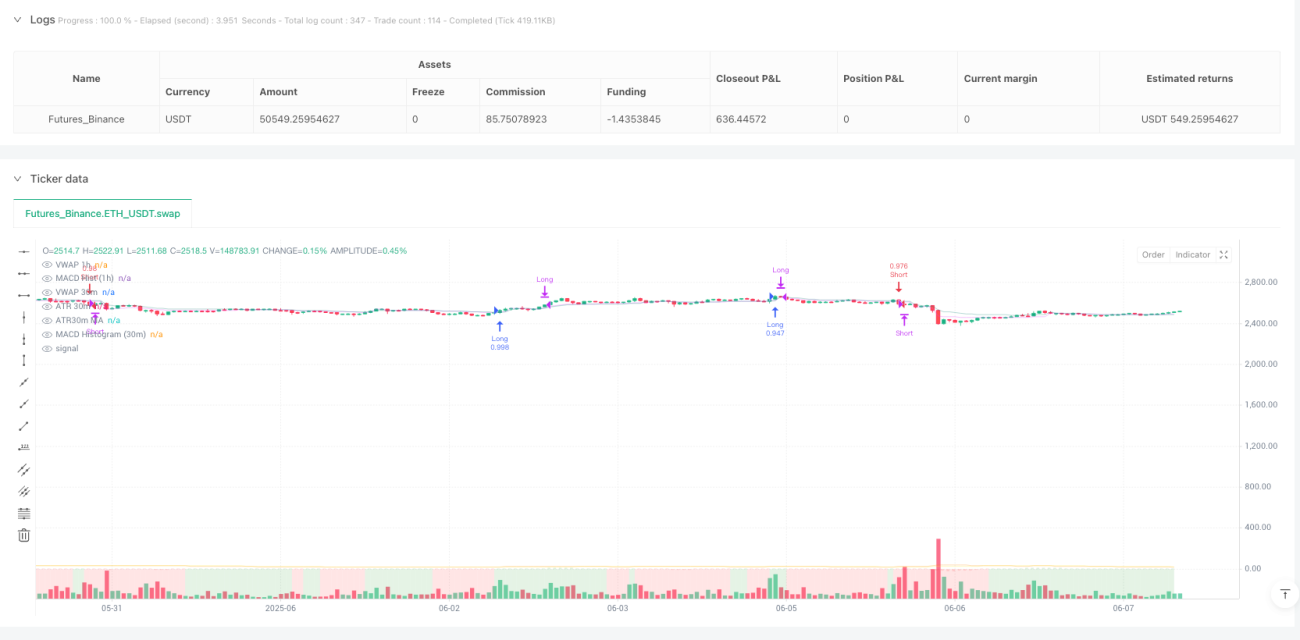
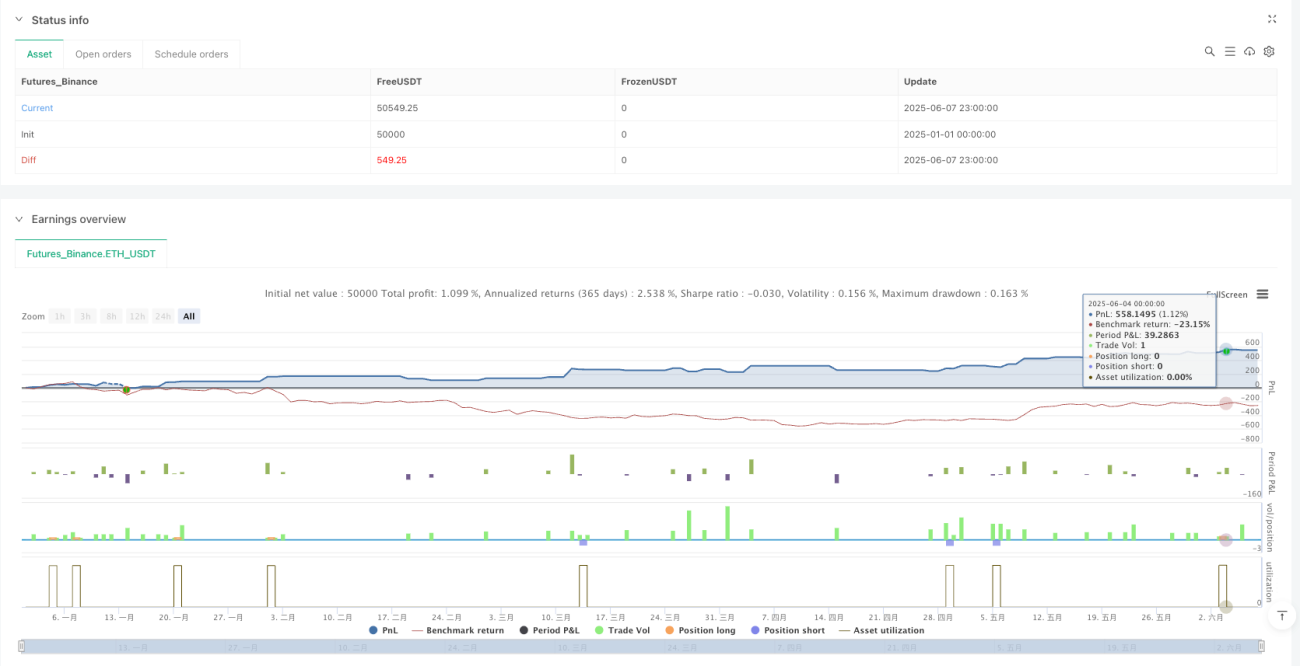
/*backtest
start: 2025-01-01 00:00:00
end: 2025-06-08 00:00:00
period: 1h
basePeriod: 1h
exchanges: [{"eid":"Futures_Binance","currency":"ETH_USDT"}]
*/

// This Pine Script® code is subject to the terms of the Mozilla Public License 2.0 at https://mozilla.org/MPL/2.0/
// © GentlemanOfTrading

//@version=6- 1