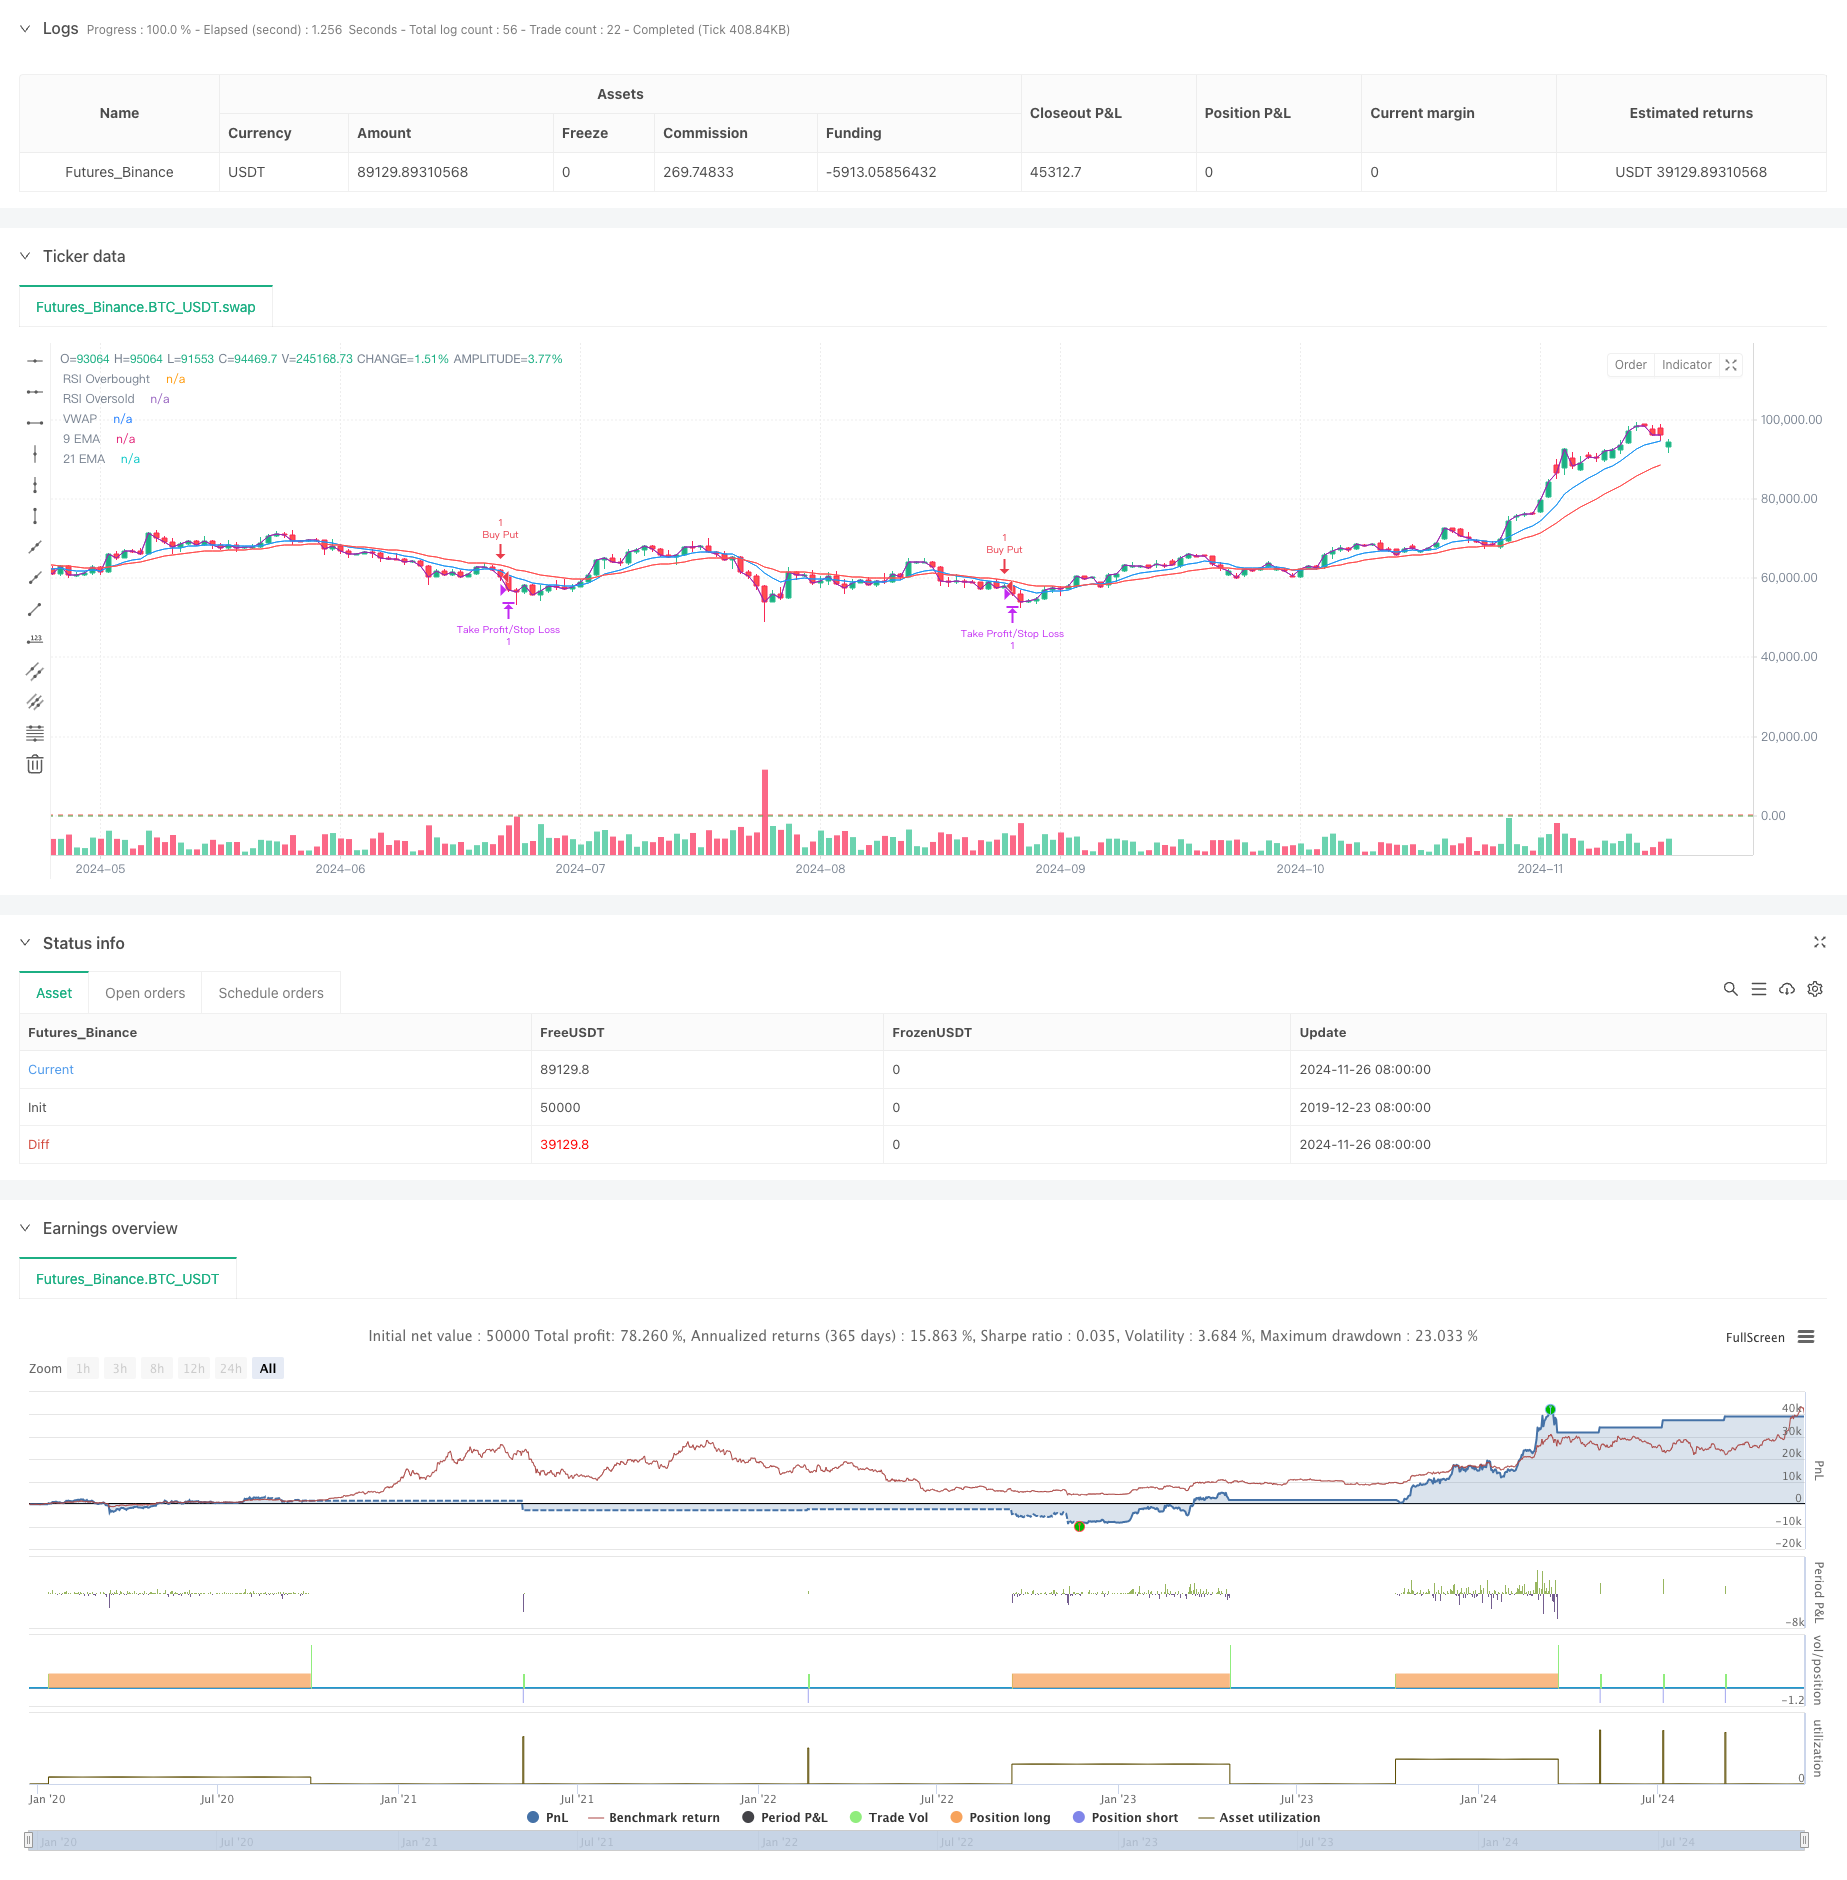
概述
本策略是一个基于多重技术指标的高频交易系统,采用5分钟时间框架,结合了均线系统、动量指标和成交量分析。该策略通过动态调整的方式来适应市场波动,利用多重信号确认来提高交易的准确性和可靠性。策略的核心在于通过多维度的技术指标组合来捕捉短期市场趋势,同时运用动态止损来控制风险。
策略原理
策略采用双均线系统(9周期和21周期EMA)作为主要趋势判断工具,并结合RSI指标进行动量确认。当价格位于双均线之上且RSI处于40-65区间时,系统会寻找做多机会;当价格位于双均线之下且RSI处于35-60区间时,系统会寻找做空机会。同时,策略引入了成交量确认机制,要求当前成交量需要大于20周期移动平均成交量的1.2倍。VWAP的使用则进一步确保了交易方向与日内主流趋势保持一致。
策略优势
- 多重信号确认机制显著提高了交易的可靠性
- 动态止盈止损设置能够适应不同市场环境
- 采用较为保守的RSI阈值,避免在极端区域交易
- 成交量确认机制有效过滤了虚假信号
- VWAP的使用帮助确保交易方向与主流资金一致
- 快速响应的均线系统适合捕捉短期市场机会
策略风险
- 在横盘震荡市场可能产生频繁的假信号
- 多重条件的限制可能导致错过部分交易机会
- 高频交易可能面临较高的交易成本
- 在市场快速转向时可能反应较慢
- 对行情数据的实时性要求较高
策略优化方向
- 引入自适应的参数调整机制,使策略能够根据市场状态动态调整指标参数
- 增加市场环境识别模块,在不同市场条件下采用不同的交易策略
- 优化成交量过滤条件,可考虑使用相对成交量或者成交量剖面分析
- 完善止损机制,可以考虑加入追踪止损功能
- 增加交易时间过滤,避开波动较大的开盘和收盘时段
总结
该策略通过多重技术指标的组合使用,构建了一个相对完整的交易系统。策略的优势在于其多维度的信号确认机制和动态的风险控制方法。虽然存在一些潜在风险,但通过合理的参数优化和风险管理,策略仍具有较好的应用价值。建议交易者在实盘使用前进行充分的回测,并根据具体市场情况进行适当的参数调整。
策略源码
/*backtest
start: 2019-12-23 08:00:00
end: 2024-11-27 00:00:00
period: 1d
basePeriod: 1d
exchanges: [{"eid":"Futures_Binance","currency":"BTC_USDT"}]
*/

//@version=5
strategy("Optimized Nifty MidCap Select Options 5-min Intraday Strategy", overlay=true)

// Parameters
emaShortPeriod = input.int(9, title="Short EMA")
emaLongPeriod = input.int(21, title="Long EMA")
rsiPeriod = input.int(14, title="RSI Period")
rsiOverbought = input.int(65, title="RSI Overbought Level") // More conservative than 70
rsiOversold = input.int(35, title="RSI Oversold Level") // More conservative than 30
atrLength = input.int(14, title="ATR Length")
atrMultiplier = input.float(1.5, title="ATR Multiplier")
volumeMultiplier = input.float(1.2, title="Volume Multiplier") // For confirming high-volume trades

// EMA Calculation
emaShort = ta.ema(close, emaShortPeriod)
emaLong = ta.ema(close, emaLongPeriod)

// RSI Calculation
rsiValue = ta.rsi(close, rsiPeriod)

// ATR Calculation
atrValue = ta.atr(atrLength)

// VWAP Calculation
vwapValue = ta.vwap(close)

// Volume Check
volumeCondition = volume > ta.sma(volume, 20) * volumeMultiplier

// Define long and short conditions

// Long Condition:
// Price above both EMAs, RSI not overbought, price above VWAP, and high volume
longCondition = (close > emaShort) and (close > emaLong) and (rsiValue > 40 and rsiValue < rsiOverbought) and (close > vwapValue) and volumeCondition

// Short Condition:
// Price below both EMAs, RSI not oversold, price below VWAP, and high volume
shortCondition = (close < emaShort) and (close < emaLong) and (rsiValue < 60 and rsiValue > rsiOversold) and (close < vwapValue) and volumeCondition

// Entry logic
if (longCondition)
    strategy.entry("Buy Call", strategy.long)
if (shortCondition)
    strategy.entry("Buy Put", strategy.short)

// Dynamic Take Profit and Stop Loss based on ATR
takeProfitLevel = strategy.position_avg_price * (1 + atrValue * atrMultiplier / 100)
stopLossLevel = strategy.position_avg_price * (1 - atrValue * atrMultiplier / 100)

// Exit strategy based on ATR levels
strategy.exit("Take Profit/Stop Loss", from_entry="Buy Call", limit=takeProfitLevel, stop=stopLossLevel)
strategy.exit("Take Profit/Stop Loss", from_entry="Buy Put", limit=takeProfitLevel, stop=stopLossLevel)

// Plotting indicators
plot(emaShort, title="9 EMA", color=color.blue)
plot(emaLong, title="21 EMA", color=color.red)
hline(rsiOverbought, "RSI Overbought", color=color.red)
hline(rsiOversold, "RSI Oversold", color=color.green)
plot(vwapValue, title="VWAP", color=color.purple)
相关推荐