
This strategy is intended solely for quantitative research and software design discussion. It does not constitute investment advice. DCA can accumulate exposure during one-way markets, and stop-loss orders cannot eliminate the risks of gaps, liquidation, poor liquidity, or exchange failures.
1. Three Problems with Fixed Grids in Live Trading
A fixed grid looks intuitive: add another layer whenever price falls by a fixed percentage, then close all layers together after a rebound. The problem is that market volatility is constantly changing, so the same spacing rarely remains effective for long.
The first problem is distorted grid spacing. During a low-volatility phase, ETH may fail to move even 1% for several days, so a grid that is too wide may barely trade. During an event-driven market, however, price can move several percentage points within minutes, making the same grid far too dense and causing every layer to fill in a very short time.
The second problem is that the “averaging rule” often has no explicit total budget. Some implementations define only how much larger each layer should be than the previous one, without locking in the maximum capital commitment before the cycle starts. During a continuous decline, the strategy may appear to be lowering its average entry price, while in reality it is continuously expanding an unaffordable tail-risk exposure.
The third problem is that orders and positions can become disconnected. Partial fills, unconfirmed cancellations, process restarts, or manual intervention can leave old orders active on the exchange. If the program simply creates a new grid from the latest signal, it may produce ghost orders, duplicate exits, or accidentally take over an external position.
The value of D-Man V3 is that it places all three problems inside a single cycle-management framework: Bollinger Bands define the current volatility scale, the DCA budget is fixed before entry, and all filled layers exit as one basket. The engineering implementation then uses order ownership and a persistent state machine to handle abnormal paths. This article presents a practical Rust implementation for FMZ.
2. What Exactly Is Dynamic About D-Man V3?
This implementation is based on Hummingbot’s publicly available directional_trading.dman_v3 framework. It is not simply a “buy more when price falls and sell when it rises” strategy. Instead, Bollinger Bands perform two separate tasks:
- Bollinger Band percentage identifies whether price has entered a statistical extreme region.
- Bollinger Band width determines how far each DCA level should be placed from the anchor price.
This means that grid spacing is no longer fixed. The grid contracts automatically in low-volatility conditions and expands in high-volatility conditions.
3. Calculating the Bollinger Reversal Signal from Closed Candles Only
Let the Bollinger middle, upper, and lower bands be Middle, Upper, and Lower:
text
BB% = (Close - Lower) / (Upper - Lower)
The meaning of BB% is straightforward:
0corresponds to the lower band.0.5corresponds to the middle band.1corresponds to the upper band.- A value below
0means the candle closed below the lower band. - A value above
1means the candle closed above the upper band.
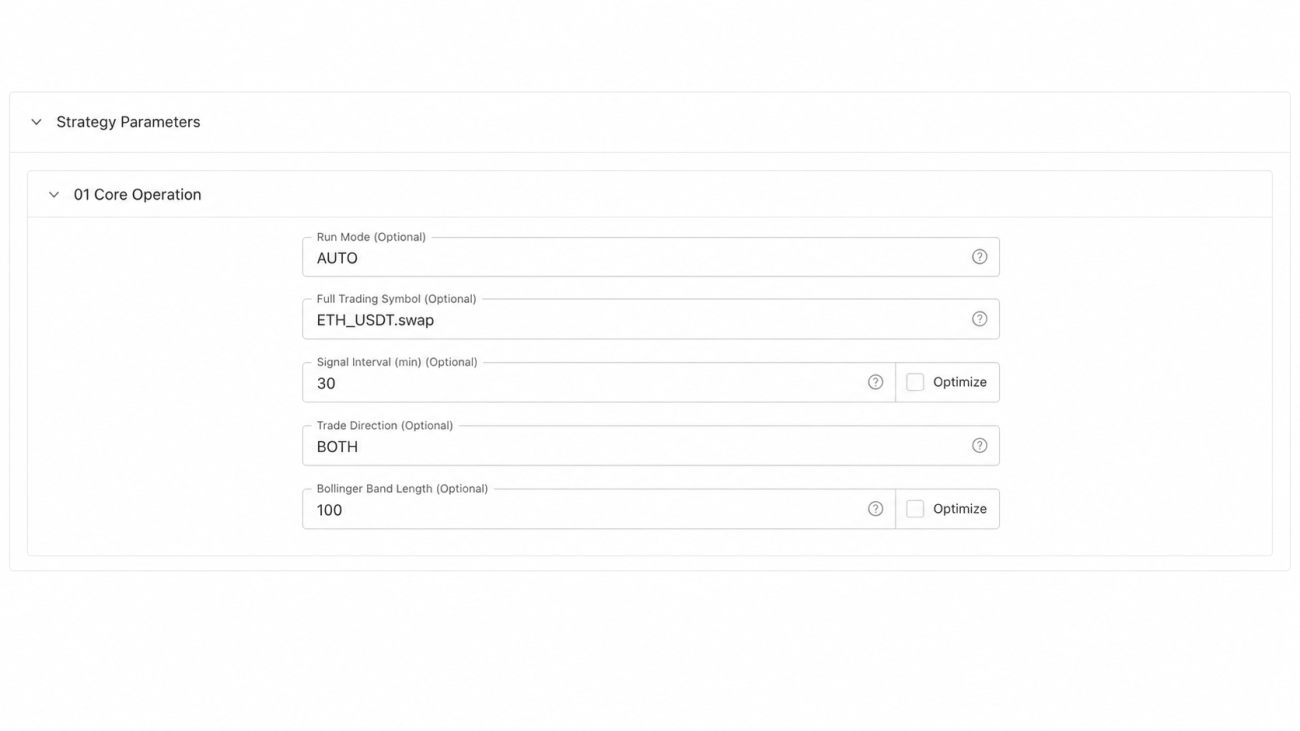
The practical version exposes only BBLength in the interface. The remaining signal rules are fixed as tested internal constants:
            text

            Interface parameter: BBLength = 100
Internal rules: BB_STD = 2.0, LONG_THRESHOLD = 0, SHORT_THRESHOLD = 1
Internal rule: REQUIRE_CROSS = true
FMZ’s GetRecords(symbol, period, limit) function can request candlestick data directly for a specified contract and timeframe. The Rust implementation uses the second-to-last candle as the current closed candle; the last candle, which is still forming, does not participate in signal generation.
FMZ documentation: https://www.fmz.com/syntax-guide/fun/market/exchange.getrecords
The signal function itself is small:
rust
fn detect_signal(
current: &Bands,
previous: &Bands,
long_threshold: f64,
short_threshold: f64,
require_cross: bool,
) -> i32 {
let mut long_now = current.bbp <= long_threshold;
let mut short_now = current.bbp >= short_threshold;
if require_cross {
long_now = long_now && previous.bbp > long_threshold;
short_now = short_now && previous.bbp < short_threshold;
}
if long_now && !short_now {
1
} else if short_now && !long_now {
-1
} else {
0
}
}
The “first crossing” rule is important. If price remains outside the lower band for several consecutive candles, a mean-reversion strategy should not start a new cycle on every candle. This filter cannot determine when a trend will end, but it can prevent repeated exposure from growing without limit.
4. Bollinger Half-Width Defines the DCA Grid Scale
First calculate the raw Bollinger half-width as a percentage of the middle band, then clamp it to the dynamic scale actually used by the strategy:
            text

            HalfWidthRatio = (Upper - Lower) / (2 × Middle)
ScaleRatio = clamp(HalfWidthRatio, 0.2%, 8%)
Using the latest traded price when the signal appears as the anchor:
            text

            LongPrice[i]  = AnchorPrice × (1 - Factor[i] × ScaleRatio)
ShortPrice[i] = AnchorPrice × (1 + Factor[i] × ScaleRatio)
The baseline uses four distance factors:
            text

            0.05, 0.35, 0.75, 1.25
Suppose ETH is trading at 3,000 USDT and the Bollinger half-width is 2% when the signal appears. The approximate long-side plan is:
| Level | Factor | Distance from Anchor | Theoretical Price |
|---|---|---|---|
| L1 | 0.05 | 0.10% | 2,997 |
| L2 | 0.35 | 0.70% | 2,979 |
| L3 | 0.75 | 1.50% | 2,955 |
| L4 | 1.25 | 2.50% | 2,925 |
ScaleRatio corresponds to scale_ratio in the Rust source code. The upper and lower bounds serve two purposes. In a very narrow-band environment, several theoretical prices may collapse to the same value after tick-size quantization. In an extreme-volatility environment, the grid may otherwise expand so far that it loses practical execution value.
Price quantization is not ordinary rounding:
            rust

            fn round_price(runtime: &Runtime, price: f64, buy: bool) -> f64 {
    round_decimals(
        quantize(
            price,
            runtime.market.price_step,
            !buy, // round buy orders down and sell orders up
        ),
        decimal_places(
            runtime.market.price_step,
            runtime.market.price_precision,
        ),
    )
}
Buy orders are rounded down and sell orders are rounded up, preventing quantization from pushing orders to a more aggressive price. Prices across all configured layers must remain strictly monotonic. If any two layers quantize to the same price, the entire cycle is rejected.
5. A Budget Cap Matters More Than the “Averaging Multiplier”
Dynamic DCA is often misunderstood as unlimited averaging. In this implementation, the maximum budget is fixed when the cycle is created:
            text

            CycleBudget = min(
    TotalCycleQuote,
    AccountEquity × MaxCycleEquityPct
)
The default capital weights are:
            text

            1, 1, 1.5, 2.5
The four default layers therefore receive approximately 16.67%, 16.67%, 25%, and 41.66% of the cycle budget. Deeper levels receive more capital, but the strategy never adds temporary layers beyond the configured set, nor does it expand the total budget after a loss.
For FMZ futures interfaces, amount usually represents contract quantity rather than a USDT notional value. A quote-currency budget therefore cannot be passed directly to the order function. The Rust implementation reads the following fields from GetMarkets():
TickSize / AmountSizePricePrecision / AmountPrecisionMinQty / MaxQtyMinNotional / MaxNotionalCtVal / CtValCcy
It then converts the quote-currency budget into a contract quantity.
FMZ documentation: https://www.fmz.com/syntax-guide/fun/market/exchange.getmarkets
The core planning logic can be simplified as follows:
            rust

            let scale_ratio = clamp(
    bands.half_width_ratio,
    DCA_SCALE_MIN_PCT / 100.0,
    DCA_SCALE_MAX_PCT / 100.0,
);

let budget = TotalCycleQuote.min(
    equity * MaxCycleEquityPct / 100.0,
);

for (spread, weight) in spreads.iter().zip(weights.iter()) {
    let raw_price = if signal == 1 {
        anchor_price * (1.0 - spread * scale_ratio)
    } else {
        anchor_price * (1.0 + spread * scale_ratio)
    };

    let quote = budget * weight / weight_total;
    let amount = amount_from_quote(runtime, quote, raw_price)?;
    // Then validate price, quantity, and notional constraints.
}
If any single layer falls below the minimum quantity, exceeds the maximum quantity, or violates a notional constraint, the program rejects the entire cycle rather than leaving behind an incomplete plan.
6. Exit All Filled Layers as One Basket
Not every DCA layer will necessarily fill. Managing take-profit separately for each layer can easily leave fragmented positions and isolated orders. This implementation instead uses the average position price returned by the exchange and merges all filled layers into a single basket.
The dynamic exit distances use the same ScaleRatio fixed when the signal appeared:
            text

            Stop-loss distance          = 3.00 × ScaleRatio
Take-profit distance        = 1.00 × ScaleRatio
Trailing activation level   = 0.80 × ScaleRatio
Trailing pullback allowance = 0.25 × ScaleRatio
The strategy also supports the following exit conditions:
- Exit when price returns to the middle band and basket profit is no lower than the internal constant
MIN_PROFIT_PCT=0.15%. - Exit after holding for more than
MaxHoldingBars. - After the internal trailing-profit activation level is reached, calculate the permitted pullback using
ScaleRatio.
Returns for long and short positions must be calculated separately:
            rust

            fn position_return(position: &PositionView, price: f64) -> f64 {
    if position.price <= 0.0 {
        0.0
    } else if position.side == 1 {
        price / position.price - 1.0
    } else {
        1.0 - price / position.price
    }
}
If a short position also uses price / entry - 1, a price increase would incorrectly appear as a profit. Directional mistakes of this kind are well suited to being locked down with Rust unit tests.
7. From Signal to Exit: Treat Each Trade as a Complete Cycle
A reliable DCA strategy cannot treat “order submitted successfully” as its only state. Orders may be partially filled, requests may time out, and the strategy process may terminate after an order has already reached the exchange. The Rust implementation therefore models each reversal trade as a complete cycle:
            text

            IDLE
  -> PLACING
  -> ACTIVE
  -> CANCELING_FOR_EXIT
  -> SUBMITTING_EXIT
  -> EXITING
  -> IDLE
Before entry, the strategy first persists the PLACING state and the layer currently waiting to be submitted. Only after receiving a valid order ID is the order formally attached to the cycle. If a request has been sent but no order ID is returned, the strategy pauses instead of assuming failure and submitting the order again.
The exit path also follows a strict sequence: stop increasing exposure, cancel the remaining DCA entry orders, confirm that cancellation has completed, and then submit one basket-closing order based on the actual position size returned by the exchange. The cycle ends only after the position has been confirmed as zero twice in succession.
Order IDs are persisted together with the cycle. After a restart, the strategy restores order ownership before reconciling open orders and positions. If it finds an order that cannot be proven to belong to the current cycle, or if the actual position direction does not match the cycle direction, it enters HALT and waits for manual intervention. This conservative design sacrifices some automatic recovery capability in exchange for avoiding blind order resubmission.
8. The Core Parameters That Are Actually Worth Adjusting
More parameters do not automatically make a strategy more professional. For this strategy, the settings that truly affect behavior can be grouped into four categories: signal speed, cycle budget, DCA shape, and exit scale.
| Decision | Main Parameters and Defaults | Problem Addressed |
|---|---|---|
| Signal scale | SignalPeriodMinutes=15, BBLength=100 | Signal frequency, statistical window, and response speed |
| Cycle budget | TotalCycleQuote=1000, MaxCycleEquityPct=10% | Caps the fixed commitment and its share of account equity |
| DCA shape | DcaSpreadFactors=0.05,0.35,0.75,1.25, DcaAmountWeights=1,1,1.5,2.5 | Determines layer placement and budget distribution |
| Price exits | StopLossBandFactor=3, TakeProfitBandFactor=1 | Defines basket stop-loss and take-profit with the same volatility scale |
| Time exit | MaxHoldingBars=192 | Terminates a cycle when mean reversion takes too long |
Parameter tuning should respect these dependencies. SignalPeriodMinutes and BBLength jointly determine the real-time span covered by the statistical window. DCA distances and capital weights should be adjusted together. The fixed quote budget and equity percentage jointly determine the actual capital cap. Take-profit and stop-loss multipliers are both based on the same dynamic volatility scale.
Rules such as the Bollinger standard deviation, first-crossing requirement, bandwidth filter, upper and lower DCA scale limits, order lifetime, cooldown period, and trailing-profit logic remain fixed. This removes a large number of difficult-to-explain parameter combinations. A rule should be exposed separately only when it is the explicit subject of a research experiment.
9. Which Markets Suit It, and Which Markets Are Dangerous?
D-Man V3 remains, at its core, a mean-reversion strategy. It is best suited to liquid markets where volatility repeatedly expands and contracts and price often returns from outside the bands toward the middle band. A dynamic grid can adapt to changes in volatility scale, but it cannot determine whether a breakout is false or the beginning of a new trend.
The most dangerous environment is a persistent one-way market. As price moves farther away, deeper DCA layers bring the average entry closer to the market, but they also concentrate notional exposure at the point of greatest risk. A budget cap can limit the amount committed, but it cannot turn a negative-expectancy countertrend trade into a safe trade.
The second source of risk is a sudden volatility regime shift. Bollinger half-width is calculated from the historical window around the signal, while an event-driven market may instantly move future volatility into an entirely different range. Even with a stop-loss, actual execution may deviate significantly because of slippage, liquidity, or exchange constraints.
The third source of risk is cost erosion. Four entry layers, cancellations, and a basket exit all incur fees. Perpetual contracts may also incur funding costs. If the target profit per cycle is too small, execution costs can easily consume the gross profit.
10. What Should a Backtest Actually Answer?
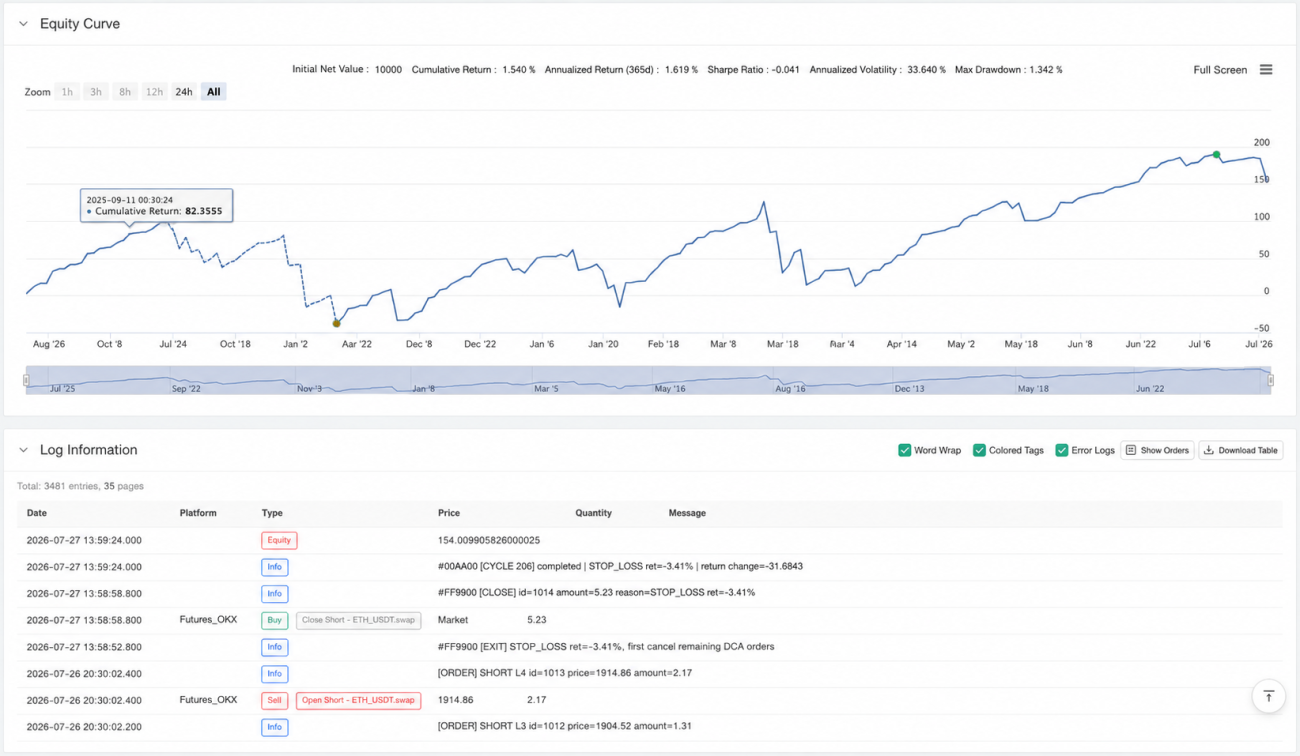
For a DCA strategy, final net profit alone is far from sufficient. A more useful approach is to split the backtest into independent cycles and observe how the strategy uses capital under different market regimes.
At minimum, the following metrics should be recorded:
- Maximum capital committed and maximum margin usage per cycle.
- Trigger rate and fill contribution of each DCA layer.
- Maximum adverse excursion and final profit or loss for each cycle.
- Longest holding period and the proportion of time-based exits.
- Number of consecutive losing cycles.
- Fees, slippage, and funding costs as a percentage of gross profit.
- The contribution of stop-loss, take-profit, trailing-profit, middle-band, and time-based exits.
The sample should also be divided by market regime instead of testing only one long period:
| Scenario | Primary Questions |
|---|---|
| Low-volatility range | Is the grid too narrow, and can profits cover costs? |
| High-volatility oscillation | Are dynamic distances effective, and do deeper layers trigger too often? |
| Persistent rise or decline | Do the drawdown limit, stop-loss, and budget cap actually work? |
| Event-driven jump | What is the impact of slippage, gaps, and unfilled exit orders? |
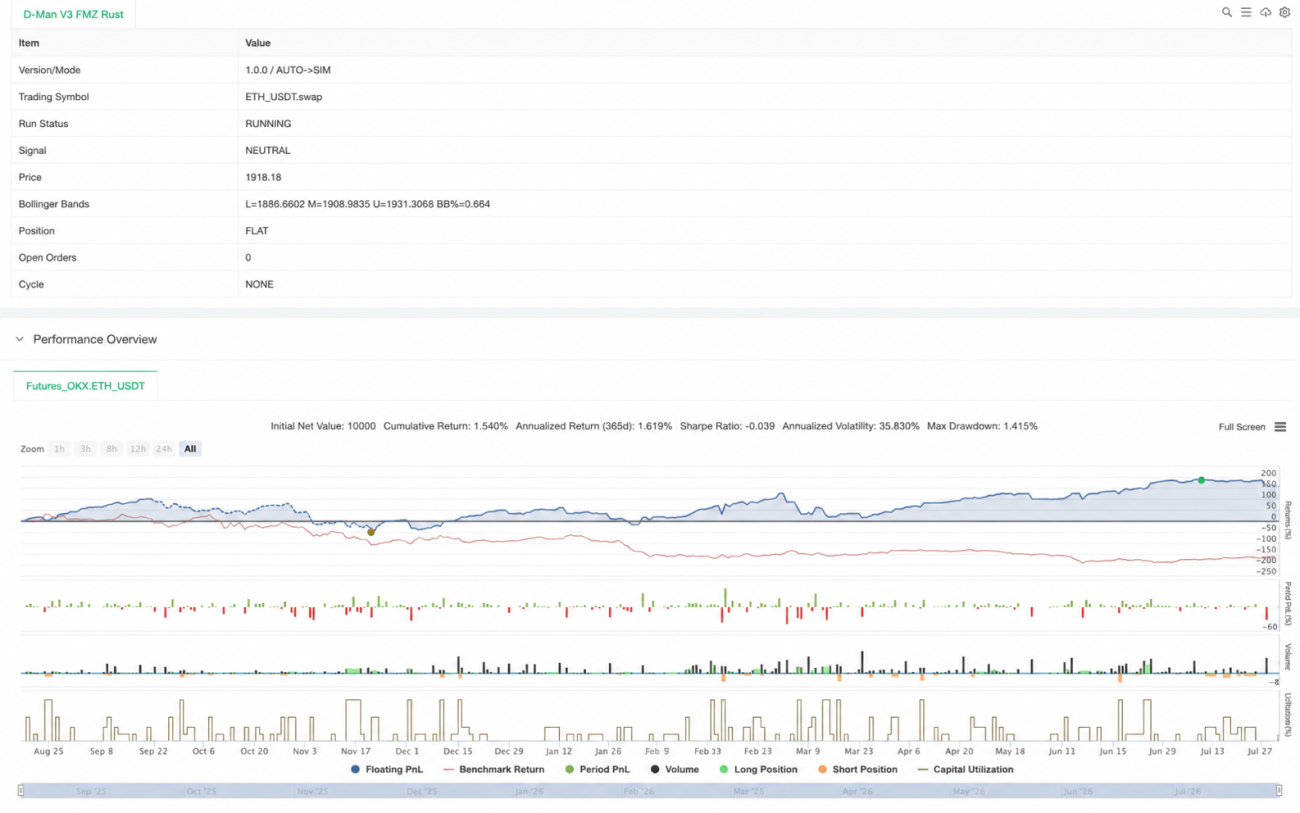
Parameter sensitivity analysis should come last. If only one highly specific parameter set is profitable while nearby values all fail, the result usually depends on sample coincidence rather than a stable mechanism.
11. Engineering Reliability Is Part of the Strategy
The mean-reversion formula is short, but the live-trading path is long. Partial fills, failed order queries, cancellation delays, process restarts, and manual orders can all change the real risk. This strategy therefore enforces several boundaries:
- Manage only one active cycle per symbol at a time.
- Do not automatically take over positions or open orders whose ownership cannot be proven.
- Do not blindly resend a request when its outcome is uncertain.
- Cancel all remaining entry orders before exiting.
- Close the actual position size rather than the planned quantity.
- Leverage and position mode must be defined in advance and should not be treated as strategy parameters to optimize.
These rules do not improve the signal win rate, but they reduce the gap between “the backtest formula is correct” and “live orders are out of control.” For a strategy that increases exposure layer by layer, this reliability is itself part of risk management.
12. Conclusion
The core of D-Man V3 can be summarized in three sentences: BB% identifies statistical extremes, Bollinger half-width defines the DCA scale, and all filled layers exit as one basket based on the average position price.
Compared with a fixed grid, it adapts better to changes in volatility and uses a cycle budget to prevent unlimited averaging. However, it still cannot eliminate the tail risk of mean reversion during a persistent trend. Whether the strategy can remain usable over the long term depends not only on the entry formula, but also on budget constraints, execution costs, state recovery, and conservative handling of abnormal orders.
When evaluating this type of strategy, “how much it earned” should come only after “how much capital it used,” “how much adverse movement it endured,” and “under which market conditions it failed.” The value of dynamic DCA is not that it predicts every reversal, but that it makes the risk path as clear as possible both when the reversal hypothesis succeeds and when it fails.
Thank you for reading.
- 1