

This article focuses on the contract-selection problem in directional options trading: once you already have a bullish or bearish view, how do you choose the contract that best expresses that view from an entire option chain spanning different expiries, strikes, and exchanges?
The thresholds and examples in this article are for explaining the methodology only. They are not fixed parameters or investment advice. API fields and trading rules should always follow the latest official exchange documentation. Information in this article was checked in August 2026.
Many people approach options for the first time with a very simple idea:
If you are bullish, buy a Call.
If you are bearish, buy a Put.
As long as the direction is right, the option should make money.
After trading options a few times, however, you quickly discover that reality is not that simple.
BTC may rise while the Call you bought barely moves. ETH may fall while your Put is still losing money. In a more extreme case, you may even get both the direction and the magnitude roughly right, yet still lose because time value decays, implied volatility collapses, and the bid-ask spread eats away the rest.
The reason is not mysterious.
Over a short horizon, the change in an option's value can be approximated as:
\[ \Delta V \approx \Delta\cdot\Delta S +\frac{1}{2}\Gamma(\Delta S)^2 +Vega\cdot\Delta IV +\Theta\cdot\Delta t -\text{Trading Costs} \]
Direction determines only part of the first term.
What you are really buying is a bundle of Delta, Gamma, Vega, Theta, and liquidity exposure.
That is why I prefer to split options trading into two layers:
The first layer answers:
Where are BTC or ETH likely to go next?
The second layer answers:
Which option should I use to express that view?
This article focuses only on the second layer.
I organize the problem into a four-dimensional selection framework:
- Convexity: Delta, Gamma, and Speed — which Strike should I choose?
- Timing: DTE, IV Term Structure, Basis/Funding — which Expiry should I choose?
- Valuation: IV Smile / Skew / Surface — is this option expensive or cheap?
- Execution: Spread, Depth, OI, Volume — can the theoretical edge actually be executed?
Finally, Deribit, Binance Options, and OKX Options are placed into the same candidate pool for cross-venue comparison.
Because this is a selector strategy designed mainly for research, analysis, and testing, the implementation directly calls public exchange APIs.
javascript
function httpJson(url, source) {
var raw = null
try {
G.requestCount++
raw = HttpQuery(url, {
method: "GET",
timeout: G.cfg.requestTimeoutMs,
headers: {"User-Agent": "FMZ-Four-Dimensional-Option-Selector/1.0"}
})
if (!raw) throw "Empty response"
var parsed = typeof raw === "string" ? JSON.parse(raw) : raw
if (parsed && parsed.error) throw JSON.stringify(parsed.error)
if (parsed && parsed.code !== undefined && String(parsed.code) !== "0" && !Array.isArray(parsed)) {
throw "code=" + parsed.code + ", msg=" + safeText(parsed.msg)
}
return parsed
} catch (e) {
throw source + " request failed: " + e + ", url=" + url
} finally {
Sleep(G.cfg.requestGapMs)
}
}
1. First, Make Data From Three Exchanges Speak the Same Language
This step is more important than the formulas.
Deribit, Binance, and OKX all provide relatively complete options-market data, but their field names, quoting conventions, contract specifications, and Greek conventions are not identical.
If you directly compare values such as gamma, premium, or open interest returned by the three venues, you can easily end up comparing quantities that are not economically equivalent.
At the time this article was checked, the public APIs could be summarized roughly as follows:
| Exchange | Contract List | IV / Greeks | Market Data & Liquidity | Order Book |
|---|---|---|---|---|
| Deribit | public/get_instruments | public/ticker / ticker WebSocket: bid IV, ask IV, mark IV, Delta, Gamma, Theta, Vega, etc. | ticker / public/get_book_summary_by_currency: OI, Volume, Best Bid/Ask | public/get_order_book |
| Binance Options | GET /eapi/v1/exchangeInfo | GET /eapi/v1/mark: bidIV, askIV, markIV, Delta, Gamma, Theta, Vega | GET /eapi/v1/ticker, GET /eapi/v1/openInterest | GET /eapi/v1/depth |
| OKX Options | GET /api/v5/public/instruments?instType=OPTION | GET /api/v5/public/opt-summary: Delta, Gamma, Theta, Vega, BS Greeks, markVol, bidVol, askVol, fwdPx | GET /api/v5/public/open-interest, Market Ticker | GET /api/v5/market/books |
That is already enough to build an automated option selector.
Before feeding the data into the model, however, I would not keep the venue-specific raw structures. I would normalize them into one standard record:
            text

            venue              Deribit / Binance / OKX
underlying         BTC / ETH
symbol             Original contract symbol
expiry             Expiration timestamp
DTE                Days to expiry
option_type        Call / Put
strike             K
forward            F
bid_price_usd      Standardized USD bid value
ask_price_usd      Standardized USD ask value
mid_price_usd      Mid price
bid_iv             Bid IV
ask_iv             Ask IV
mark_iv            Mark IV
delta_norm         Normalized Delta
gamma_norm         Normalized Gamma
theta_norm         Normalized Theta
vega_norm          Normalized Vega
open_interest_usd  Standardized OI
volume_24h_usd     Standardized 24h volume
spread_ratio       Relative bid-ask spread
depth_slippage     Estimated slippage for target notional
quote_age_ms       Quote age
There are two important principles here.
First, normalize prices into a common USD economic value before comparing them.
Premium quotes, contract multipliers, and settlement assets may differ across venues. Seeing 0.02 on one venue and 800 on another does not mean the first contract is cheaper.
Second, I prefer to recalculate the Greeks using one common model.
Exchange-provided Greeks are extremely useful for validation and real-time display, but for cross-venue ranking I would rather use the same Forward, IV, DTE, and pricing model to recompute the Greeks.
At least then, the Delta and Gamma being compared are defined on the same basis.
For crypto options, it is often more natural to compare strikes against the corresponding forward price \(F\), rather than simply using spot \(S\).
A unified moneyness coordinate can therefore be written as:
\[ k=\ln\left(\frac{K}{F}\right) \]
Near ATM:
\[ k\approx0 \]
For an out-of-the-money Call:
\[ k>0 \]
For an out-of-the-money Put:
\[ k<0 \]
Once this variable is available, different strike grids across the three venues can be mapped into the same coordinate system.
2. Dimension One: Delta, Gamma, and Speed — Do Not Buy "Cheap"; Buy Convexity
One of the easiest mistakes in directional options trading is to treat out-of-the-money as equivalent to high payoff potential.
A very deep OTM Call may indeed look cheap, but at the same time it may have:
- very low Delta;
- poor liquidity;
- rapid time decay.
The underlying may rise and the option can still behave as though almost nothing happened.
The question I care about more is:
If BTC moves in my predicted direction, will this option's Delta increase quickly?
Delta is the first-order sensitivity of the option price to the underlying:
\[ \Delta=\frac{\partial V}{\partial S} \]
Gamma is the rate at which Delta changes:
\[ \Gamma=\frac{\partial \Delta}{\partial S} \]
Speed goes one step further:
\[ Speed=\frac{\partial \Gamma}{\partial S} \]
Taken together, these three quantities help describe how an option can move from "not yet following the underlying very much" toward becoming increasingly sensitive to the underlying.
Suppose I buy a BTC Call with a Delta of only 0.18.
Initially, if BTC rises by $100, the first-order price exposure of the option is only about $18 per standardized unit of underlying exposure.
But if BTC continues moving toward the strike, Gamma can increase and Delta may move from:
            text

            0.18
→ 0.25
→ 0.35
→ 0.50
The interesting part is not the number 0.18 by itself.
The important question is whether the Delta path is accelerating.
Do Not Treat Delta = 0.15 as a Magic Number
Many traders favor OTM options with Delta in the 0.10–0.20 range because they often provide attractive leverage characteristics.
But no fixed Delta should be treated as a mathematical law.
The location of the Speed extreme moves with:
- IV;
- DTE;
- Forward;
- Strike;
- model assumptions.
The best region for BTC under low volatility with 30 days to expiry is not necessarily the best region for ETH under high volatility with only 3 days to expiry.
So in the program, I only use Delta as a first-stage candidate filter.
For a bullish view, for example:
            text

            0.10 <= Delta <= 0.30
For a bearish view:
            text

            -0.30 <= Delta <= -0.10
This is not the final answer.
It simply removes contracts that are extremely far out of the money or already too close to behaving like in-the-money options.
After that, I look at Gamma, Speed, and premium cost.
You Do Not Have to Trust the Exchange for Speed — Just Bump the Model
Speed can be calculated analytically, but a finite-difference approximation is often more practical.
Bump Forward slightly upward and downward by a small percentage \(\varepsilon\), then recalculate Gamma:
\[ Speed\approx\frac{\Gamma(F(1+\varepsilon))-\Gamma(F(1-\varepsilon))}{2\varepsilon F} \]
This has an important advantage:
Deribit, Binance, and OKX do not need to provide Speed natively.
As long as we have Strike, DTE, IV, and Forward, we can calculate it ourselves using the same model across all three venues.
I Prefer to Ask: "How Much Convexity Did I Buy per Dollar of Premium?"
Comparing Gamma alone also has a problem.
ATM options often have high Gamma, but they are also expensive.
So we can build a rough but practical convexity-efficiency ranking metric:
\[ GammaEfficiency=\frac{\Gamma F^2}{Premium} \]
This is not a new law of finance.
It is simply a ranking measure:
For each dollar of premium, which contract gives me more second-order exposure?
The goal of the first dimension is therefore not to find the smallest Delta or the largest Gamma.
It is to find a contract where:
Directional exposure has not yet been fully released, Gamma is in a favorable region, Speed has acceleration potential, and convexity is not too expensive relative to premium.
There is another common misconception worth stating explicitly:
A doubling of Delta does not mean the option price doubles.
Delta is a marginal sensitivity, not a price multiplier.
Explosive option behavior emerges from the interaction of:
- continued movement in the underlying;
- Gamma convexity;
- remaining time;
- IV changes.
3. Dimension Two: DTE — Do Not First Ask "How Many Days Should I Buy?" Ask "When Should My View Be Realized?"
Traditional options textbooks often summarize DTE with one sentence:
The closer an option gets to expiration, the faster Theta decays.
That is correct, but it is not enough for real contract selection.
Suppose one view is:
BTC may break out within the next 48 hours.
Another view is:
Risk appetite may continue recovering over the next month.
Both are bullish views, but they should not use the same expiry.
In crypto markets, I combine four groups of information when choosing expiry:
Expected realization horizon + ATM IV term structure + futures basis + perpetual funding
1. Start With Your Own Forecast Horizon
This is one of the most overlooked inputs.
If your model only has directional edge over the next 3–5 days, buying a 90-day option may mean paying for far more long-dated time value than you actually need.
On the other hand, if your thesis requires two weeks to play out but you buy an option expiring tomorrow, you can be directionally correct and still be wiped out by Theta before the move arrives.
The first rule for expiry selection is therefore not:
Near-dated options have more Gamma.
It is:
DTE must cover the forecast horizon, with some additional room for timing error.
Forecasting when something may happen is part of options trading.
2. Then Look at the ATM IV Term Structure
Connect the ATM implied volatility for each expiry and you get the simplest form of volatility term structure.
For example:
            text

            3D ATM IV     78%
7D ATM IV     72%
14D ATM IV    61%
30D ATM IV    58%
60D ATM IV    56%
This tells us that the market is paying a large premium for near-term risk.
If my view is merely "short-term bullish," buying the 3D Call may mean making two bets at the same time:
- buying direction;
- buying very expensive short-term volatility.
Suppose BTC rises, but after the event passes IV falls from 78% to 60%.
The Vega loss can easily consume part of the Delta gain.
That is why DTE selection is not only about Theta management.
It is also about managing the price of volatility across maturities.
3. Use Basis and Funding as Crowding Indicators, Not Direct Directional Signals
One of the major differences between crypto and traditional commodity futures markets is the importance of perpetual contracts and funding rates.
Suppose we observe:
            text

            Persistently high perpetual funding
+
Clearly positive forward basis
+
Expensive near-term Call skew
At minimum, this tells us that bullish positioning is crowded.
Even if I remain bullish, I should ask again:
Am I paying the highest price to express the market's most popular direction?
The opposite is also true.
Very negative funding does not automatically mean we should buy Calls.
Funding and basis can remain extreme for long periods.
They describe:
- positioning demand;
- financing;
- term pricing.
They are not standalone signals that reliably predict direction.
In this framework, they act more like maturity and crowding filters.
What Should the Second Dimension Output?
I would not let the program simply say:
Buy the 7-day option.
Instead, it should calculate a Timing Score for each expiry, incorporating at least:
            text

            Does DTE cover the forecast horizon?
Is Theta / Premium excessively high?
Is ATM IV unusually expensive at this expiry?
Do Basis / Funding indicate excessive directional crowding?
Does this expiry have enough liquidity?
The output should be two or three candidate expiries, which then move to the next dimension.
4. Dimension Three: IV Smile / Skew / Surface — Even If the Direction Is Right, Do Not Buy the Most Expensive Option
If the first dimension decides which part of the strike range to consider, and the second dimension decides which expiry to use, the third dimension asks:
Within the same direction and expiry, is the volatility price of this option reasonable?
For crypto options, I think this is where systematic selection becomes much more interesting than simply screening by Delta.
Stop Using Strike Directly; Use Log-Moneyness
Different expiries have different forward prices, so directly comparing \(K-F\) is not ideal.
Use:
\[ k=\ln(K/F) \]
Then convert implied volatility into total variance:
\[ w(k)=IV(k)^2T \]
This makes curves across different expiries easier to handle within a common framework.
Why You Should Not Force a Symmetric "Smile"
BTC and ETH option surfaces are often asymmetric.
At one point, Puts may become much more expensive because of hedging demand.
At another point, far OTM Calls may be bid up by speculative demand or structured-product flows.
If the model forces:
            text

            Call at +10% from ATM
=
Put at -10% from ATM
it will erase information contained in the skew.
For a formal implementation, I therefore prefer a skew-capable volatility parameterization such as SVI.
The classic SVI total-variance form can be written as:
\[ w(k)=a+b\left[\rho(k-m)+\sqrt{(k-m)^2+\sigma^2}\right] \]
It is not the only possible choice.
If an expiry has very few valid quotes, a simpler asymmetric quadratic or cubic smoother may be more robust.
The goal is not to use the most complicated model.
The goal is to avoid forcing a clearly asymmetric market into a symmetric curve.
"Cheap" Does Not Mean Low IV — It Means Low Relative to the Surface
Suppose a BTC Call has an IV of 55%.
The number 55% means very little by itself.
If neighboring contracts at the same expiry imply a fair surface level around 62%, the option may be relatively cheap.
If the fair surface level is only 48%, the same 55% option is actually expensive.
Define:
\[ IVResidual=IV_{market}-IV_{fair} \]
For a contract I intend to buy, I care even more about:
\[ AskResidual=AskIV-IV_{fair} \]
because I pay the Ask when entering.
I do not pay Mark IV, and I do not trade at a beautiful theoretical mid curve.
This is an easy detail to overlook in live trading.
An option may display:
            text

            Mark IV    52%
Fair IV    54%
It appears to be "2 vol cheap."
But the real order book may be:
            text

            Bid IV     48%
Ask IV     58%
If I am the buyer, my executable volatility is close to 58%.
The supposedly cheap option is not cheap at all.
Add 25-Delta Skew
For directional trading, the 25-Delta Call and Put are useful reference points for seeing which wing the market is charging more for.
Two simple metrics are:
\[ RR_{25}=IV_{25C}-IV_{25P} \]
and:
\[ BF_{25}=\frac{IV_{25C}+IV_{25P}}{2}-IV_{ATM} \]
RR is closer to a directional-skew measure.
BF is closer to the relative richness of the wings versus ATM.
Suppose I am bullish BTC, but 25D Calls are already much more expensive than 25D Puts.
That does not mean I cannot express a bullish view.
It means I should acknowledge that I am buying an expensive Call wing.
Moving closer to ATM, switching expiry, or even switching venue may be more efficient than blindly chasing the deepest OTM Call.
5. Deribit, Binance, and OKX Should Not Be Three Separate Strategies — They Should Be One Candidate Pool
At this point, using three exchanges starts to become genuinely useful.
If I look at only one venue, I can answer:
Is this option expensive or cheap relative to other options on the same exchange?
Once I add two more venues, I can ask another question:
Is the same BTC risk exposure cheaper somewhere else?
But I cannot simply place the premiums of the same strike across three exchanges side by side.
The correct approach is to fit each venue's own volatility surface first, then project those surfaces into the same \((k,T)\) coordinate system.
For example, at a target point such as:
            text

            BTC
DTE ≈ 14 days
Delta ≈ 0.20 Call
we may obtain:
            text

            Deribit Fair IV
Binance Fair IV
OKX Fair IV
From these, we can build a liquidity-weighted Cross-Venue Consensus IV.
Then every candidate contract receives two residuals:
            text

            Local Residual
= Current Ask IV - Venue Fair IV

Cross-Venue Residual
= Current Ask IV - Three-Venue Consensus Fair IV
This allows us to distinguish two very different meanings of "cheap."
One contract may simply fall into a local depression in its own venue's Smile.
Or an entire section of one venue's volatility surface may be cheaper than the equivalent region on the other two venues.
The latter may come from:
- genuine cross-market supply and demand;
- contract specification differences;
- margin rules;
- settlement methods;
- participant structure.
So I would not automatically call it arbitrage.
A cross-venue IV difference is useful selection information.
It is not automatically a risk-free arbitrage opportunity.
Actual cross-market arbitrage must also deal with:
- capital distribution;
- margin;
- trading fees;
- contract multipliers;
- settlement rules;
- transfer time;
- leg risk.
That is a different system.
This article only asks one question:
If I already want to buy a directional option, which contract among the three venues deserves to enter the final candidate set?
6. Dimension Four: Liquidity — "Undervalued" Means Nothing if You Cannot Trade It
One of the easiest places for an option surface to generate false signals is in far-out, inactive contracts with little or no trading.
A Call may have an extremely attractive Mark IV, while the order book looks like:
            text

            Bid      20
Ask      35
An algorithm looking only at Mark IV may rank it first.
In reality, the 15-point spread can consume the theoretical edge immediately.
That is why I prefer to use hard filters for liquidity rather than assigning liquidity a small score that other attractive features can offset.
1. Relative Bid-Ask Spread
\[ SpreadRatio=\frac{Ask-Bid}{(Ask+Bid)/2} \]
For a directional option buyer, the spread is effectively part of the loss you absorb immediately after entering.
A reasonable threshold varies across DTE and Delta.
So I would not hard-code a permanent 3% or 5% rule.
A more adaptive approach is to rank spreads among nearby contracts within the same expiry and keep, for example, only the best 60%–70% by liquidity.
2. Real Slippage for the Target Position
A good Best Ask does not mean enough size is available there.
If I intend to buy $20,000 of premium, I should actually walk the order book and calculate:
\[ Slippage=\frac{VWAP_{entry}-BestAsk}{BestAsk} \]
instead of assuming the entire position can be filled at level one.
All three exchanges provide order-book endpoints, so this cost can be estimated before the trade.
3. Look at OI and Volume Separately
High Open Interest means existing positions are present.
High 24-hour Volume means people have actually been trading recently.
I prefer to use both rather than rely on only one.
            text

            High OI + Low Volume
may simply indicate a large number of old positions.
            text

            Low OI + Suddenly High Volume
may indicate:
- a new contract;
- an event-driven burst;
- temporary short-term activity.
A more stable candidate should generally satisfy:
There is an existing position base + recent trading activity + no obvious break in the order book.
4. Quotes Must Be Fresh
Timestamps are especially important in cross-venue scanning.
If one exchange is a few seconds behind the others, that alone can create a fake IV depression during a fast market.
So every normalized candidate record should keep:
            text

            quote_age_ms
Quotes older than the accepted threshold should be discarded.
They should not be used for:
- surface fitting;
- candidate ranking;
- cross-venue comparison.
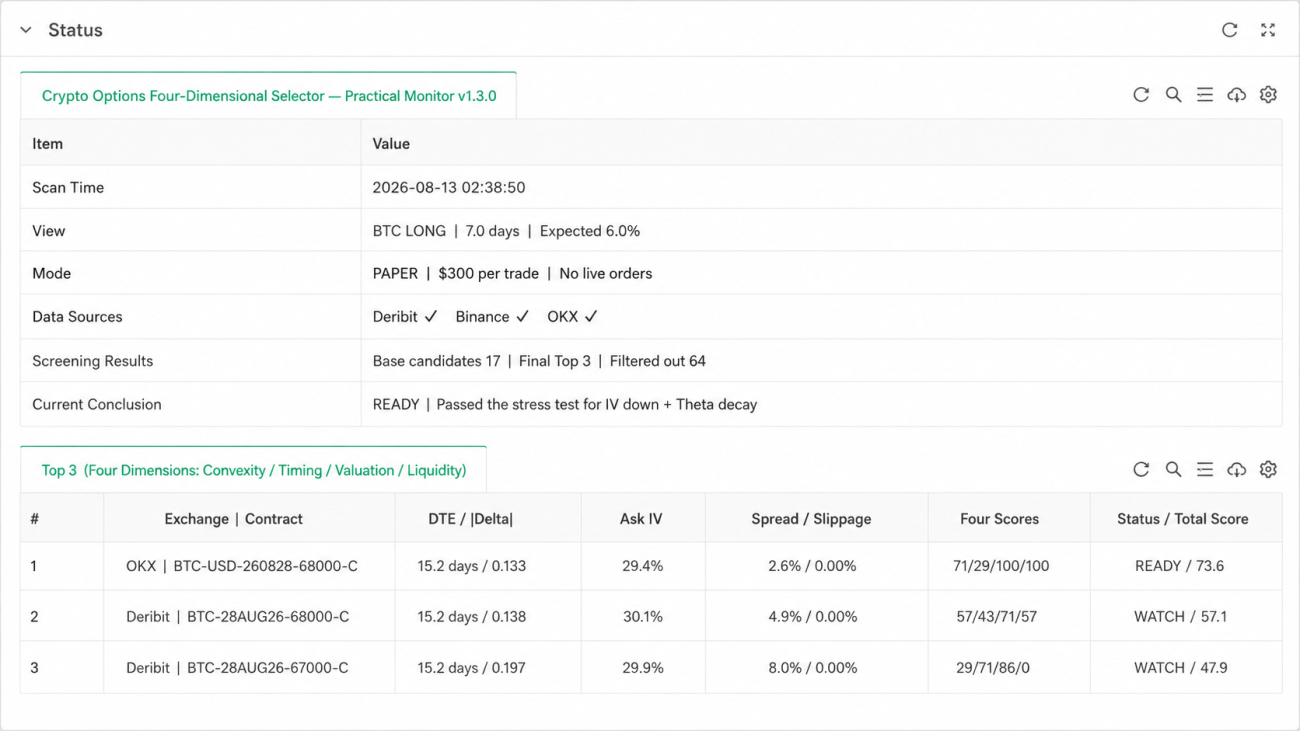
7. Connect the Four Dimensions: From "Bullish BTC" to a Final Top 3
Suppose the upstream strategy provides only three inputs:
            text

            Underlying: BTC
Direction:  Long
Horizon:    7 days
It does not tell me which Call to buy.
The full selector can be expressed as:
            text

                            Directional View: BTC Bullish, Expected Horizon 7 Days
                                      │
                                      ▼
                 Deribit + Binance Options + OKX Options
                                      │
                                      ▼
                       Load All Tradable Call Options
                                      │
                                      ▼
          Normalize Prices, Contract Multipliers, Forward, DTE, Greeks
                                      │
                                      ▼
             Layer 1: Delta Filter (for example 0.10–0.30)
                                      │
                                      ▼
               Rank Gamma / Speed / Convexity Efficiency
                                      │
                                      ▼
          Layer 2: DTE + ATM IV Term Structure + Basis/Funding
                                      │
                                      ▼
                    Keep the Best-Matched 2–3 Expiries
                                      │
                                      ▼
               Layer 3: Fit IV Surface for Each Exchange
                                      │
                                      ▼
        Use Local Residual + Cross-Venue Residual for Relative Value
                                      │
                                      ▼
          Layer 4: Spread / Depth / OI / Volume / Staleness
                                      │
                                      ▼
                                  Final Top 3
I do not recommend compressing everything into one "magic total score" from the beginning.
A more robust process is:
Hard filters first, layered ranking second.
For example:
            python

            # Pseudocode: illustrates the process only

candidates = load_options_from_deribit_binance_okx("BTC")
candidates = normalize_contracts(candidates)

# Direction and minimum tradability
candidates = [x for x in candidates if x.option_type == "CALL"]
candidates = [x for x in candidates if 0.10 <= x.delta_norm <= 0.30]
candidates = [x for x in candidates if not x.stale]
candidates = [x for x in candidates if x.depth_slippage <= MAX_SLIPPAGE]

# Convexity
for x in candidates:
    x.speed = calc_speed_by_bump(x)
    x.gamma_eff = x.gamma_norm * x.forward**2 / x.ask_price_usd

# Timing
expiries = rank_expiry_by_horizon_term_structure_basis(
    candidates,
    horizon_days=7
)
candidates = keep_selected_expiries(candidates, expiries)

# IV Surface
surfaces = fit_surface_by_venue_and_expiry(candidates)

for x in candidates:
    x.fair_iv = surfaces[x.venue, x.expiry].iv(x.log_moneyness)
    x.ask_residual = x.ask_iv - x.fair_iv

# Liquidity and execution cost
candidates = hard_liquidity_filter(candidates)

# Final ranking
top3 = rank_candidates(candidates)[:3]
In a real implementation, fixed thresholds can be replaced with percentiles.
That allows the selector to adapt across:
- BTC;
- ETH;
- high-volatility regimes;
- low-volatility regimes;
instead of relying on values that remain hard-coded forever.
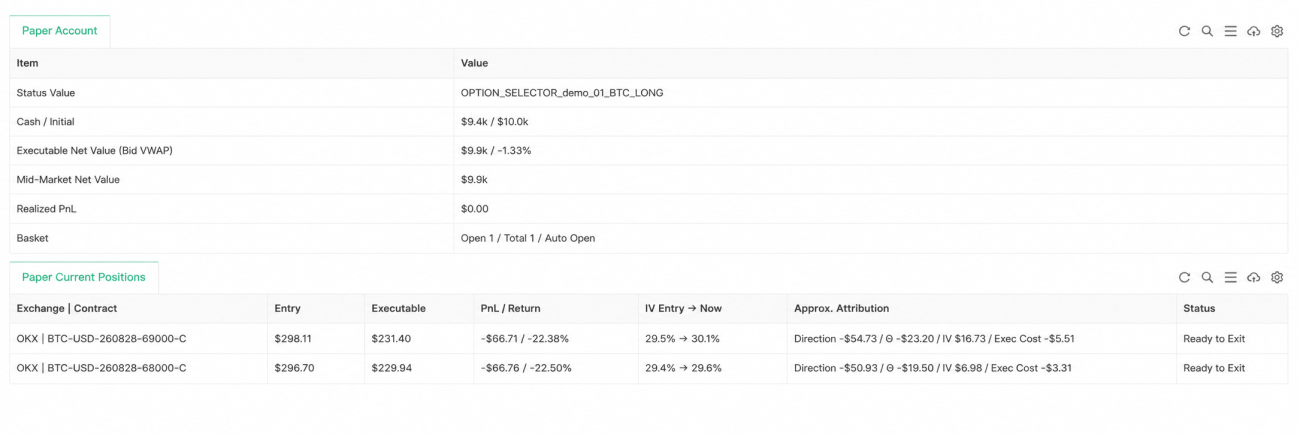
8. I Would Not Place an Order After the Four-Dimensional Filter — I Would Run Scenario Repricing First
After the four-dimensional screen, there is still one critical check:
If my directional view actually plays out, how much will this option make?
High Gamma, cheap IV, and good liquidity still do not guarantee that the return profile meets the trading objective.
Suppose the upstream model provides:
            text

            Current BTC Forward: F
Expected in 5 days:  F × 1.06
Expected IV change:  -3 vol / 0 / +3 vol
Each candidate can then be repriced under the scenarios:
\[ V_{exit}=OptionPrice(F_{scenario},K,T-5d,IV_{scenario}) \]
Then subtract the real entry Ask, expected exit spread, and fees:
\[ NetPnL=V_{exit}-EntryAsk-ExitCost-Fee \]
I would run at least three IV scenarios:
            text

            Direction realized + IV falls
Direction realized + IV unchanged
Direction realized + IV rises
If a Call only produces an attractive result when:
BTC rallies sharply and IV continues rising,
then the position is really a demanding two-factor bet.
In contrast, if BTC rises as expected and the option still maintains an acceptable return even after IV falls by several vol points, that contract is more consistent with the original purpose:
expressing a directional view through options.
This step also puts the Greeks back into their proper role.
Greeks are local sensitivities.
The final trade decision should return to:
- full repricing;
- realistic execution costs.
9. What Role Should Each Exchange Play in the System?
When building the model, I would not simply ask which venue is "best."
I would rather treat the three venues as markets that can validate one another.
Deribit: Suitable as a Primary Surface and High-Frequency Greeks Source
Deribit's ticker / WebSocket ticker provides:
- bid IV;
- ask IV;
- mark IV;
- Greeks;
- OI;
- market data.
Its options toolchain is highly concentrated, which makes it suitable as one of the primary data sources for BTC/ETH volatility surfaces.
Deribit also provides historical volatility and volatility-index-related interfaces.
So if the model later expands from:
Is current IV expensive?
to:
- IV vs. realized volatility;
- DVOL;
- historical IV percentiles;
the extension path is relatively straightforward.
Binance Options: Useful as a Second Quote Center and USDT-Ecosystem Reference
Binance /eapi/v1/mark provides:
- bidIV;
- askIV;
- markIV;
- Delta;
- Gamma;
- Theta;
- Vega.
ticker, openInterest, and depth add:
- trading activity;
- open interest;
- order-book depth.
For the selector, the value of Binance is not merely that it is "another exchange."
It helps answer a more useful question:
If one region of the Deribit Smile looks cheap or expensive, is that a Deribit-specific phenomenon, or is the broader market pricing the same way?
OKX Options: Useful as an Independent Surface and Forward Cross-Check
OKX /api/v5/public/opt-summary is particularly useful for this framework.
Its output includes fields such as:
- Delta / Gamma / Vega / Theta;
deltaBS;gammaBS;thetaBS;vegaBS;markVol;bidVol;askVol;fwdPx;- ATM volatility-related fields.
In one request, the system can obtain much of the data required for:
- Smile construction;
- Skew analysis;
- Forward checks;
- Greek validation.
Combined with public/open-interest and order-book endpoints, OKX can form a complete independent candidate pool.
The goal is for all three venues to cross-check one another, not replace one another.
10. What Is Really Worth Automating Is Not "Predicting Up or Down" — It Is Translating a View Into a Contract
Many quantitative strategies spend most of their effort on directional signals:
- trend;
- momentum;
- machine learning;
- order flow;
- on-chain data.
The final output is often just:
            text

            Long
or:
            text

            Short
But once the execution instrument changes from futures to options, the directional signal has only completed half the job.
The same view:
            text

            BTC is bullish over the next week
can be translated into very different risk structures:
            text

            3D 40Delta Call
7D 20Delta Call
14D 15Delta Call
30D ATM Call
Call Spread
All of these positions are "bullish."
Yet their sensitivity to:
- price;
- time;
- volatility;
is completely different.
A more reasonable system architecture is therefore:
            text

            Directional Model
   ↓
Output:
Direction + Confidence + Forecast Horizon + Expected Move
   ↓
Option Selector
   ↓
Delta / Gamma / Speed
DTE / Term Structure
IV Surface / Skew
Liquidity / Cost
   ↓
Scenario Repricing
   ↓
Top 3 Contracts
   ↓
Risk Budget Determines Final Position Size
The key shift is this:
We stop asking:
Which option is the cheapest?
and start asking:
Which option is the best instrument for expressing this particular forecast?
Those are completely different questions.
11. Risk: Limited Maximum Loss for the Buyer Does Not Mean the Strategy Is Low Risk
One of the major advantages of directional long-option positions is that the maximum loss on a single trade can usually be constrained explicitly through the premium budget.
But this creates another illusion:
If I can only lose the premium, I can just keep buying.
The real danger is a sequence of small losses that go to zero.
A model that repeatedly buys low-Delta, short-DTE options may exhibit a distribution like:
            text

            Small maximum loss per trade
Low win rate
Persistently negative Theta
Persistently negative spread cost
Occasional very large winner
Whether this return distribution has positive expectancy cannot be proven simply by saying:
Losses are limited.
The four-dimensional selector only solves one problem:
Once the decision has been made to express a directional view through options, reduce obviously poor contract choices.
It does not replace:
- statistical edge in the directional model itself;
- per-trade premium budgets;
- daily / weekly maximum-loss rules;
- same-direction concentration limits;
- cross-exchange capital and operational risk management;
- stress tests for extreme markets, IV collapse, and disappearing liquidity.
It is especially important to remember:
"Undervalued IV" is only a relative value under the model.
It does not mean IV must revert toward the fitted value.
The entire volatility surface can move.
Conclusion: An Option Is Not a "Future With Insurance" — It Is a Payoff Curve You Can Design
If I had to summarize the framework in one sentence:
Getting the direction right only means you solved the sign of Delta. The quality of the option trade depends on how much Gamma you bought, how much Theta you paid, whether Vega was expensive or cheap, and whether you can actually execute the position at a reasonable price.
One major advantage of crypto options is that these data are highly structured.
Deribit, Binance Options, and OKX Options all provide sufficiently complete public APIs to turn the traditional process of:
staring at an option chain and choosing contracts from experience
into a repeatable program:
            text

            Direction
→ Strike
→ Expiry
→ IV Surface
→ Liquidity
→ Cross-Venue Compare
→ Scenario Repricing
If I continue developing this framework, I am less interested in adding a fifth indicator than in fully separating the selector from the upstream directional model.
The directional model should only predict:
            text

            Where?
How long?
How far?
The option module should specialize in finding the most appropriate risk expression.
At that point, options stop being a simple trading button where:
bullish = buy Call
bearish = buy Put
and become what they really are:
a payoff function that can be calculated, filtered, compared, and designed.
Strategy Source Code
Crypto Options Four-Dimensional Selector — Practical Monitoring Version v1.3.1
- 1