
8
Follow
1364
Followers
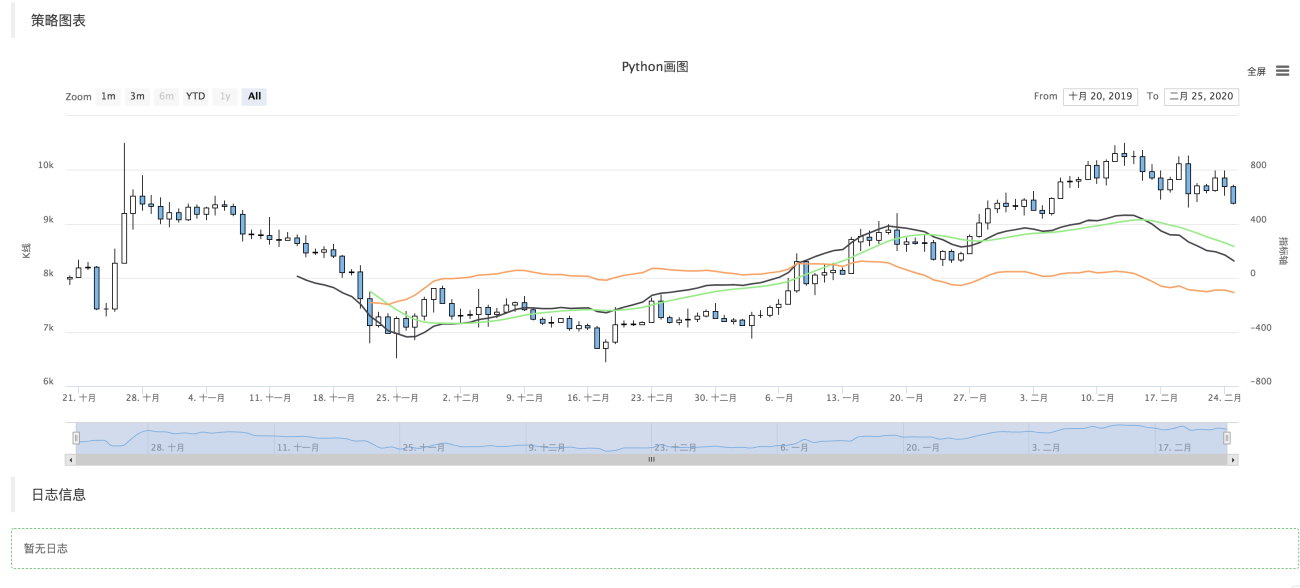
Python版MACD画图范例
Created 2020-02-27 19:18:17 Updated 2023-10-09 22:50:01
0
2983

Python版MACD画图范例
其实在做这个范例代码之前,在发明者量化交易平台策略广场:https://www.fmz.com/strategy/151972 。已经有JavaScript版本的MACD指标画图范例了。不过应用户的需求,还是写一个Python版本的例子,以供在策略开发设计画图时作为参考代码。
代码非常简单:
'''backtest
start: 2020-01-28 00:00:00
end: 2020-02-26 00:00:00
period: 1d
exchanges: [{"eid":"OKEX","currency":"BTC_USDT"}]
'''
ChartCfg = {
'__isStock': True,
'title': {
'text': 'Python画图'
},
'yAxis': [{
'title': {'text': 'K线'},
'style': {'color': '#4572A7'},
'opposite': False
}, {
'title': {'text': '指标轴'},
'opposite': True
}],
'series': [{
'type': 'candlestick',
'name': '当前周期',
'id': 'primary',
'data': []
}, {
'type': 'line',
'id': 'dif',
'name': 'DIF',
"yAxis" : 1,
'data': []
}, {
'type': 'line',
'id': 'dea',
'name': 'DEA',
"yAxis" : 1,
'data': []
}, {
'type': 'line',
'id': 'macd',
'name': 'MACD',
"yAxis" : 1,
'data': []
}]
}
def main():
global ChartCfg
preTime = 0
chart = Chart(ChartCfg)
chart.reset()
while True:
while True:
r = _C(exchange.GetRecords)
if len(r) > 50:
break
# 计算指标
macd = TA.MACD(r)
LogStatus(_D(), len(r))
# 画图
for i in range(len(r)):
if r[i]["Time"] == preTime:
chart.add(0, [r[i]["Time"], r[i]["Open"], r[i]["High"], r[i]["Low"], r[i]["Close"]], -1)
chart.add(1, [r[i]["Time"], macd[0][i]], -1)
chart.add(2, [r[i]["Time"], macd[1][i]], -1)
chart.add(3, [r[i]["Time"], macd[2][i]], -1)
elif r[i]["Time"] > preTime:
chart.add(0, [r[i]["Time"], r[i]["Open"], r[i]["High"], r[i]["Low"], r[i]["Close"]])
chart.add(1, [r[i]["Time"], macd[0][i]])
chart.add(2, [r[i]["Time"], macd[1][i]])
chart.add(3, [r[i]["Time"], macd[2][i]])
preTime = r[i]["Time"]
Sleep(500)
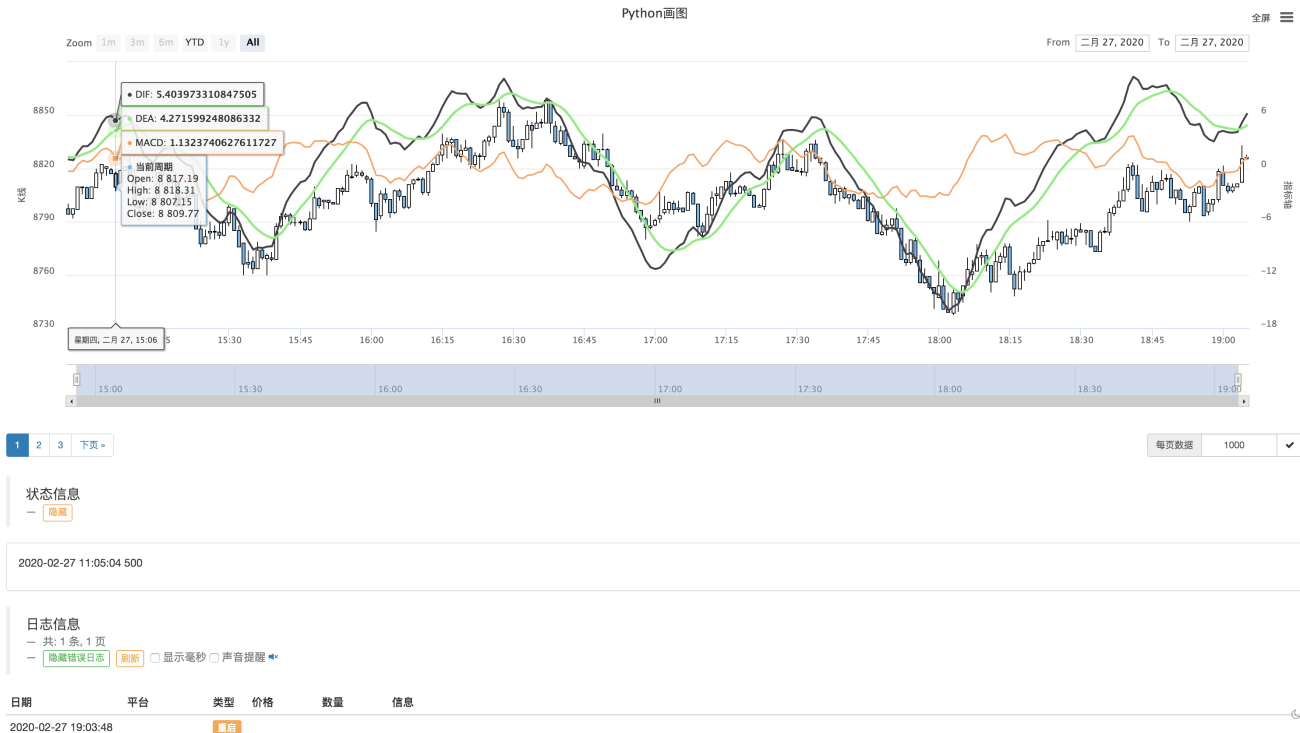
ChartCfg 图表配置字典
这个ChartCfg字典变量中保存的是图表配置信息,例如:
这个图表中有几条线?(三条指标线,分别是DIF、DEA、MACD)
这个图表中有K线么?('type': 'candlestick' 这个类型就是指设置为K线数据)
MACD数值都比较小,如果交易对是BTC_USDT,画图的时候就会指标压缩在一起很不方便看,所以图表还要配置为2个Y轴。(所以'yAxis'中有两个Y轴配置,一个是指标轴,一个是K线轴)
载入数据
在这个范例策略中main函数开始执行图表的初始化,调用Chart函数,把图表配置ChartCfg作为参数传入,生成一个图表对象chart。然后进入一个循环,不停的获取K线数据,判断K线数据BAR数量只要大于50个就可以计算MACD指标(BAR太少算不出有效指标)。然后就可以把K线数据和指标数据写入图表了。
写入图表使用chart对象的方法add函数。
写入时,如果指定add函数的最后一个参数-1,为更新当前数据点的数值。如果不传-1,为新增一个数据点。
当K线BAR新生成时,新增一个数据点,当K线BAR没有生成时,更新最后一个BAR和对应的指标。(通过K线BAR的时间戳对比判断出)
可以直接回测
也可以实盘运行:
策略范例地址:
https://www.fmz.com/strategy/187379
如有问题,感谢留言。
Related Recommendations
Research on Binance Futures Multi-currency Hedging Strategy Part 3Research on Binance Futures Multi-currency Hedging Strategy Part 2Research on Binance Futures Multi-currency Hedging Strategy Part 1Crocodile line trading system Python versionJavaScript version SuperTrend strategyIntroducing FMZ Quant data science research environmentParabolic Steering SAR and Price High and Low Point StrategyTeach you how to let an old strategy docking the websocket quotes interfaceSimilarities and differences between commodity futures and cryptocurrency exchanges APIMulti-level percentage take profit strategy
Comment
All comments (0)
No data
- 1