ক্রিপ্টোকারেন্সি ফিউচার মাল্টি-সিম্বল ART কৌশল (শিক্ষা)
লেখক:নিনাবাদাস, সৃষ্টিঃ ২০২২-০৪-০৭ ১১ঃ০৯ঃ৪২, আপডেটঃ ২০২২-০৪-০৭ ১৬ঃ১৫ঃ১৪ক্রিপ্টোকারেন্সি ফিউচার মাল্টি-সিম্বল ART কৌশল (শিক্ষা)
সাম্প্রতিককালে, আমাদের প্ল্যাটফর্মের কিছু ব্যবহারকারী একটি মাইল্যাঙ্গুয়েজ কৌশলকে জাভাস্ক্রিপ্ট কৌশলতে পোর্টিং করার জন্য খুব আগ্রহী, যাতে অনেকগুলি অপ্টিমাইজেশান ধারণা নমনীয়ভাবে যুক্ত করা যায়। তারা এমনকি একটি কৌশলকে মাল্টি-সিম্বল সংস্করণে প্রসারিত করতে চান। কারণ মাইল্যাঙ্গুয়েজ কৌশলগুলি সাধারণত ট্রেন্ড কৌশল এবং অনেকগুলি একটি কাছাকাছি মূল্য মডেলের মধ্যে কার্যকর করা হয়। সেই কৌশলগুলি প্ল্যাটফর্ম এপিআই ইন্টারফেসের অনুরোধ করে না, যা মাল্টি-সিম্বল কৌশল সংস্করণে পোর্টিংয়ের জন্য আরও উপযুক্ত। নিবন্ধে, আমরা একটি সহজ মাইল্যাঙ্গুয়েজ কৌশলকে উদাহরণস্বরূপ গ্রহণ করি এবং এটি জাভাস্ক্রিপ্ট ভাষার একটি সহজ সংস্করণে পোর্ট করি। প্রধান উদ্দেশ্যটি শেখানো, ব্যাকটেস্ট এবং গবেষণা। যদি আপনি একটি কৌশল চালাতে চান তবে আপনাকে কিছু বিবরণ যুক্ত করতে হতে পারে (যেমন অর্ডার মূল্য, নির্ভুলতা, অর্ডার পরিমাণ, সম্পদ দ্বারা অর্ডার নিয়ন্ত্রণ, তথ্য অনুপাত প্রদর্শন এবং ইত্যাদি), এছাড়াও বাস্তব টিক পরীক্ষা চালাতে হবে
মাইল্যাঙ্গুয়েজ কৌশলটি স্থানান্তরিত করা হবে
TR:=MAX(MAX((H-L),ABS(REF(C,1)-H)),ABS(REF(C,1)-L));
ATR:=EMA(TR,LENGTH2);

MIDLINE^^EMA((H + L + C)/3,LENGTH1);
UPBAND^^MIDLINE + N*ATR;
DOWNBAND^^MIDLINE - N*ATR;


BKVOL=0 AND C>=UPBAND AND REF(C,1)<REF(UPBAND,1),BPK;
SKVOL=0 AND C<=DOWNBAND AND REF(C,1)>REF(DOWNBAND,1),SPK;

BKVOL>0 AND C<=MIDLINE,SP(BKVOL);
SKVOL>0 AND C>=MIDLINE,BP(SKVOL);
// stop loss
C>=SKPRICE*(1+SLOSS*0.01),BP;
C<=BKPRICE*(1-SLOSS*0.01),SP;
AUTOFILTER;
কৌশল যুক্তি খুব সহজ. প্রথমে, পরামিতি অনুযায়ী, এটিআর গণনা করুন, এবং তারপরে সমস্ত কে-লাইন বারগুলির সর্বোচ্চ, সর্বনিম্ন, বন্ধ এবং খোলা মূল্যের গড় মানগুলি গণনা করুন, যার দ্বারা ইএমএ সূচক গণনা করা হবে। অবশেষে, এটিআর এবং পরামিতিগুলির মধ্যে অনুপাত এন এর ভিত্তিতে, আপব্যান্ড এবং ডাউনব্যান্ড গণনা করুন।
ওপেন পজিশন এবং বিপরীতটি আপব্যান্ড এবং ডাউনব্যান্ডের মধ্য দিয়ে বন্ধের দামের উপর ভিত্তি করে। আপব্যান্ডের মাধ্যমে বিপরীত (সংক্ষিপ্ত রাখার সময়), দীর্ঘ খোলা; ডাউনব্যান্ডের মাধ্যমে বিপরীত, সংক্ষিপ্ত খোলা। যখন বন্ধের মূল্য মধ্যরেখায় পৌঁছে যায়, তখন বন্ধের অবস্থান; যখন বন্ধের মূল্য স্টপ লস মূল্যে পৌঁছে যায়, তখন বন্ধের অবস্থান (স্টপ লসের জন্য SLOSS অনুসারে; যখন SLOSS 1 হয়, তখন এর অর্থ 0.01, যথা 1%) । এই কৌশলটি বন্ধ মূল্য মডেলের মাধ্যমে কার্যকর করা হয়।
ঠিক আছে, মাইল্যাঙ্গুয়েজের কৌশলগত প্রয়োজনীয়তা এবং চিন্তাভাবনা বুঝতে পেরে, আমরা পোর্ট করতে শুরু করতে পারি।
পোর্ট এবং ডিজাইন কৌশল প্রোটোটাইপ
কৌশল প্রোটোটাইপ কোডটি খুব বেশি লম্বা নয়, মাত্র ১ থেকে ২০০ লাইন। আপনার জন্য কৌশল লেখার ধারণাগুলি সহজেই অধ্যয়ন করার জন্য, আমি সরাসরি কৌশল কোডে মন্তব্যগুলি লিখি।
// parse params, from string to object
var arrParam = JSON.parse(params)

// the function creates the chart configuration
function createChartConfig(symbol, atrPeriod, emaPeriod, index) {   // symbol: trading pair; atrPeriod: ATR parameter period;  emaPeriod: EMA parameter period; index: index of the corresponding exchange object
    var chart = {
        __isStock: true,
        extension: {
                layout: 'single',
                height: 600,
        },
        title : { text : symbol},
        xAxis: { type: 'datetime'},
        series : [
            {
                type: 'candlestick',    // K-line data series
                name: symbol,
                id: symbol + "-" + index,
                data: []
            }, {
                type: 'line',           // EMA
                name: symbol + ',EMA:' + emaPeriod,
                data: [],
            }, {
                type: 'line',           // upBand
                name: symbol + ',upBand' + atrPeriod,
                data: []
            }, {
                type: 'line',           // downBand
                name: symbol + ',downBand' + atrPeriod,
                data: []
            }, {
                type: 'flags',
                onSeries: symbol + "-" + index,
                data: [],
            }
        ]
    }
    return chart
}

// main logic
function process(e, kIndex, c) {    // e is the exchange object, such as exchanges[0] ... ; kIndex is the data series of K-line data in the chart; c is the chart object
    // obtain K-line data
    var r = e.GetRecords(e.param.period)
    if (!r || r.length < e.param.atrPeriod + 2 || r.length < e.param.emaPeriod + 2) {
        // if K-line data length is insufficient, return
        return
    }

    // calculate ATR indicator
    var atr = TA.ATR(r, e.param.atrPeriod)
    var arrAvgPrice = []
    _.each(r, function(bar) {
        arrAvgPrice.push((bar.High + bar.Low + bar.Close) / 3)
    })
    // calculate EMA indicator
    var midLine = TA.EMA(arrAvgPrice, e.param.emaPeriod)
    // calculate upBand and downBand
    var upBand = []
    var downBand = []
    _.each(midLine, function(mid, index) {
        if (index < e.param.emaPeriod - 1 || index < e.param.atrPeriod - 1) {
            upBand.push(NaN)
            downBand.push(NaN)
            return
        }
        upBand.push(mid + e.param.trackRatio * atr[index])
        downBand.push(mid - e.param.trackRatio * atr[index])
    })

    // plot
    for (var i = 0 ; i < r.length ; i++) {
        if (r[i].Time == e.state.lastBarTime) {
            // update
            c.add(kIndex, [r[i].Time, r[i].Open, r[i].High, r[i].Low, r[i].Close], -1)
            c.add(kIndex + 1, [r[i].Time, midLine[i]], -1)
            c.add(kIndex + 2, [r[i].Time, upBand[i]], -1)
            c.add(kIndex + 3, [r[i].Time, downBand[i]], -1)
        } else if (r[i].Time > e.state.lastBarTime) {
            // add
            e.state.lastBarTime = r[i].Time
            c.add(kIndex, [r[i].Time, r[i].Open, r[i].High, r[i].Low, r[i].Close])
            c.add(kIndex + 1, [r[i].Time, midLine[i]])
            c.add(kIndex + 2, [r[i].Time, upBand[i]])
            c.add(kIndex + 3, [r[i].Time, downBand[i]])
        }
    }

    // detect position
    var pos = e.GetPosition()
    if (!pos) {
        return
    }
    var holdAmount = 0
    var holdPrice = 0
    if (pos.length > 1) {
        throw "Long and short positions are detected simultaneously!"
    } else if (pos.length != 0) {
        holdAmount = pos[0].Type == PD_LONG ? pos[0].Amount : -pos[0].Amount
        holdPrice = pos[0].Price
    }

    if (e.state.preBar == -1) {
        e.state.preBar = r[r.length - 1].Time
    }
    // detect signal
    if (e.state.preBar != r[r.length - 1].Time) {   // close price model
        if (holdAmount <= 0 && r[r.length - 3].Close < upBand[upBand.length - 3] && r[r.length - 2].Close > upBand[upBand.length - 2]) {   // close price up cross the upBand
            if (holdAmount < 0) {   // holding short, close position
                Log(e.GetCurrency(), "close short position", "#FF0000")
                $.CoverShort(e, e.param.symbol, Math.abs(holdAmount))
                c.add(kIndex + 4, {x: r[r.length - 2].Time, color: 'red', shape: 'flag', title: 'close', text: "close short position"})
            }
            // open long
            Log(e.GetCurrency(), "open long position", "#FF0000")
            $.OpenLong(e, e.param.symbol, 10)
            c.add(kIndex + 4, {x: r[r.length - 2].Time, color: 'red', shape: 'flag', title: 'long', text: "open long position"})
        } else if (holdAmount >= 0 && r[r.length - 3].Close > downBand[downBand.length - 3] && r[r.length - 2].Close < downBand[downBand.length - 2]) {  // close price down cross the downBand
            if (holdAmount > 0) {   // holding long, close position
                Log(e.GetCurrency(), "close long position", "#FF0000")
                $.CoverLong(e, e.param.symbol, Math.abs(holdAmount))
                c.add(kIndex + 4, {x: r[r.length - 2].Time, color: 'green', shape: 'flag', title: 'close', text: "close long position"})
            }
            // open short
            Log(e.GetCurrency(), "open short position", "#FF0000")
            $.OpenShort(e, e.param.symbol, 10)
            c.add(kIndex + 4, {x: r[r.length - 2].Time, color: 'green', shape: 'flag', title: 'short', text: "open short position"})
        } else {
            // close position
            if (holdAmount > 0 && (r[r.length - 2].Close <= holdPrice * (1 - e.param.stopLoss) || r[r.length - 2].Close <= midLine[midLine.length - 2])) {   // if holding long position, close price is equal to or less than midline, stop loss according to open position price
                Log(e.GetCurrency(), "if midline is triggered or stop loss, close long position", "#FF0000")
                $.CoverLong(e, e.param.symbol, Math.abs(holdAmount))
                c.add(kIndex + 4, {x: r[r.length - 2].Time, color: 'green', shape: 'flag', title: 'close', text: "close long position"})
            } else if (holdAmount < 0 && (r[r.length - 2].Close >= holdPrice * (1 + e.param.stopLoss) || r[r.length - 2].Close >= midLine[midLine.length - 2])) {  // if holding short position, close price is equal to or more than midline, stop loss according to open position price
                Log(e.GetCurrency(), "if midline is triggered or stop loss, close short position", "#FF0000")
                $.CoverShort(e, e.param.symbol, Math.abs(holdAmount))
                c.add(kIndex + 4, {x: r[r.length - 2].Time, color: 'red', shape: 'flag', title: 'close', text: "close short position"})
            }
        }
        e.state.preBar = r[r.length - 1].Time
    }
}

function main() {
    var arrChartConfig = []
    if (arrParam.length != exchanges.length) {
        throw "The parameter and the exchange object do not match!"
    }
    var arrState = _G("arrState")
    _.each(exchanges, function(e, index) {
        if (e.GetName() != "Futures_Binance") {
            throw "The platform is not supported!"
        }
        e.param = arrParam[index]
        e.state = {lastBarTime: 0, symbol: e.param.symbol, currency: e.GetCurrency()}
        if (arrState) {
            if (arrState[index].symbol == e.param.symbol && arrState[index].currency == e.GetCurrency()) {
                Log("Recover:", e.state)
                e.state = arrState[index]
            } else {
                throw "The recovered data and the current setting do not match!"
            }
        }
        e.state.preBar = -1   // initially set -1
        e.SetContractType(e.param.symbol)
        Log(e.GetName(), e.GetLabel(), "Set contract:", e.param.symbol)
        arrChartConfig.push(createChartConfig(e.GetCurrency(), e.param.atrPeriod, e.param.emaPeriod, index))
    })
    var chart = Chart(arrChartConfig)
    chart.reset()

    while (true) {
        _.each(exchanges, function(e, index) {
            process(e, index + index * 4, chart)
            Sleep(500)
        })
    }
}

function onexit() {
    // record e.state
    var arrState = []
    _.each(exchanges, function(e) {
        arrState.push(e.state)
    })
    Log("Record:", arrState)
    _G("arrState", arrState)
}
কৌশলগত পরামিতি:
var params = '[{
        "symbol" : "swap",    // contract code
        "period" : 86400,     // K-line period; 86400 seconds indicates 1 day
        "stopLoss" : 0.07,    // ratio of stoploss; 0.07 means 7%
        "atrPeriod" : 10,     // ATR indicator parameter
        "emaPeriod" : 10,     // EMA indicator parameter
        "trackRatio" : 1,     // ratio of upBand or downBand
        "openRatio" : 0.1     // ratio of reserved open position (temporarily not supported)
    }, {
        "symbol" : "swap",
        "period" : 86400,
        "stopLoss" : 0.07,
        "atrPeriod" : 10,
        "emaPeriod" : 10,
        "trackRatio" : 1,
        "openRatio" : 0.1
    }]'
ব্যাকটেস্ট
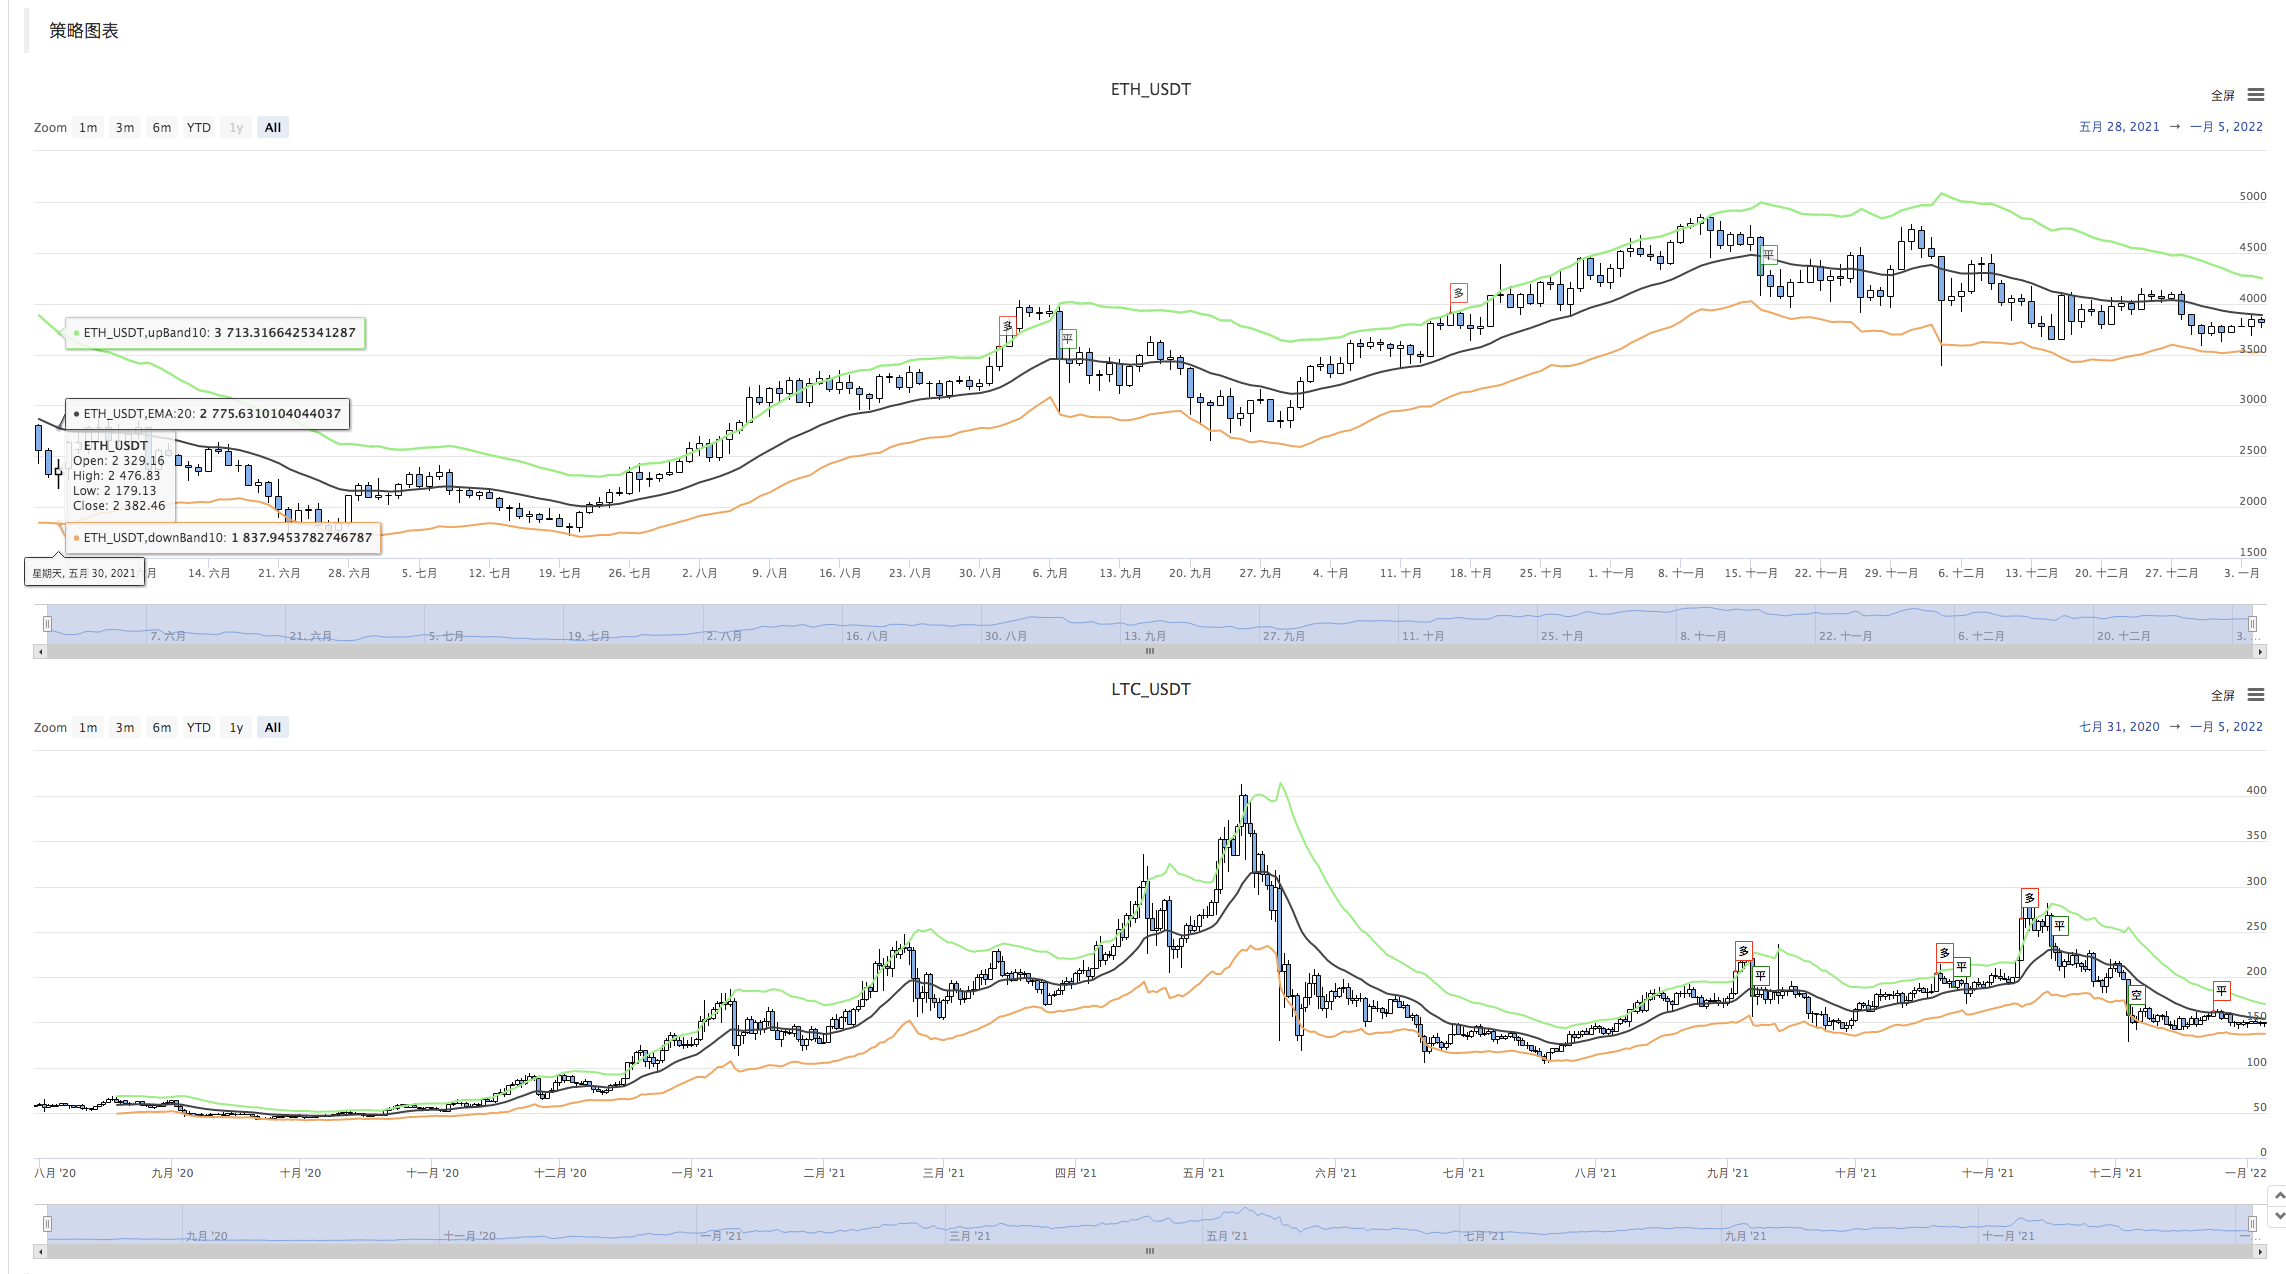
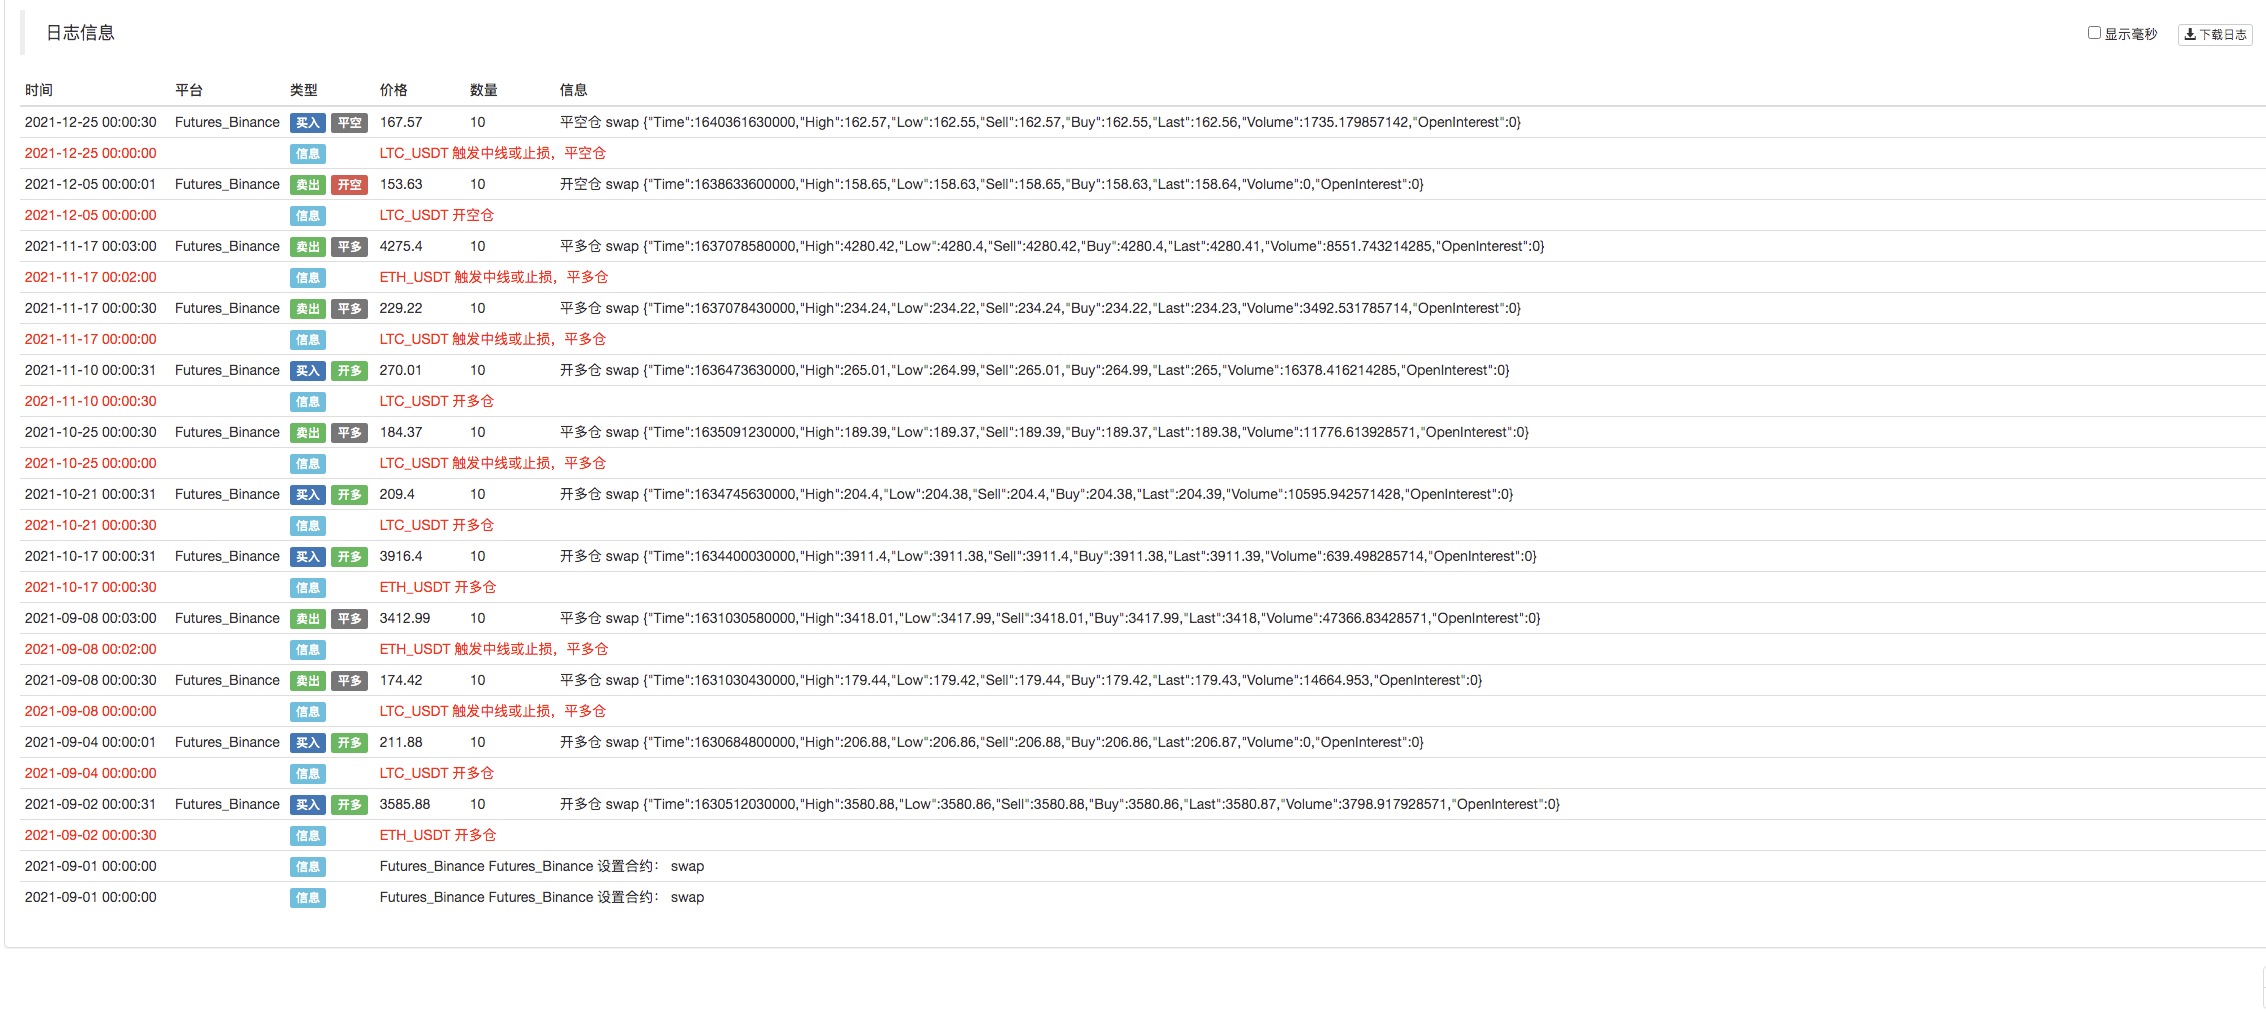
কৌশল উৎস কোডঃhttps://www.fmz.com/strategy/339344
কৌশলটি শুধুমাত্র যোগাযোগ এবং অধ্যয়নের জন্য ব্যবহৃত হয়; ব্যবহারিক ব্যবহারের জন্য, আপনাকে নিজের দ্বারা এটি সংশোধন, সমন্বয় এবং অপ্টিমাইজ করতে হবে।
- মুখের মান সমস্যা
- dYdX কৌশল নকশা উদাহরণ
- এফএমজেডে পাইথন ক্রলার প্রয়োগের প্রাথমিক অনুসন্ধান
ক্রলিং বাইনারেন্স ঘোষণা সামগ্রী - হেজিং স্ট্র্যাটেজি ডিজাইন রিসার্চ & পেন্ডিং স্পট এবং ফিউচার অর্ডারের উদাহরণ
- সাম্প্রতিক পরিস্থিতি এবং তহবিলের হার কৌশলটির প্রস্তাবিত অপারেশন
- ক্রিপ্টোকারেন্সি ফিউচারগুলির দ্বৈত চলমান গড় ব্রেকপয়েন্ট কৌশল (শিক্ষা)
- ক্রিপ্টোকারেন্সি স্পট মাল্টি-সিম্বল ডাবল মুভিং এভারেজ কৌশল (শিক্ষা)
- জাভাস্ক্রিপ্টে ফিশার সূচক বাস্তবায়ন এবং এফএমজেডে প্লটিং
- ট্রাস্টি
- 2021 ক্রিপ্টোকারেন্সি TAQ পর্যালোচনা এবং 10-বারের বৃদ্ধির সহজতম মিসড কৌশল
- আপগ্রেড করুন! ক্রিপ্টোকারেন্সি ফিউচার মার্টিনগেল কৌশল
- Getrecords ফাংশন সেকেন্ডে K স্ট্রিং ম্যাপ পেতে পারে না
- এফএমজেড ভিত্তিক অর্ডার সিঙ্ক্রোন ম্যানেজমেন্ট সিস্টেম ডিজাইন (2)
- Getticker এর ভলিউম রিটার্ন ভুল
- FMZ ভিত্তিক অর্ডার সিঙ্ক্রোন ম্যানেজমেন্ট সিস্টেম ডিজাইন (1)
- একাধিক চার্ট প্লট লাইব্রেরি ডিজাইন করুন
- এনালগ ডিস্ক পরিবেশ
- ৬০ লাইনের কোড এক চিন্তাভাবনা বাস্তবায়ন - চুক্তির নীচের মাছধরা
- এফএমজেড বিলিং সিস্টেম আপগ্রেড ও সমন্বয় ঘোষণা
- এফএমজেড-এ গসটরাইটিং কৌশলগুলির জন্য বিজ্ঞপ্তি