লিনিয়ার রিগ্রেশন ++
লেখক:চাওঝাং, তারিখ: ২০২২-০৫-২৪ ১৪ঃ১৭ঃ৪২ট্যাগঃডিইভি
জনসাধারণের চাহিদা
লিনিয়ার রিগ্রেশন সূত্র সতর্কতা সহ স্ক্র্যাপ করা গণনা
এখানে লিনিয়ার রিগ্রেশন স্ক্রিপ্ট ট্রেডার যারা সমৃদ্ধ বৈশিষ্ট্য ভালবাসেন জন্য
বৈশিষ্ট্য ++ মাল্টি টাইম ফ্রেম -> ভিন্ন চার্ট থেকে উৎস রিগ্রেশন ++ কাস্টমাইজড রং -> এই পাইন লাইন অন্তর্ভুক্ত ++ মসৃণকরণ -> ফিল্টার রিগ্রেশন অনুমতি দিন; দ্রষ্টব্যঃ 1 ব্যবহার করে মূল লাইনে ডিফল্ট। ডিফল্ট হল 1 ++ চ্যানেল/রেঞ্জ ক্রসিং সম্পর্কে সতর্কতা
ব্যবহার ++ এটি ব্রেকআউট এবং বিপরীতের জন্য ব্যবহার করুন ++ এই স্ক্রিপ্টটি স্বাধীনভাবে ব্যবহার করা যাবে না
ঝুঁকি দয়া করে মনে রাখবেন, এই স্ক্রিপ্টটি বোলিংজার ব্যান্ডের মতো এবং এটি একটি ট্রেন্ড রেঞ্জের মধ্যে পড়ার ঝুঁকি নিয়ে আসে। সিগন্যালগুলি একই দিকে চলতে পারে যখন বাজার বিপরীতমুখী হয়।
অনুরোধ যদি আপনার কোন বৈশিষ্ট্য অনুরোধ থাকে, নীচে মন্তব্য করুন অথবা আমাকে ডিএম করুন। আমি যখন পারি তখন উত্তর দেব। আপনার চার্টে এটি ব্যবহার করুন এবং আপনার ধারনা শেয়ার করুন
ডেভেলপার যারা তাদের চার্টে এটি ব্যবহার করতে চান, দয়া করে এই স্ক্রিপ্ট ব্যবহার করুন মূল গণনার সূত্র সেখানে পোস্ট করা আছে
❤❤❤ আমি আশা করি তুমি এটা পছন্দ করবে. আমার হৃদয় থেকে! ❤❤❤
ব্যাকটেস্ট
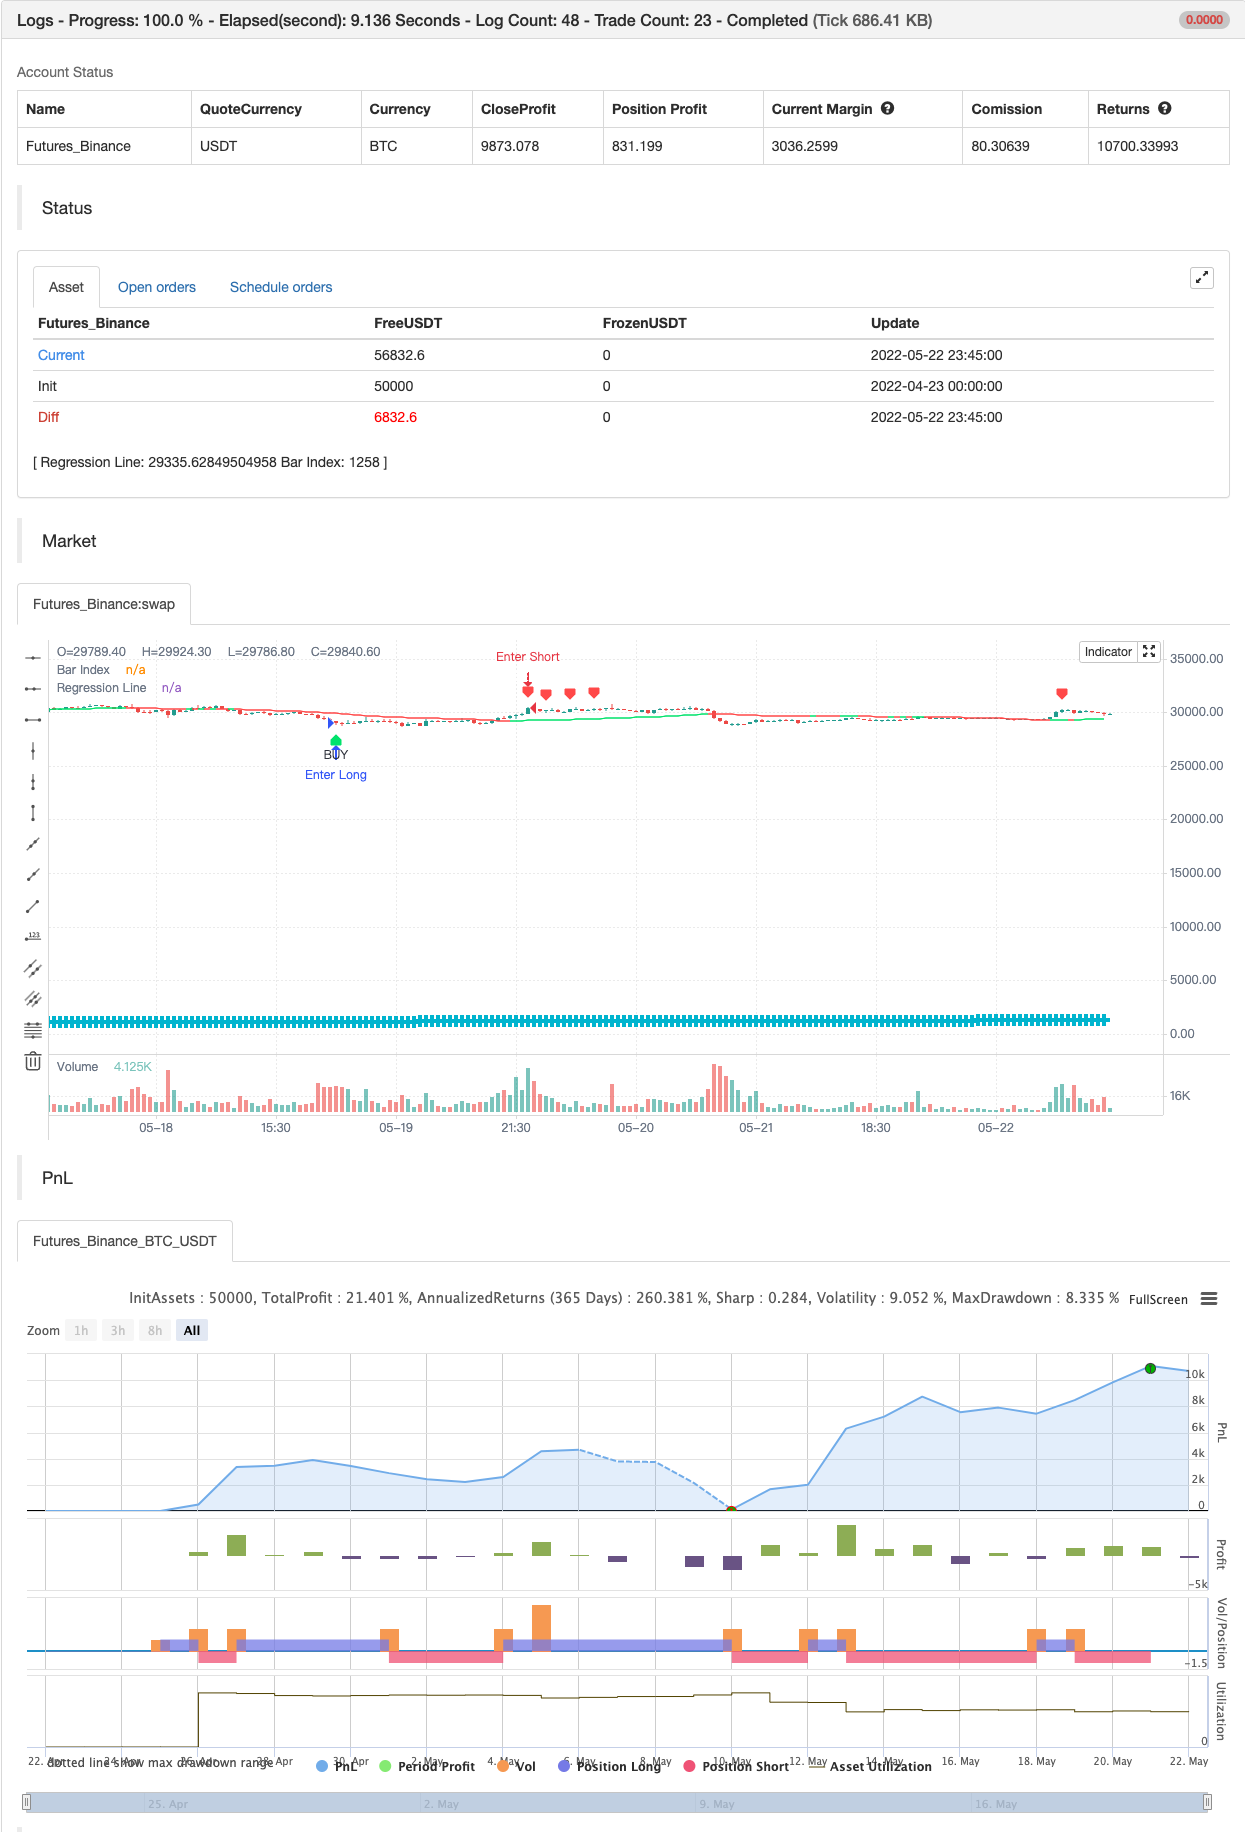
/*backtest
start: 2022-04-23 00:00:00
end: 2022-05-22 23:59:00
period: 45m
basePeriod: 5m
exchanges: [{"eid":"Futures_Binance","currency":"BTC_USDT"}]
*/

// This source code is subject to the terms of the Mozilla Public License 2.0 at https://mozilla.org/MPL/2.0/
// © LucemAnb
// User Version

//@version=4
study("Linear Regression ++ [Lucem Anb]", "Lin Reg ++ [Lucem Anb]", overlay=true)


source      = input(close)
length      = input(100, minval=1)
offset      = input(0, minval=0)
dev         = input(2.0, "Deviation")
smoothing   = input(1, minval=1)
mtf_val     = input("", "Resolution", input.resolution)
line_thick  = input(4, "S&R Thickness", minval=1, maxval=4)
signals     = input("Recent", "Signals Display", options=["Recent", "All"])
p           = input("Lime", "Up Color", options=["Red", "Lime", "Orange", "Teal", "Yellow", "White", "Black"])
q           = input("Red", "Down Color", options=["Red", "Lime", "Orange", "Teal", "Yellow", "White", "Black"])
goto        = input(0, "End At Bar Index")

cc(x) => x=="Red"?color.red:x=="Lime"?color.lime:x=="Orange"?color.orange:x=="Teal"?
 color.teal:x=="Yellow"?color.yellow:x=="Black"?color.black:color.white
data(x) => sma(security(syminfo.tickerid, mtf_val!="" ? mtf_val : timeframe.period, x), smoothing)

linreg = data(linreg(source, length, offset))
linreg_p = data(linreg(source, length, offset+1))
plot(linreg, "Regression Line", cc(linreg>linreg[1]?p:q), editable=false)

x = bar_index
slope = linreg - linreg_p
intercept = linreg - x*slope
deviationSum = 0.0
for i=0 to length-1
    deviationSum:= deviationSum + pow(source[i]-(slope*(x-i)+intercept), 2)
deviation = sqrt(deviationSum/(length))
x1 = x-length
x2 = x
y1 = slope*(x-length)+intercept
y2 = linreg

updating = goto <= 0 or x < goto


dm_current = -deviation*dev + y2
dp_current = deviation*dev + y2
buy = crossunder(close, dm_current)
sell = crossover(close, dp_current)
alertcondition(buy, "Buy Lin Reg", "Crossing On the Lower Regression Channel")
alertcondition(sell, "Sell Lin Reg", "Crossing On the Higher Regression Channel")

plotshape(buy, "BUY", shape.labelup, location.belowbar, color.lime, text='BUY', textcolor=color.black, show_last=signals=="All"?99999999:length)
plotshape(sell, "SELL", shape.labeldown, location.abovebar, color.red, text='SELL', textcolor=color.white, show_last=signals=="All"?99999999:length)

plot(x, "Bar Index", color.aqua, line_thick, plot.style_cross, display=display.none)

if buy
    strategy.entry("Enter Long", strategy.long)
else if sell
    strategy.entry("Enter Short", strategy.short)
- স্কেলপিং সুইং ট্রেডিং টুল R1-4
- সেরা গলফিং + ব্রেকআউট কৌশল
- বোলিংজার অ্যামেজিং অ্যালার্ট R1
- মাল্টি এক্সচেঞ্জ প্লাগইন
- ত্রিভুজ সুইচিং (ছোট মুদ্রার বিনিময় মূল্যের পার্থক্য)
- বাইবিট বিপরীত চুক্তির গতিশীল গ্রিড (বিশেষ গ্রিড)
- ট্রেডিংভিউ সতর্কতা MT4 MT5 + গতিশীল ভেরিয়েবল NON-REPAINTING
- ম্যাট্রিক্স সিরিজ
- সুপার স্কালপার - ৫ মিনিট ১৫ মিনিট
- আপেক্ষিক শক্তি সূচক - বৈষম্য - লিবার্টাস
- এনার্জি বার সহ রেড কে ডুয়াল ভেডার
- একত্রীকরণ অঞ্চল - লাইভ
- পরিমাণগত গুণগত অনুমান
- চলমান গড় ক্রস সতর্কতা, মাল্টি-টাইমফ্রেম (এমটিএফ)
- এমএসিডি পুনরায় লোড করা কৌশল
- সুপারট্রেন্ডড মুভিং মিডিয়ার
- ট্রেডিং এবিসি
- 15MIN BTCUSDTPERP BOT
- শ্যানন এন্ট্রপি ভি২
- ট্রেলিং স্টপ লস সঙ্গে SUPERTREND ATR