Implementieren Sie eine Dual-Push-Quantitative Trading-Strategie für digitale Währungen in Python
Schriftsteller:Lydia., Erstellt: 2023-01-10 17:07:49, aktualisiert: 2023-09-20 10:53:48
Implementieren Sie eine Dual-Push-Quantitative Trading-Strategie für digitale Währungen in Python
Einführung in den Dual Thrust-Handelsalgorithmus
Der Dual-Thrust-Handelsalgorithmus ist eine berühmte quantitative Handelsstrategie, die von Michael Chalek entwickelt wurde. Es wird normalerweise in Futures, Devisen und Aktienmärkten verwendet. Das Konzept des Dual-Thrust ist ein typisches Durchbruchshandelssystem. Es verwendet das
In diesem Artikel geben wir die detaillierten Logikdetails dieser Strategie und zeigen, wie dieser Algorithmus auf der FMZ Quant-Plattform implementiert wird. Zunächst müssen wir den historischen Preis des zu handelnden Themas auswählen. Dieser Bereich wird anhand des Schlusskurses, des höchsten Preises und des niedrigsten Preises der letzten N Tage berechnet. Wenn sich der Markt einen bestimmten Bereich vom Eröffnungspreis bewegt, öffnen Sie die Position.
Wir haben diese Strategie mit einem einzigen Handelspaar unter zwei gemeinsamen Marktbedingungen, nämlich Trendmarkt und Schockmarkt, getestet. Die Ergebnisse zeigten, dass das Momentum-Handelssystem am Trendmarkt besser funktioniert und einige ungültige Handelssignale auf dem volatilen Markt auslöst. Auf dem Intervallmarkt können wir Parameter anpassen, um bessere Renditen zu erzielen. Als Vergleich einzelner Referenzhandelsziele testeten wir auch den heimischen Rohstoff-Futuresmarkt. Das Ergebnis zeigte, dass die Strategie besser als die durchschnittliche Performance ist.
DT-Strategieprinzip
Der Logikprototyp ist eine gängige Intraday-Handelsstrategie. Die Öffnungs-Bereich-Breakthrough-Strategie basiert auf dem heutigen Eröffnungspreis plus oder minus einem bestimmten Prozentsatz des gestrigen Bereichs, um die oberen und unteren Spuren zu bestimmen. Wenn der Preis die oberen Spuren überschreitet, öffnet er seine Position zum Kaufen und wenn er die unteren Spuren bricht, öffnet er seine Position, um kurz zu gehen.
Strategieprinzip
-
Nach dem Schließen werden zwei Werte berechnet: der höchste Preis - der Schlusskurs und der Schlusskurs - der niedrigste Preis. Dann nehmen wir den größeren der beiden Werte und multiplizieren den Wert mit 0,7.
-
Nach der Öffnung des Marktes am nächsten Tag wird der Eröffnungspreis erfasst und sofort gekauft, wenn der Preis überschritten wird (Eröffnungspreis + Triggerwert), oder Shortpositionen verkauft, wenn der Preis unter dem Preis liegt (Eröffnungspreis - Triggerwert).
-
Diese Strategie hat keinen offensichtlichen Stop-Loss. Dieses System ist ein umgekehrtes System, d.h. wenn es eine Short-Positions-Order gibt, wenn der Preis übersteigt (Öffnungspreis + Triggerwert), wird es zwei Kauforders senden (einer schließt die falsche Position, der andere öffnet die richtige Position). Aus demselben Grund, wenn der Preis einer Long-Position niedriger als (Öffnungspreis - Triggerwert) ist, wird es zwei Verkaufsorders senden.
Mathematischer Ausdruck der DT-Strategie
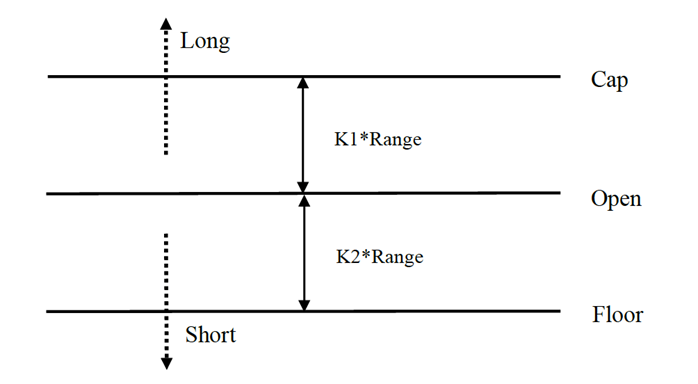
Bereich = maximal (HH-LC, HC-LL)
Die Berechnungsmethode für das Längspositionssignal lautet:
Der Wert der Verbrennungsmenge ist zu berücksichtigen, wenn die Verbrennungsmenge nicht überschritten ist.
Die Berechnungsmethode für das Short-Positionssignal lautet:
Boden = offen
Wenn K1 größer als K2 ist, wird das Long-Positionssignal ausgelöst und umgekehrt. Für die Demonstration wählen wir K1=K2=0.5. Bei tatsächlichen Transaktionen können wir historische Daten immer noch verwenden, um diese Parameter zu optimieren oder die Parameter nach Markttrends anzupassen. Wenn Sie bullisch sind, sollte K1 kleiner als K2 sein. Wenn Sie bärisch sind, sollte K1 größer als K2 sein.
Das System ist ein Umkehrsystem. Wenn Anleger daher Short-Positionen halten, wenn der Preis den oberen Kurs überschreitet, sollten sie die Short-Positionen schließen, bevor sie Long-Positionen eröffnen. Wenn ein Anleger eine Long-Position hält, wenn der Preis den unteren Kurs überschreitet, sollten sie die Long-Position schließen, bevor sie eine neue Short-Position eröffnen.
Verbesserung der DT-Strategie:
In der Bereicheinstellung werden die vier Preispunkte (Hoch, Offen, Tief und Schließen) der letzten N Tage eingeführt, um die Bereiche in einem bestimmten Zeitraum relativ stabil zu machen, was für die tägliche Trendverfolgung angewendet werden kann.
Die Auslöserbedingungen für die Eröffnung von Long- und Short-Positionen der Strategie, unter Berücksichtigung des asymmetrischen Bereichs, sollte der Referenzbereich der Long- und Short-Transaktionen unterschiedliche Periodenzahlen auswählen, die auch durch die Parameter K1 und K2 bestimmt werden können.
Daher können Sie bei der Verwendung dieser Strategie einerseits auf die besten Parameter des historischen Daten-Backtestings zurückgreifen, andererseits können Sie K1 und K2 stufenweise entsprechend Ihrem Urteil über die Zukunft oder andere wichtige technische Indikatoren anpassen.
Dies ist eine typische Handelsmethode, bei der man auf Signale wartet, in den Markt eintritt, Arbitrage tätigt und dann den Markt verlässt, aber der Effekt ist hervorragend.
Bereitstellung einer DT-Strategie auf der FMZ Quant-Plattform
Wir öffnen.FMZ.COM, melden Sie sich bei Ihrem Konto an, klicken Sie auf das Dashboard und setzen Sie den Docker und den Roboter ein.
Bitte beachten Sie meinen vorherigen Artikel über die Bereitstellung eines Dockers und eines Roboters:https://www.fmz.com/bbs-topic/9864.
Leser, die ihren eigenen Cloud-Computing-Server kaufen möchten, um Dockers zu implementieren, können sich auf diesen Artikel beziehen:https://www.fmz.com/digest-topic/5711.
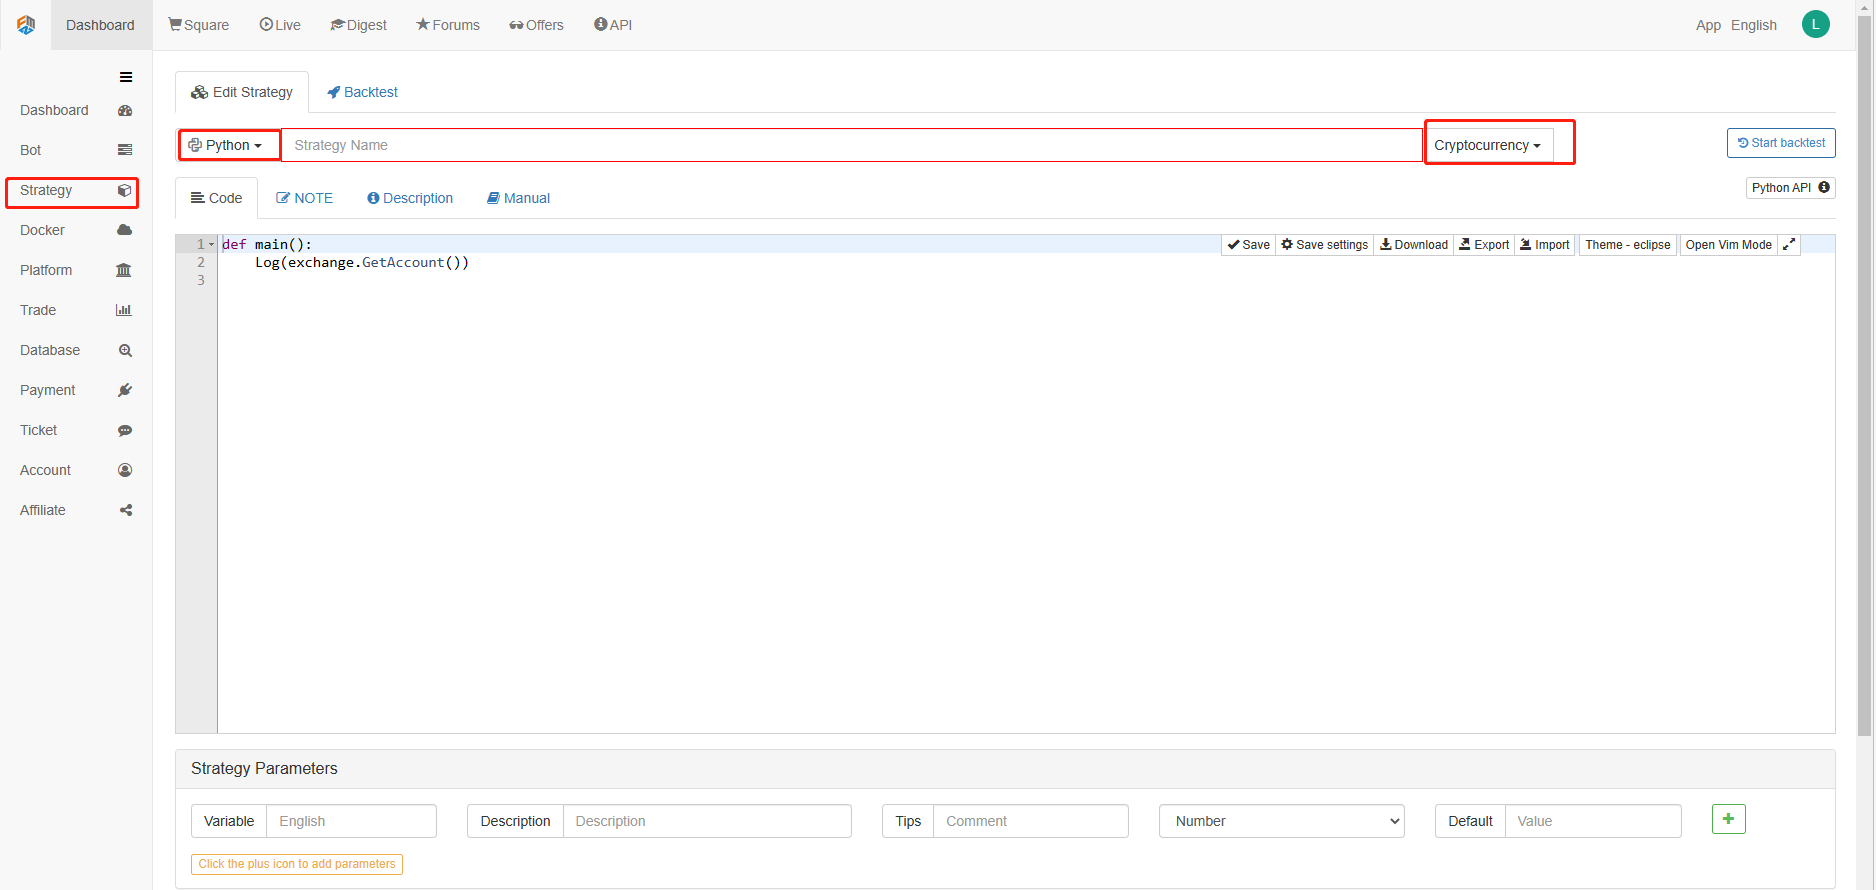
Als nächstes klicken wir auf die Strategiebibliothek in der linken Spalte und klicken auf Strategie hinzufügen.
Denken Sie daran, die Programmiersprache als Python in der oberen rechten Ecke der Strategiebearbeitungsseite auszuwählen, wie in der Abbildung gezeigt:
Als nächstes schreiben wir Python-Code in die Codebearbeitungsseite. Der folgende Code hat sehr detaillierte Zeile-für-Zeile Kommentare, Sie können sich Zeit nehmen zu verstehen.
Wir werden OKCoin-Futures verwenden, um die Strategie zu testen:
import time # Here we need to introduce the time library that comes with python, which will be used later in the program.

class Error_noSupport(BaseException): # We define a global class named ChartCfg to initialize the strategy chart settings. Object has many attributes about the chart function. Chart library: HighCharts.
    def __init__(self): # log out prompt messages
        Log("Support OKCoin Futures only! #FF0000")

class Error_AtBeginHasPosition(BaseException):
    def __init__(self):
        Log("Start with a futures position! #FF0000")

ChartCfg = {
    '__isStock': True, # This attribute is used to control whether to display a single control data series (you can cancel the display of a single data series on the chart). If you specify __isStock: false, it will be displayed as a normal chart.
    'title': { # title is the main title of the chart
        'text': 'Dual Thrust upper and bottom track chart' # An attribute of the title text is the text of the title, here set to 'Dual Thrust upper and bottom track chart' the text will be displayed in the title position.
    },
    'yAxis': { # Settings related to the Y-axis of the chart coordinate.
        'plotLines': [{ # Horizontal lines on the Y-axis (perpendicular to the Y-axis), the value of this attribute is an array, i.e. the setting of multiple horizontal lines.
            'value': 0, # Coordinate value of horizontal line on Y-axis
            'color': 'red', # Color of horizontal line
            'width': 2, # Line width of horizontal line
            'label': {  # Labels on the horizontal line
                'text': 'Upper track', # Text of the label
                'align': 'center' # The display position of the label, here set to center (i.e.: 'center')
            },
        }, {       # The second horizontal line ([{...} , {...}] the second element in the array)
            'value': 0, # Coordinate value of horizontal line on Y-axis
            'color': 'green', # Color of horizontal line
            'width': 2,  # Line width of horizontal line
            'label': { # Label
                'text': 'bottom track',
                'align': 'center'
            },
        }]
    },
    'series': [{ # Data series, that is, data used to display data lines, K-lines, tags, and other contents on the chart. It is also an array whose first index is 0.
        'type': 'candlestick', # Type of data series with index 0: 'candlestick' indicates a K-line chart.
        'name': 'Current period',  # Name of the data series
        'id': 'primary', # The ID of the data series, which is used for the related settings of the next data series.
        'data': []  # An array of data series to store specific K-line data
    }, {
        'type': 'flags',  # Data series, type: 'flags', display labels on the chart, indicating going long and going short. Index is 1.
        'onSeries': 'primary',  # This attribute indicates that the label is displayed on id 'primary'.
        'data': []    # The array that holds the label data.
    }]
}

STATE_IDLE = 0  # Status constants, indicating idle
STATE_LONG = 1 # Status constants, indicating long positions
STATE_SHORT = 2 # Status constants, indicating short positions
State = STATE_IDLE # Indicates the current program status, assigned as idle initially

LastBarTime = 0  # The time stamp of the last column of the K-line (in milliseconds, 1000 milliseconds is equal to 1 second, and the timestamp is the number of milliseconds from January 1, 1970 to the present time is a large positive integer).
UpTrack = 0   # Upper track value
BottomTrack = 0 # Bottom track value
chart = None # It is used to accept the chart control object returned by the Chart API function. Use this object (chart) to call its member function to write data to the chart.
InitAccount = None # Initial account status
LastAccount = None # Latest account status
Counter = { # Counters for recording profit and loss counts
    'w': 0, # Number of wins
    'l': 0  # Number of losses
}

def GetPosition(posType):  # Define a function to store account position information
    positions = exchange.GetPosition() # exchange.GetPosition() is the FMZ Quant official API. For its usage, please refer to the official API document: https://www.fmz.com/api.
    return [{'Price': position['Price'], 'Amount': position['Amount']} for position in positions if position['Type'] == posType] # Return to various position information

def CancelPendingOrders(): # Define a function specifically for withdrawing orders
    while True: # Loop check
        orders = exchange.GetOrders() # If there is a position
        [exchange.CancelOrder(order['Id']) for order in orders if not Sleep(500)] # Withdrawal statement
        if len(orders) == 0: # Logical judgment
            break

def Trade(currentState,nextState): # Define a function to determine the order placement logic.
    global InitAccount,LastAccount,OpenPrice,ClosePrice # Define the global scope
    ticker = _C(exchange.GetTicker) # For the usage of _C, please refer to: https://www.fmz.com/api.
    slidePrice = 1 # Define the slippage value
    pfn = exchange.Buy if nextState == STATE_LONG else exchange.Sell # Buying and selling judgment logic
    if currentState != STATE_IDLE: # Loop start
        Log(_C(exchange.GetPosition)) # Log information
        exchange.SetDirection("closebuy" if currentState == STATE_LONG else "closesell") # Adjust the order direction, especially after placing the order.
        while True:
            ID = pfn( (ticker['Last'] - slidePrice) if currentState == STATE_LONG else (ticker['Last'] + slidePrice), AmountOP) # Price limit order, ID=pfn (- 1, AmountOP) is the market price order, ID=pfn (AmountOP) is the market price order.
            Sleep(Interval) # Take a break to prevent the API from being accessed too often and your account being blocked.
            Log(exchange.GetOrder(ID)) # Log information
            ClosePrice = (exchange.GetOrder(ID))['AvgPrice'] # Set the closing price
            CancelPendingOrders() # Call the withdrawal function
            if len(GetPosition(PD_LONG if currentState == STATE_LONG else PD_SHORT)) == 0: # Order withdrawal logic
                break
        account = exchange.GetAccount() # Get account information
        if account['Stocks'] > LastAccount['Stocks']: # If the current account currency value is greater than the previous account currency value.
            Counter['w'] += 1 # In the profit and loss counter, add one to the number of profits.
        else:
            Counter['l'] += 1 # Otherwise, add one to the number of losses.
        Log(account) # log information
        LogProfit((account['Stocks'] - InitAccount['Stocks']),"Return rates:", ((account['Stocks'] - InitAccount['Stocks']) * 100 / InitAccount['Stocks']),'%')
        Cal(OpenPrice,ClosePrice)
        LastAccount = account

    exchange.SetDirection("buy" if nextState == STATE_LONG else "sell") # The logic of this part is the same as above and will not be elaborated.
    Log(_C(exchange.GetAccount))
    while True:
        ID = pfn( (ticker['Last'] + slidePrice) if nextState == STATE_LONG else (ticker['Last'] - slidePrice), AmountOP)
        Sleep(Interval)
        Log(exchange.GetOrder(ID))
        CancelPendingOrders()
        pos = GetPosition(PD_LONG if nextState == STATE_LONG else PD_SHORT)
        if len(pos) != 0:
            Log("Average price of positions",pos[0]['Price'],"Amount:",pos[0]['Amount'])
            OpenPrice = (exchange.GetOrder(ID))['AvgPrice']
            Log("now account:",exchange.GetAccount())
            break

def onTick(exchange): # The main function of the program, within which the main logic of the program is processed.
    global LastBarTime,chart,State,UpTrack,DownTrack,LastAccount # Define the global scope
    records = exchange.GetRecords() # For the usage of exchange.GetRecords(), please refer to: https://www.fmz.com/api.
    if not records or len(records) <= NPeriod: # Judgment statements to prevent accidents.
        return
    Bar = records[-1] # Take the penultimate element of records K-line data, that is, the last bar.
    if LastBarTime != Bar['Time']:
        HH = TA.Highest(records, NPeriod, 'High')  # Declare the HH variable, call the TA.Highest function to calculate the maximum value of the highest price in the current K-line data NPeriod period and assign it to HH.
        HC = TA.Highest(records, NPeriod, 'Close') # Declare the HC variable to get the maximum value of the closing price in the NPeriod period.
        LL = TA.Lowest(records, NPeriod, 'Low') # Declare the LL variable to get the minimum value of the lowest price in the NPeriod period.
        LC = TA.Lowest(records, NPeriod, 'Close') # Declare LC variable to get the minimum value of the closing price in the NPeriod period. For specific TA-related applications, please refer to the official API documentation.

        Range = max(HH - LC, HC - LL)  # Calculate the range
        UpTrack = _N(Bar['Open'] + (Ks * Range))  # The upper track value is calculated based on the upper track factor Ks of the interface parameters such as the opening price of the latest K-line bar.
        DownTrack = _N(Bar['Open'] - (Kx * Range)) # Calculate the down track value
        if LastBarTime > 0: # Because the value of LastBarTime initialization is set to 0, LastBarTime>0 must be false when running here for the first time. The code in the if block will not be executed, but the code in the else block will be executed.
            PreBar = records[-2] # Declare a variable means "the previous Bar" assigns the value of the penultimate Bar of the current K-line to it.
            chart.add(0, [PreBar['Time'], PreBar['Open'], PreBar['High'], PreBar['Low'], PreBar['Close']], -1) # Call the add function of the chart icon control class to update the K-line data (use the penultimate bar of the obtained K-line data to update the last bar of the icon, because a new K-line bar is generated).
        else:  # For the specific usage of the chart.add function, see the API documentation and the articles in the forum. When the program runs for the first time, it must execute the code in the else block. The main function is to add all the K-lines obtained for the first time to the chart at one time.
            for i in range(len(records) - min(len(records), NPeriod * 3), len(records)): # Here, a for loop is executed. The number of loops uses the minimum of the K-line length and 3 times the NPeriod, which can ensure that the initial K-line will not be drawn too much and too long. Indexes vary from large to small.
                b = records[i] # Declare a temporary variable b to retrieve the K-line bar data with the index of records.length - i for each loop.
                chart.add(0,[b['Time'], b['Open'], b['High'], b['Low'], b['Close']]) # Call the chart.add function to add a K-line bar to the chart. Note that if the last parameter of the add function is passed in -1, it will update the last Bar (column) on the chart. If no parameter is passed in, it will add Bar to the last. After executing the loop of i=2 (i-- already, now it's 1), it will trigger i > 1 for false to stop the loop. It can be seen that the code here only processes the bar of records.length - 2, and the last Bar is not processed.
        chart.add(0,[Bar['Time'], Bar['Open'], Bar['High'], Bar['Low'], Bar['Close']]) # Since the two branches of the above if do not process the bar of records.length - 1, it is processed here. Add the latest Bar to the chart.
        ChartCfg['yAxis']['plotLines'][0]['value'] = UpTrack  # Assign the calculated upper track value to the chart object (different from the chart control object chart) for later display.
        ChartCfg['yAxis']['plotLines'][1]['value'] = DownTrack # Assign lower track value
        ChartCfg['subtitle'] = { # Set subtitle
            'text': 'upper tarck' + str(UpTrack) + 'down track' + str(DownTrack) # Subtitle text setting. The upper and down track values are displayed on the subtitle.
        }
        chart.update(ChartCfg) # Update charts with chart class ChartCfg.
        chart.reset(PeriodShow) # Refresh the PeriodShow variable set according to the interface parameters, and only keep the K-line bar of the number of PeriodShow values.

        LastBarTime = Bar['Time'] # The timestamp of the newly generated Bar is updated to LastBarTime to determine whether the last Bar of the K-line data acquired in the next loop is a newly generated one.
    else: # If LastBarTime is equal to Bar.Time, that is, no new K-line Bar is generated. Then execute the code in {..}.
        chart.add(0,[Bar['Time'], Bar['Open'], Bar['High'], Bar['Low'], Bar['Close']], -1) # Update the last K-line bar on the chart with the last Bar of the current K-line data (the last Bar of the K-line, i.e. the Bar of the current period, is constantly changing).
    LogStatus("Price:", Bar["Close"], "up:", UpTrack, "down:", DownTrack, "wins:", Counter['w'], "losses:", Counter['l'], "Date:", time.time()) # The LogStatus function is called to display the data of the current strategy on the status bar.
    msg = "" # Define a variable msg.
    if State == STATE_IDLE or State == STATE_SHORT: # Judge whether the current state variable State is equal to idle or whether State is equal to short position. In the idle state, it can trigger long position, and in the short position state, it can trigger a long position to be closed and sell the opening position.
        if Bar['Close'] >= UpTrack: # If the closing price of the current K-line is greater than the upper track value, execute the code in the if block.
            msg = "Go long, trigger price:" + str(Bar['Close']) + "upper track" + str(UpTrack) # Assign a value to msg and combine the values to be displayed into a string.
            Log(msg) # message
            Trade(State, STATE_LONG) # Call the Trade function above to trade.
            State = STATE_LONG # Regardless of opening long positions or selling the opening position, the program status should be updated to hold long positions at the moment.
            chart.add(1,{'x': Bar['Time'], 'color': 'red', 'shape': 'flag', 'title': 'long', 'text': msg}) # Add a marker to the corresponding position of the K-line to show the open long position.

    if State == STATE_IDLE or State == STATE_LONG: # The short direction is the same as the above, and will not be repeated. The code is exactly the same.
        if Bar['Close'] <= DownTrack:
            msg = "Go short, trigger price:" + str(Bar['Close']) + "down track" + str(DownTrack)
            Log(msg)
            Trade(State, STATE_SHORT)
            State = STATE_SHORT
            chart.add(1,{'x': Bar['Time'], 'color': 'green', 'shape': 'circlepin', 'title': 'short', 'text': msg})

OpenPrice = 0 # Initialize OpenPrice and ClosePrice
ClosePrice = 0
def Cal(OpenPrice, ClosePrice): # Define a Cal function to calculate the profit and loss of the strategy after it has been run.
    global AmountOP,State
    if State == STATE_SHORT:
        Log(AmountOP,OpenPrice,ClosePrice,"Profit and loss of the strategy:", (AmountOP * 100) / ClosePrice - (AmountOP * 100) / OpenPrice, "Currencies, service charge:", - (100 * AmountOP * 0.0003), "USD, equivalent to:", _N( - 100 * AmountOP * 0.0003/OpenPrice,8), "Currencies")
        Log(((AmountOP * 100) / ClosePrice - (AmountOP * 100) / OpenPrice) + (- 100 * AmountOP * 0.0003/OpenPrice))
    if State == STATE_LONG:
        Log(AmountOP,OpenPrice,ClosePrice,"Profit and loss of the strategy:", (AmountOP * 100) / OpenPrice - (AmountOP * 100) / ClosePrice, "Currencies, service charge:", - (100 * AmountOP * 0.0003), "USD, equivalent to:", _N( - 100 * AmountOP * 0.0003/OpenPrice,8), "Currencies")
        Log(((AmountOP * 100) / OpenPrice - (AmountOP * 100) / ClosePrice) + (- 100 * AmountOP * 0.0003/OpenPrice))

def main(): # The main function of the strategy program. (entry function)
    global LoopInterval,chart,LastAccount,InitAccount # Define the global scope
    if exchange.GetName() != 'Futures_OKCoin':  # Judge if the name of the added exchange object (obtained by the exchange.GetName function) is not equal to 'Futures_OKCoin', that is, the object added is not OKCoin futures exchange object.
        raise Error_noSupport # Throw an exception
    exchange.SetRate(1) # Set various parameters of the exchange.
    exchange.SetContractType(["this_week","next_week","quarter"][ContractTypeIdx])  # Determine which specific contract to trade.
    exchange.SetMarginLevel([10,20][MarginLevelIdx]) # Set the margin rate, also known as leverage.

    if len(exchange.GetPosition()) > 0: # Set up fault tolerance mechanism.
        raise Error_AtBeginHasPosition
    CancelPendingOrders()
    InitAccount = LastAccount = exchange.GetAccount()
    LoopInterval = min(1,LoopInterval)
    Log("Trading platforms:",exchange.GetName(), InitAccount)
    LogStatus("Ready...")

    LogProfitReset()
    chart = Chart(ChartCfg)
    chart.reset()

    LoopInterval = max(LoopInterval, 1)
    while True: # Loop the whole transaction logic and call the onTick function.
        onTick(exchange)
        Sleep(LoopInterval * 1000) # Take a break to prevent the API from being accessed too frequently and the account from being blocked.
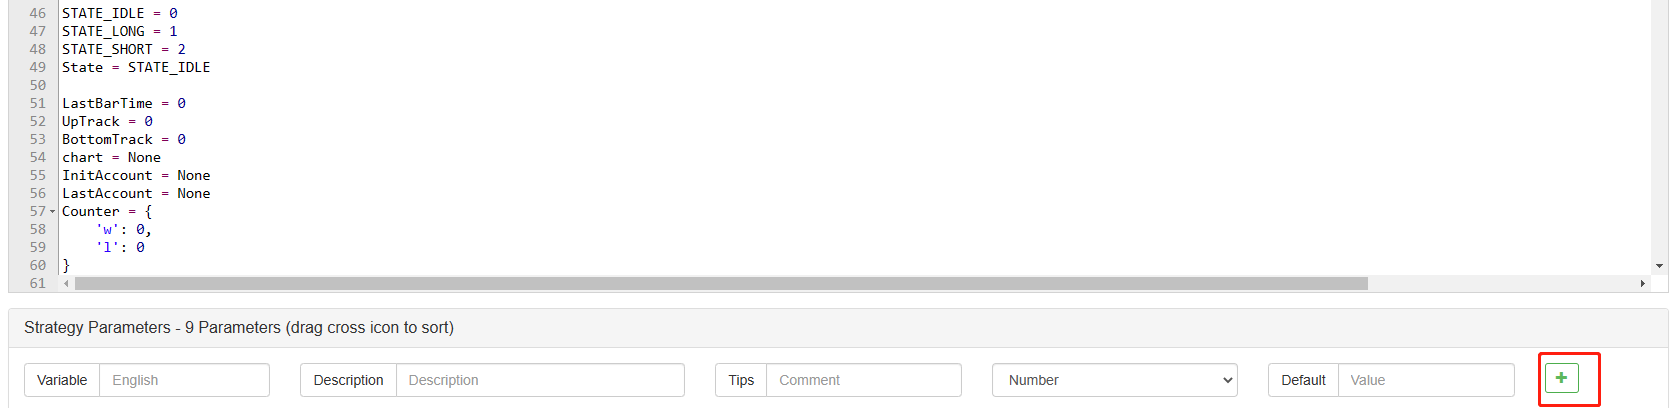
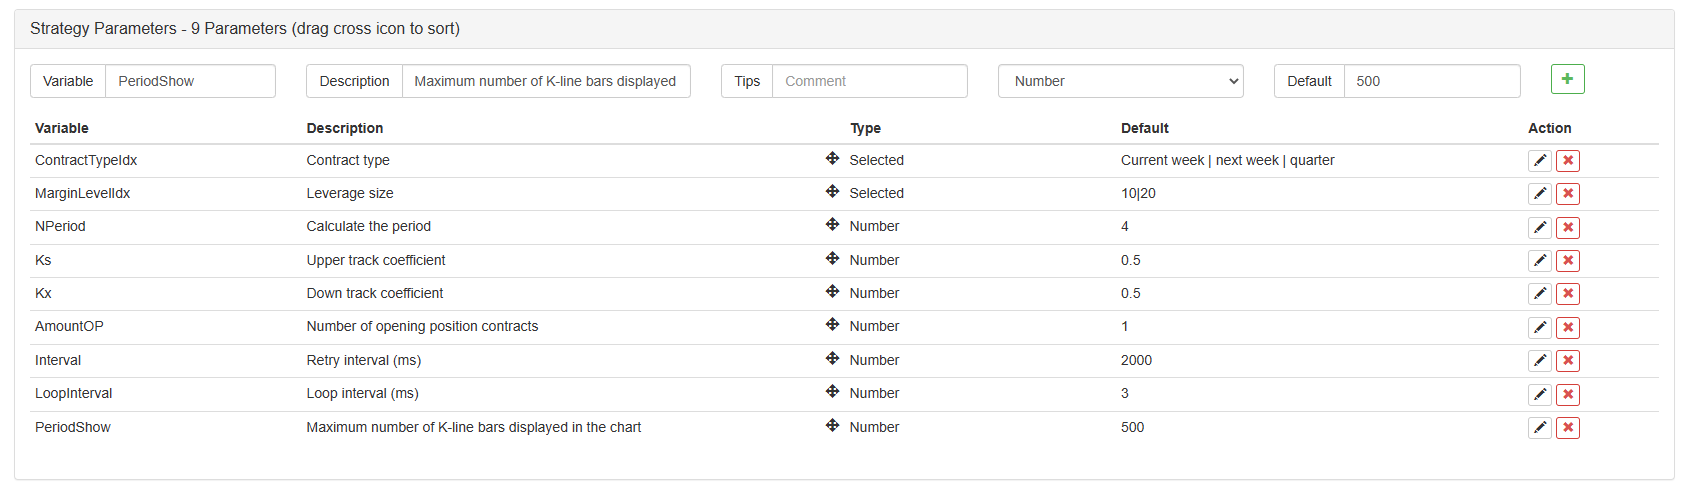
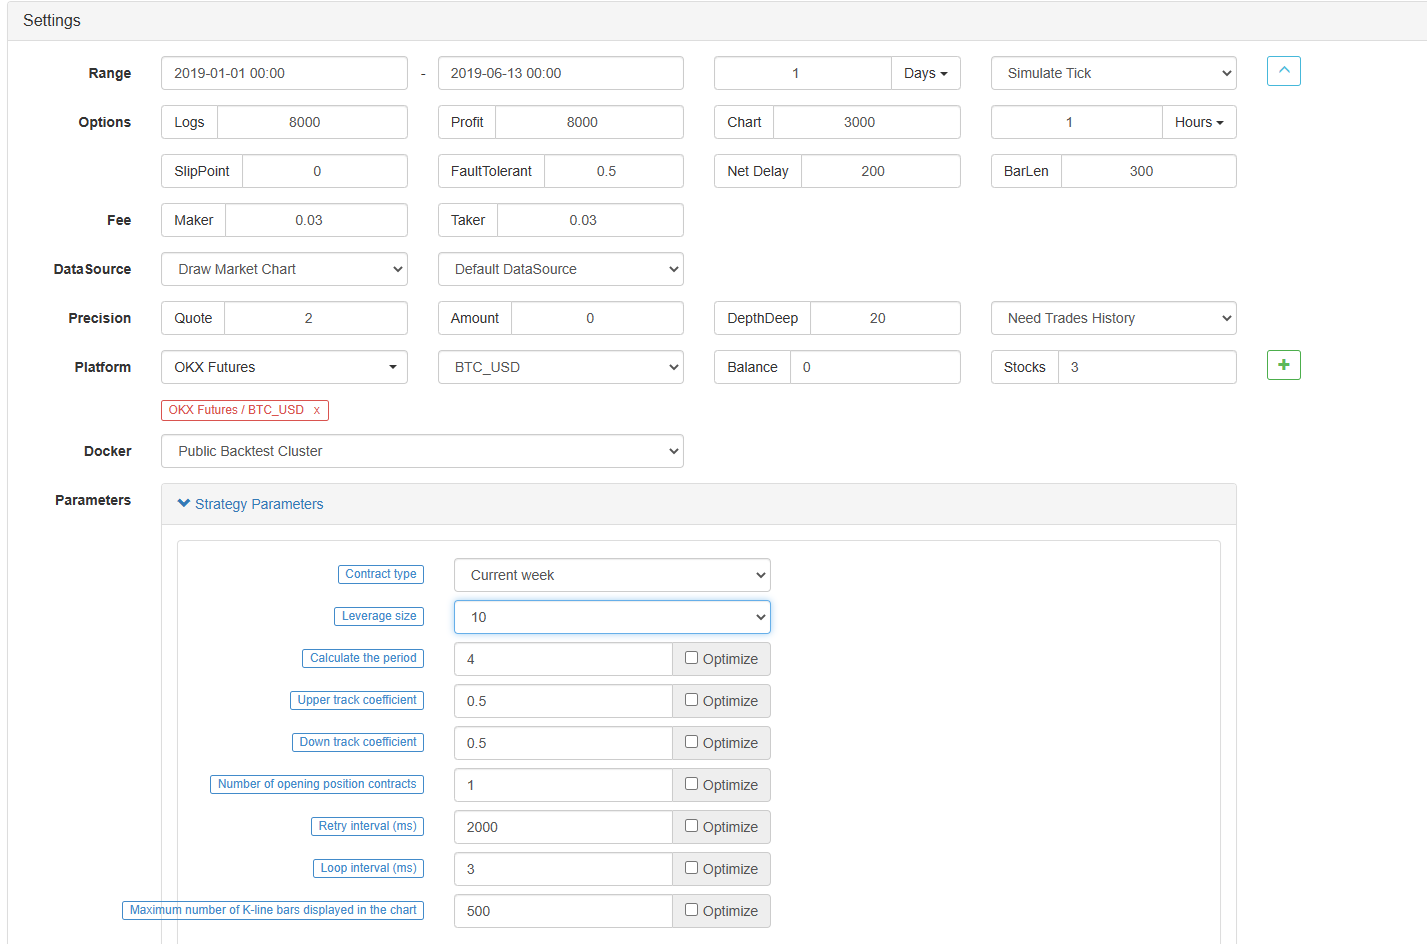
Nachdem wir den Code geschrieben haben, beachten Sie bitte, dass wir die gesamte Strategie noch nicht beendet haben. Als nächstes müssen wir die in der Strategie verwendeten Parameter auf der Strategiebearbeitungsseite hinzufügen. Die Hinzufügungsmethode ist sehr einfach. Klicken Sie einfach auf das Pluszeichen am unteren Rand des Dialogfelds Strategie schreiben, um sie einzeln hinzuzufügen.
Zusätzlicher Inhalt:
Bis jetzt haben wir endlich das Schreiben der Strategie abgeschlossen.
Strategie-Backtesting
Nachdem wir die Strategie geschrieben haben, müssen wir zuerst eine Rückprüfung durchführen, um zu sehen, wie sie sich in den historischen Daten verhält. Bitte beachten Sie jedoch, dass das Ergebnis des Rückprüfens nicht der Vorhersage der Zukunft entspricht. Der Rückprüfung kann nur als Referenz verwendet werden, um die Wirksamkeit unserer Strategie zu prüfen. Sobald sich der Markt ändert und die Strategie große Verluste verursacht, sollten wir das Problem rechtzeitig finden und dann die Strategie ändern, um sich an die neue Marktumgebung anzupassen, z. B. an die oben genannte Schwelle. Wenn die Strategie einen Verlust von mehr als 10% hat, sollten wir sofort den Betrieb der Strategie stoppen und dann das Problem finden. Wir können mit der Anpassung der Schwelle beginnen.
Klicken Sie auf Backtest auf der Strategiebearbeitungsseite. Auf der Backtestseite kann die Anpassung von Parametern bequem und schnell nach verschiedenen Bedürfnissen durchgeführt werden. Besonders für die Strategie mit komplexer Logik und vielen Parametern ist es nicht notwendig, zum Quellcode zurückzukehren und ihn nach und nach zu ändern.
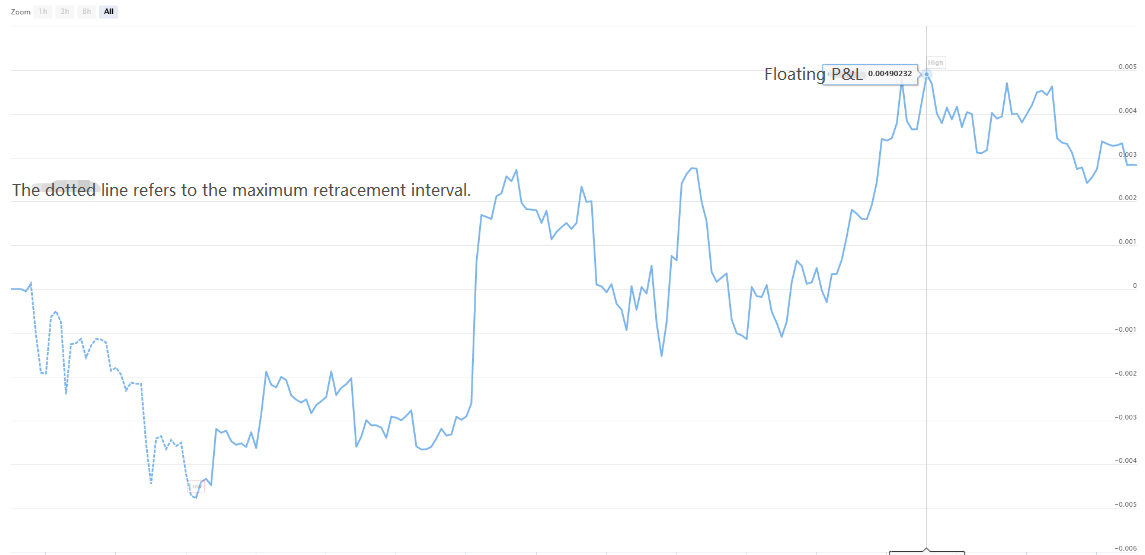
Die Backtestzeit beträgt die letzten sechs Monate. Klicken Sie auf OKCoin Futures Exchange hinzufügen und wählen Sie BTC Trading Target aus.
Es ist zu sehen, dass die Strategie in den letzten sechs Monaten aufgrund des sehr guten einseitigen Trends von BTC gute Renditen erzielt hat.

Wenn Sie Fragen haben, können Sie eine Nachricht hinterlassen:https://www.fmz.com/bbs, ob es sich um die Strategie oder die Technologie der Plattform handelt, hat die FMZ Quant-Plattform Fachleute, die bereit sind, Ihre Fragen zu beantworten.
- Quantifizierung der Fundamentalanalyse auf dem Kryptowährungsmarkt: Die Daten sprechen für sich!
- Die Quantifizierung der Kernforschung der Münzkreise - nicht mehr auf alle Arten von Lehrern zu vertrauen, die überzeugt sind, dass die Daten objektiv sind!
- Ein wichtiges Werkzeug im Bereich der Quantitative Transaktionen - der Erfinder der Quantitative Data Exploration Module
- Mastering Everything - Einführung in FMZ Neue Version des Handelsterminals (mit TRB Arbitrage Source Code)
- Die neue Version des FMZ-Trading-Terminals ist verfügbar.
- FMZ Quant: Eine Analyse von gemeinsamen Anforderungen Designbeispielen auf dem Kryptowährungsmarkt (II)
- Wie man Hirnlose Verkaufs-Bots mit einer Hochfrequenz-Strategie in 80 Codezeilen ausnutzt
- FMZ-Quantifizierung: Analyse von Designbeispielen für häufige Bedürfnisse im Kryptowährungsmarkt (II)
- Wie man Hirnlose Roboter ausbeuten und verkaufen kann mit einer 80-Zeilen-code-Hochfrequenz-Strategie
- FMZ Quant: Eine Analyse von gemeinsamen Anforderungen Designbeispielen auf dem Kryptowährungsmarkt (I)
- FMZ-Quantifizierung: Analyse von Designbeispielen für häufige Bedürfnisse im Kryptowährungsmarkt