
Verwenden Sie die Funktion KLineChart, um das Entwerfen von Strategiezeichnungen zu vereinfachen
Beim Entwerfen einer Strategie ist es häufig erforderlich, eine Strategiediagrammanzeige zu entwerfen, wenn zum Schreiben der Strategie JavaScript oder Python verwendet wird. Benutzer, die mit der Programmierung oder der von der FMZ-Plattform verwendeten Diagrammbibliothek nicht vertraut sind, haben häufig Probleme mit dem Codedesign zum Zeichnen benutzerdefinierter Diagramme. Wie können wir also ein Strategiediagramm mit umfangreichem Inhalt zeichnen, indem wir nur wenig Code schreiben?
Diese einfache, aber leistungsstarke Zeichenmethode ist in der Sprache Pine zu sehen, die für ihre umfangreichen Zeichenfunktionen bekannt ist. Wenn die Zeichenschnittstelle der Sprache Pine mit den Strategien der Sprachen JavaScript und Python verbunden werden kann, wird es Entwicklern erheblich erleichtert, die Zeichenfunktion der Strategie zu entwerfen. Aufgrund dieser Nachfrage hat die FMZ-Plattform die benutzerdefinierte Zeichenfunktion aktualisiert und ihre Nutzung erweitert.KLineChartDie Funktion führt eine benutzerdefinierte Diagrammzeichnung durch. Sie können die API-Dokumentation einsehen: https://www.fmz.com/api#klinechart
Lassen Sie uns mithilfe von JavaScript ein einfaches Beispiel für einen Übergang schreiben.
Einfaches Beispiel
javascript
/*backtest
start: 2022-03-21 09:00:00
end: 2022-06-21 15:00:00
period: 30m
basePeriod: 15m
exchanges: [{"eid":"Binance","currency":"BTC_USDT"}]
*/
function main() {
var c = KLineChart()
while (true) {
var bars = _C(exchange.GetRecords)
for (var i = 0 ; i < bars.length ; i++) {
var bar = bars[i]
c.begin(bar)
c.plot(bar.Volume, "volume")
c.close()
}
Sleep(1000)
}
}
Dieses Beispiel ist sehr einfach. Es zeichnet lediglich ein Candlestick-Diagramm im benutzerdefinierten Zeichenbereich der Strategie und zeichnet eine Volumenkurve, die jedem Candlestick-BAR in der Unterdiagrammposition des Diagramms entspricht.
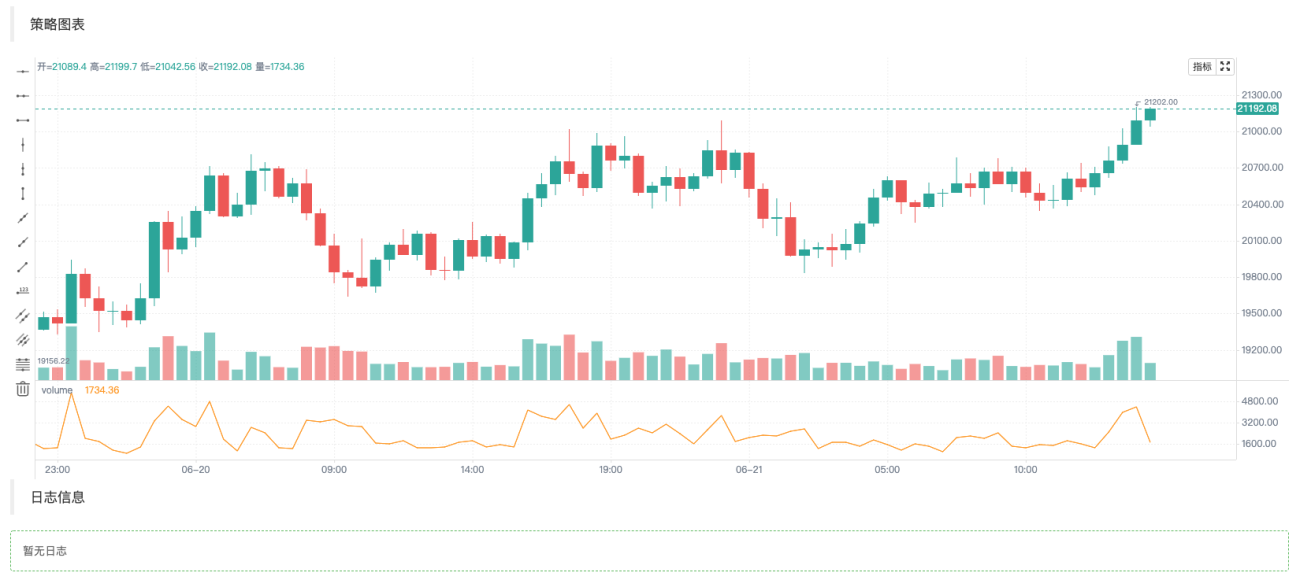
Im Code verwenden wir zunächstvar c = KLineChart()Erstellen Sie ein Diagrammobjekt und rufen Sie dann dessen Methoden zum Zeichnen auf. Dann erhalten wir in der Schleife die K-Zeilen-Daten (Array-Struktur) und durchlaufen das K-Zeilen-Array. Sie können zum Durchlaufen eine einfache For-Schleife wie im Beispiel verwenden oder andere Methoden nutzen.
Zeichenvorgänge sollten vonc.begin(bar)Die Funktion startet,c.close()Die Funktion wird beendet.begin、closeFunktionen sind Methoden des Chart-Objekts c. Verwenden Sie als Nächstes die am häufigsten verwendete ZeichenfunktionplotZeichnen Sie die Volumenkurve auf jeden Balken.
Ein komplexeres Beispiel
Angenommen, wir möchten ein Diagramm mit Bollinger-Indikatoren entwerfen. Ach ja! Außerdem ist es notwendig, für jeden BAR ein Volumendiagramm anzuhängen, das wie folgt gestaltet sein kann:
            javascript

            /*backtest
start: 2022-03-21 09:00:00
end: 2022-06-21 15:00:00
period: 1d
basePeriod: 1h
exchanges: [{"eid":"Binance","currency":"BTC_USDT"}]
*/

function main() {
    var c = KLineChart()

    // 策略主循环
    while(true) {
        // 轮询间隔
        Sleep(500)

        // 获取K线数据
        let bars = exchange.GetRecords()
        if (!bars || bars.length <= 20) {
            continue
        }

        // 计算布林指标
        var boll = TA.BOLL(bars)

        bars.forEach(function(bar, index) {
            c.begin(bar)
            // 画图操作
            c.plot(boll[0][index], "Boll_Up", {overlay: true})     // 画在图表主图
            c.plot(boll[1][index], "Boll_Mid", {overlay: true})    // 画在图表主图
            c.plot(boll[2][index], "Boll_Down", {overlay: true})   // 画在图表主图
            c.plot(bar.Volume, "volume")                           // 画在图表副图
            c.close()
        })

        // 策略交易逻辑
        // ...
        // ..
    }
}
Sie können im Code sehen, dass unsere Backtest-Konfigurationsinformationen auf der FMZ-Plattform wie folgt lauten:
            /*backtest
start: 2022-03-21 09:00:00
end: 2022-06-21 15:00:00
period: 1d
basePeriod: 1h
exchanges: [{"eid":"Binance","currency":"BTC_USDT"}]
*/
Diese Konfiguration wird mithilfe des Binance Spot Exchange-Objekts einem Backtest unterzogen. Die Backtest-Ergebnisse sind in der Abbildung dargestellt:
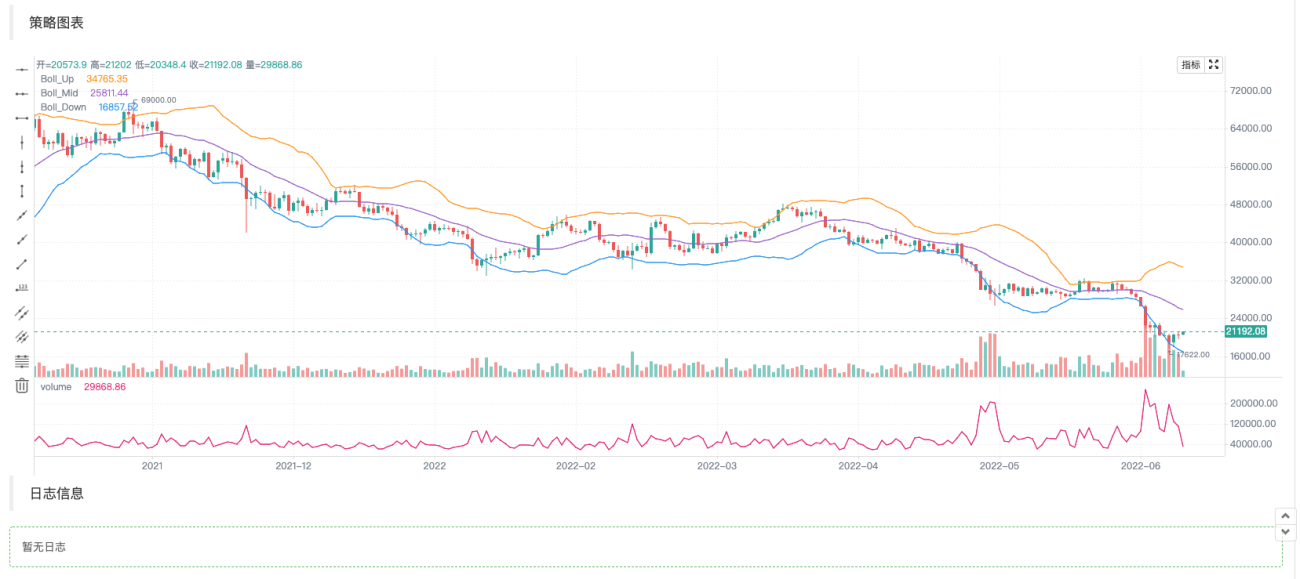
Es ist ersichtlich, dass wir die Zeichenmethode von Pine verwenden, um den Zeichencode in der JavaScript-Sprache erheblich zu vereinfachen.
Schreiben Sie Indikatoren und andere Daten, um Bilder zu zeichnen
Vorgänge wie das Abrufen von K-Line-Daten und das Berechnen von Indikatoren sind in den Strategiebeispielen und API-Dokumenten des Strategiequadrats der Plattform üblich und sehr einfach.
            javascript

                    // 获取K线数据
        let bars = exchange.GetRecords()
        if (!bars || bars.length <= 20) {
            // 如果获取K线失败,即!bar为真则执行continue,忽略之后的代码,重新执行循环
            // 如果bars.length小于等于20,即K线BAR(柱)数量小于20,无法计算指标,也执行continue
            continue
        }

        // 计算布林指标
        var boll = TA.BOLL(bars)
Berechnungsfunktion für den Bollinger-Indikator TA.BOLL. Wenn Sie die Parameter des Bollinger-Indikators nicht angeben, werden die Standardparameter verwendet.BOLL(20, 2). Der Bollinger-Indikator hat drei Linien, daher sind die von der Funktion TA.BOLL zurückgegebenen Daten ein zweidimensionales Array. Kugel[0]、boll[1]、boll[2] sind die drei Elemente des Boll-Arrays, von denen jedes eine Zeile darstellt und ein Array ist.
- boll[0]: Bollinger Bands Online
- boll[1]: Mittellinie der Bollinger Bänder
- boll[2]: Bollinger-Bänder nach unten
Dann werden wir sehen, wie das Volumen der K-Linien-Daten, also das Handelsvolumen, und die berechneten Bollinger-Indikatordaten in das Diagramm eingetragen werden.
Wir zeichnen die K-Linien-Daten Balken für Balken, daher müssen wir das gesamte K-Linien-Array durchlaufen, d. h. das Balken-Array im Code durchlaufen. Hier verwenden wirforEachDie Methodendurchquerung kann auch mithilfe einer For-Schleife durchgeführt werden.
            javascript

                    bars.forEach(function(bar, index) {
            c.begin(bar)
            // 画图操作
            c.plot(boll[0][index], "Boll_Up", {overlay: true})     // {overlay: true}参数控制,画在图表主图
            c.plot(boll[1][index], "Boll_Mid", {overlay: true})    // 画在图表主图
            c.plot(boll[2][index], "Boll_Down", {overlay: true})   // 画在图表主图
            c.plot(bar.Volume, "volume")                           // 画在图表副图
            c.close()
        })
Beachten Sie, dass Sie jedes Mal, wenn Sie mit dem Zeichnen eines Diagramms auf einem Balken beginnen, zuerstc.begin(bar)Funktionsaufrufe,beginEine Funktion ist eine Methode unseres Chart-Objekts c. Am Ende des Zeichenvorgangs müssen Sie anrufenc.close(). existierenbeginFunktionen undcloseZwischen den Funktionen befinden sich die von uns aufgerufenen Zeichenfunktionen, die der Zeichenmethode der Sprache Pine ähneln. Unterstützung:barcolor bgcolor plot fill hline plotarrow plotshape plotchar plotcandle signal, Sie können Linien und Pfeile zeichnen, Informationen markieren usw. Die Parameter dieser Funktionen stimmen mit den entsprechenden Funktionsparametern der Pine-Sprache überein, und die Zeichenfunktionen stimmen ebenfalls überein.
Handelssignalpfeile, Markierungen, horizontale Linien und andere Zeichnungen hinzugefügt
Fügen Sie dem obigen Zeichnungsbeispiel des Bollinger-Indikators einige Handelssignalpfeile, Markierungen und horizontale Linien hinzu.
            javascript

            /*backtest
start: 2022-03-21 09:00:00
end: 2022-06-21 15:00:00
period: 1d
basePeriod: 1h
exchanges: [{"eid":"Binance","currency":"BTC_USDT"}]
*/

function main() {
    var c = KLineChart()

    // 策略主循环
    while(true) {
        // 轮询间隔
        Sleep(500)

        // 获取K线数据
        let bars = exchange.GetRecords()
        if (!bars || bars.length <= 20) {
            continue
        }

        // 计算布林指标
        var boll = TA.BOLL(bars)

        bars.forEach(function(bar, index) {
            c.begin(bar)
            // 画图操作
            c.plot(boll[0][index], "Boll_Up", {overlay: true})     // 画在图表主图
            c.plot(boll[1][index], "Boll_Mid", {overlay: true})    // 画在图表主图
            c.plot(boll[2][index], "Boll_Down", {overlay: true})   // 画在图表主图
            c.plot(bar.Volume, "volume")                           // 画在图表副图

            c.hline(bar.Open, {overlay: true})                                         // 水平线
            c.plotarrow(bar.Close - bar.Open, {overlay: true})                         // 箭头
            c.plotshape(bar.Close - bar.Open > 0, {style: 'square', overlay: true})    // 画方块标记
            c.plotchar(bar.Close - bar.Open < 0, {char: '❄', size: "20px", overlay: true})           // 画出字符❄
            if (boll[0][index] && bar.Close > boll[0][index]) {
                c.signal("long", bar.Close, 1.5)
            } else if (boll[2][index] && bar.Close < boll[2][index]) {
                c.signal("closelong", bar.Close, 1.5)
            }

            c.close()
        })

        // 策略交易逻辑
        // ...
        // ..
    }
}
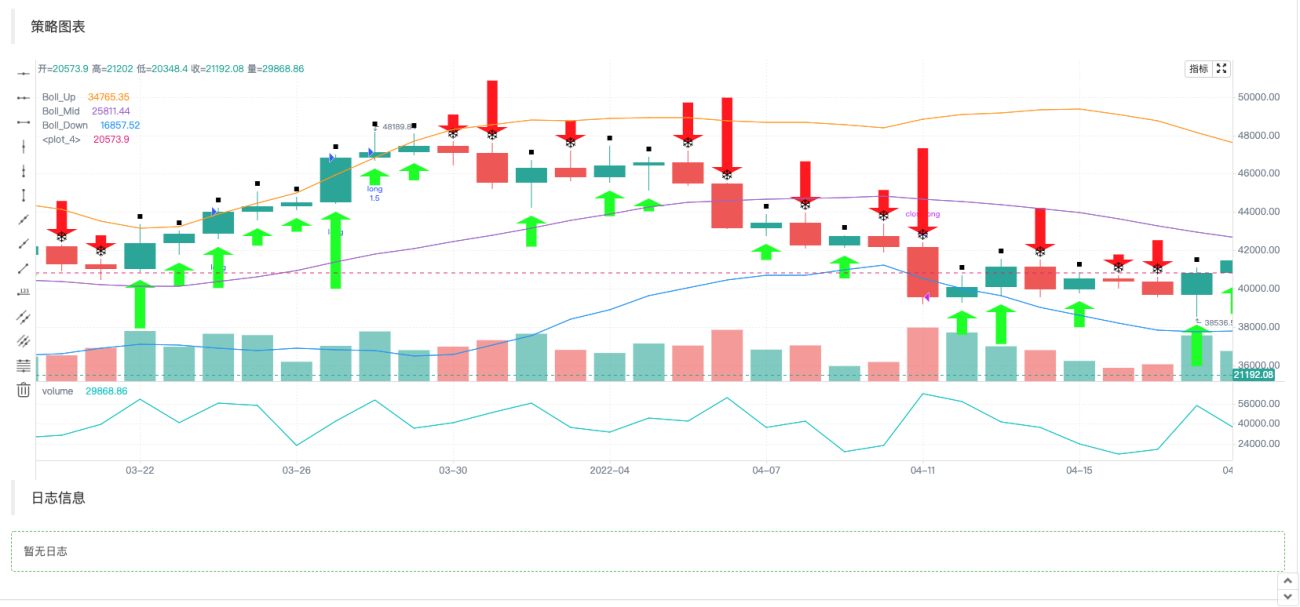
Da die Orderoperation der Pine-Sprachstrategie das Signal automatisch im Diagramm markiert,KLineChartDas von der Funktion erstellte Chartobjekt wird außerdem um eine Funktion zum Zeichnen von Kauf- und Verkaufssignalmarkierungen erweitert:c.signal。
Diagrammkonfigurationsobjekt
Sie können eine Struktur deklarieren, um den Diagrammstil zu konfigurieren. Die folgende chartCfg-Variable stellt beispielsweise die Konfigurationsinformationen einer Rasterlinie dar.
            javascript

                var chartCfg = {
        grid: {
            show: true,
            // 网格水平线
            horizontal: {
                show: true,
                size: 2,
                color: '#FF0000',    // 水平网格线的颜色
                // 'solid'|'dash'
                style: 'dash',       // 线的类型
                dashValue: [2, 2]
            },
   	        // 网格垂直线
            vertical: {
                show: true,
                size: 2,
                color: '#32CD32',
                // 'solid'|'dash'
                style: 'solid',
                dashValue: [2, 2]
            }
        },
    }
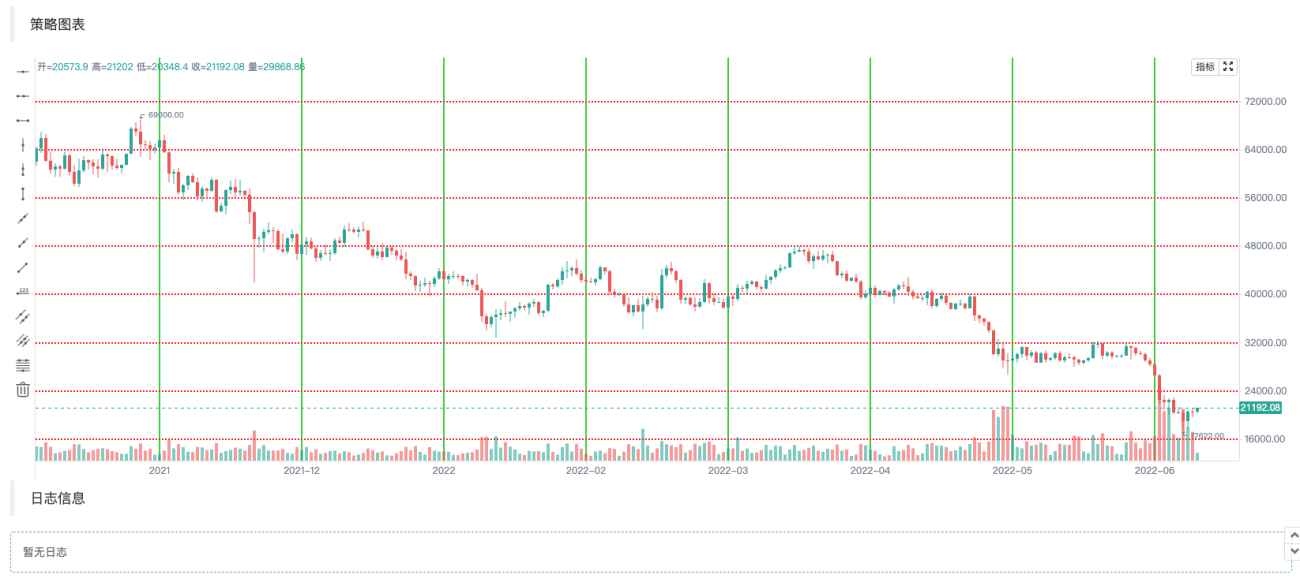
Das Diagrammkonfigurationsobjekt ist eine Datenstruktur, die einige Eigenschaften und das Erscheinungsbild des Diagramms festlegt. Das Beispiel verwendet beispielsweise eine Konfiguration im Rasterlinienstil. Es gibt auch viele Optionen, die konfiguriert und geändert werden können, wie z. B. die zugehörigen Einstellungen der X-Achse und Y-Achse, die Einstellungen der Cursorlinie, die Einstellungen der Eingabeaufforderungsinformationen, die Einstellungen des technischen Indikatorstils, die Einstellungen des K-Line-BAR-Stils usw.
Wenn Sie damit nicht vertraut sind,KLineChartDie Funktion muss beim Erstellen eines Diagrammobjekts kein Diagrammkonfigurationsobjekt übergeben. Das erstellte Diagramm weist den Standardstil auf. Nutzung der API-Funktionen der FMZ-PlattformKLineChartFunktion zum Erstellen eines Diagrammobjekts:
            javascript

            var c = KLineChart(chartCfg)
Testcode zum Zeichnen von Gitternetzlinien:
            javascript

            /*backtest
start: 2022-03-21 09:00:00
end: 2022-06-21 15:00:00
period: 1d
basePeriod: 1h
exchanges: [{"eid":"Binance","currency":"BTC_USDT"}]
*/

function main() {
    var chartCfg = {
        grid: {
            show: true,
            // 网格水平线
            horizontal: {
                show: true,
                size: 2,
                color: '#FF0000',
                // 'solid'|'dash'
                style: 'dash',
                dashValue: [2, 2]
            },
   	        // 网格垂直线
            vertical: {
                show: true,
                size: 2,
                color: '#32CD32',
                // 'solid'|'dash'
                style: 'solid',
                dashValue: [2, 2]
            }
        },
    }

    var c = KLineChart(chartCfg)

    // 策略主循环
    while(true) {
        // 轮询间隔
        Sleep(500)

        // 获取K线数据
        var bars = _C(exchange.GetRecords)
        bars.forEach(function(bar, index) {
            c.begin(bar)
            c.close()
        })

        // 策略交易逻辑
        // ...
        // ..
    }
}
Beispiel für einen Diagrammkonfigurationsstil
Kann verwendet werden, um auf die Einstellungen des Diagrammkonfigurationsstils zu verweisen.
javascript
{
// 网格线
grid: {
show: true,
// 网格水平线
horizontal: {
show: true,
size: 1,
color: '#393939',
// 'solid'|'dash'
style: 'dash',
dashValue: [2, 2]
},
// 网格垂直线
vertical: {
show: false,
size: 1,
color: '#393939',
// 'solid'|'dash'
style: 'dash',
dashValue: [2, 2]
}
},
// 蜡烛图
candle: {
// 蜡烛图上下间距,大于1为绝对值,大于0小余1则为比例
margin: {
top: 0.2,
bottom: 0.1
},
// 蜡烛图类型 'candle_solid'|'candle_stroke'|'candle_up_stroke'|'candle_down_stroke'|'ohlc'|'area'
type: 'candle_solid',
// 蜡烛柱
bar: {
upColor: '#26A69A',
downColor: '#EF5350',
noChangeColor: '#888888'
},
// 面积图
area: {
lineSize: 2,
lineColor: '#2196F3',
value: 'close',
backgroundColor: [{
offset: 0,
color: 'rgba(33, 150, 243, 0.01)'
}, {
offset: 1,
color: 'rgba(33, 150, 243, 0.2)'
}]
},
priceMark: {
show: true,
// 最高价标记
high: {
show: true,
color: '#D9D9D9',
textMargin: 5,
textSize: 10,
textFamily: 'Helvetica Neue',
textWeight: 'normal'
},
// 最低价标记
low: {
show: true,
color: '#D9D9D9',
textMargin: 5,
textSize: 10,
textFamily: 'Helvetica Neue',
textWeight: 'normal',
},
// 最新价标记
last: {
show: true,
upColor: '#26A69A',
downColor: '#EF5350',
noChangeColor: '#888888',
line: {
show: true,
// 'solid'|'dash'
style: 'dash',
dashValue: [4, 4],
size: 1
},
text: {
show: true,
size: 12,
paddingLeft: 2,
paddingTop: 2,
paddingRight: 2,
paddingBottom: 2,
color: '#FFFFFF',
family: 'Helvetica Neue',
weight: 'normal',
borderRadius: 2
}
}
},
// 提示
tooltip: {
// 'always' | 'follow_cross' | 'none'
showRule: 'always',
// 'standard' | 'rect'
showType: 'standard',
labels: ['时间', '开', '收', '高', '低', '成交量'],
values: null,
defaultValue: 'n/a',
rect: {
paddingLeft: 0,
paddingRight: 0,
paddingTop: 0,
paddingBottom: 6,
offsetLeft: 8,
offsetTop: 8,
offsetRight: 8,
borderRadius: 4,
borderSize: 1,
borderColor: '#3f4254',
backgroundColor: 'rgba(17, 17, 17, .3)'
},
text: {
size: 12,
family: 'Helvetica Neue',
weight: 'normal',
color: '#D9D9D9',
marginLeft: 8,
marginTop: 6,
marginRight: 8,
marginBottom: 0
}
}
},
// 技术指标
technicalIndicator: {
margin: {
top: 0.2,
bottom: 0.1
},
bar: {
upColor: '#26A69A',
downColor: '#EF5350',
noChangeColor: '#888888'
},
line: {
size: 1,
colors: ['#FF9600', '#9D65C9', '#2196F3', '#E11D74', '#01C5C4']
},
circle: {
upColor: '#26A69A',
downColor: '#EF5350',
noChangeColor: '#888888'
},
// 最新值标记
lastValueMark: {
show: false,
text: {
show: false,
color: '#ffffff',
size: 12,
family: 'Helvetica Neue',
weight: 'normal',
paddingLeft: 3,
paddingTop: 2,
paddingRight: 3,
paddingBottom: 2,
borderRadius: 2
}
},
// 提示
tooltip: {
// 'always' | 'follow_cross' | 'none'
showRule: 'always',
// 'standard' | 'rect'
showType: 'standard',
showName: true,
showParams: true,
defaultValue: 'n/a',
text: {
size: 12,
family: 'Helvetica Neue',
weight: 'normal',
color: '#D9D9D9',
marginTop: 6,
marginRight: 8,
marginBottom: 0,
marginLeft: 8
}
}
},
// x轴
xAxis: {
show: true,
height: null,
// x轴线
axisLine: {
show: true,
color: '#888888',
size: 1
},
// x轴分割文字
tickText: {
show: true,
color: '#D9D9D9',
family: 'Helvetica Neue',
weight: 'normal',
size: 12,
paddingTop: 3,
paddingBottom: 6
},
// x轴分割线
tickLine: {
show: true,
size: 1,
length: 3,
color: '#888888'
}
},
// y轴
yAxis: {
show: true,
width: null,
// 'left' | 'right'
position: 'right',
// 'normal' | 'percentage' | 'log'
type: 'normal',
inside: false,
reverse: false,
// y轴线
axisLine: {
show: true,
color: '#888888',
size: 1
},
// y轴分割文字
tickText: {
show: true,
color: '#D9D9D9',
family: 'Helvetica Neue',
weight: 'normal',
size: 12,
paddingLeft: 3,
paddingRight: 6
},
// y轴分割线
tickLine: {
show: true,
size: 1,
length: 3,
color: '#888888'
}
},
// 图表之间的分割线
separator: {
size: 1,
color: '#888888',
fill: true,
activeBackgroundColor: 'rgba(230, 230, 230, .15)'
},
// 十字光标
crosshair: {
show: true,
// 十字光标水平线及文字
horizontal: {
show: true,
line: {
show: true,
// 'solid'|'dash'
style: 'dash',
dashValue: [4, 2],
size: 1,
color: '#888888'
},
text: {
show: true,
color: '#D9D9D9',
size: 12,
family: 'Helvetica Neue',
weight: 'normal',
paddingLeft: 2,
paddingRight: 2,
paddingTop: 2,
paddingBottom: 2,
borderSize: 1,
borderColor: '#505050',
borderRadius: 2,
backgroundColor: '#505050'
}
},
// 十字光标垂直线及文字
vertical: {
show: true,
line: {
show: true,
// 'solid'|'dash'
style: 'dash',
dashValue: [4, 2],
size: 1,
color: '#888888'
},
text: {
show: true,
color: '#D9D9D9',
size: 12,
family: 'Helvetica Neue',
weight: 'normal',
paddingLeft: 2,
paddingRight: 2,
paddingTop: 2,
paddingBottom: 2,
borderSize: 1,
borderColor: '#505050',
borderRadius: 2,
backgroundColor: '#505050'
}
}
},
// 图形
shape: {
point: {
backgroundColor: '#2196F3',
borderColor: '#2196F3',
borderSize: 1,
radius: 4,
activeBackgroundColor: '#2196F3',
activeBorderColor: '#2196F3',
activeBorderSize: 1,
activeRadius: 6
},
line: {
// 'solid'|'dash'
style: 'solid'
color: '#2196F3',
size: 1,
dashValue: [2, 2]
},
polygon: {
// 'stroke'|'fill'
style: 'stroke',
stroke: {
// 'solid'|'dash'
style: 'solid',
size: 1,
color: '#2196F3',
dashValue: [2, 2]
},
fill: {
color: 'rgba(33, 150, 243, 0.1)'
}
},
arc: {
// 'stroke'|'fill'
style: 'stroke',
stroke: {
// 'solid'|'dash'
style: 'solid',
size: 1,
color: '#2196F3',
dashValue: [2, 2]
},
fill: {
color: '#2196F3'
}
},
text: {
style: 'fill',
color: '#2196F3',
size: 12,
family: 'Helvetica Neue',
weight: 'normal',
offset: [0, 0]
}
},
annotation: {
// 'top' | 'bottom' | 'point'
position: 'top',
offset: [20, 0]
symbol: {
// 'diamond' | 'circle' | 'rect' | 'triangle' | 'custom' | 'none'
type: 'diamond',
size: 8,
color: '#2196F3',
activeSize: 10,
activeColor: '#FF9600'
}
},
tag: {
// 'top' | 'bottom' | 'point'
position: 'point',
offset: 0,
line: {
show: true,
style: LineStyle.DASH,
dashValue: [4, 2],
size: 1,
color: '#2196F3'
},
text: {
color: '#FFFFFF',
backgroundColor: '#2196F3',
size: 12,
family: 'Helvetica Neue',
weight: 'normal',
paddingLeft: 2,
paddingRight: 2,
paddingTop: 2,
paddingBottom: 2,
borderRadius: 2,
borderSize: 1,
borderColor: '#2196F3'
},
mark: {
offset: 0,
color: '#FFFFFF',
backgroundColor: '#2196F3',
size: 12,
family: 'Helvetica Neue',
weight: 'normal',
paddingLeft: 2,
paddingRight: 2,
paddingTop: 2,
paddingBottom: 2,
borderRadius: 2,
borderSize: 1,
borderColor: '#2196F3'
}
}
}
Wird dadurch das Zeichnen und Entwerfen von Strategien nicht einfacher?

梦总,感谢分享!
我请教一个场景,不知道现阶段使用KLineChart能否实现。 具体场景说明:
1、策略是多品种交易 ;
2、加载策略的时候,默认指定的品种进行图表的绘制,包括K线、指标、交易信号等等;
3、通过筛选框,选择其他的交易品种,获取历史K线绘制图表,直到当前时间对应的K线。
目的在于通过图表直接观察各个交易品种是否是合理开平仓的,交易是否正常。

1、策略是多品种交易 ;
对于多图表,KLineChart 函数不支持,可以使用画图接口Chart函数,可以参考多图表画线类库的设计。
2、加载策略的时候,默认指定的品种进行图表的绘制,包括K线、指标、交易信号等等;
单图表可以实现。
3、通过筛选框,选择其他的交易品种,获取历史K线绘制图表,直到当前时间对应的K线。
单图表可以实现,可以具体编写代码查询历史K线数据然后填充画图.
如果是多品种策略,建议使用Chart函数画图。KLineChart 函数目前只能单图表画图。
- 1