Parabolische SAR
Schriftsteller:ChaoZhang, Datum: 31.5.2022 19:01 UhrTags:SAR
Dies ist eine Neugestaltung des eingebauten Parabolic SAR-Indikators. Ich habe ein ordnungsgemäßes Eingabesystem hinzugefügt, eine Option, um Anfangspunkte für beide Linien hervorzuheben und eine Option, um die Punktebreite auszuwählen.
Parabolische SAR wurde ursprünglich von J. Welles Wilder entwickelt und in seinem Buch
Um zu wissen, welche Einstellungen für PSAR sind am rentabelsten auf Ihrem Instrument und Zeitrahmen können Sie dieses Tool verwenden
Zurückprüfung
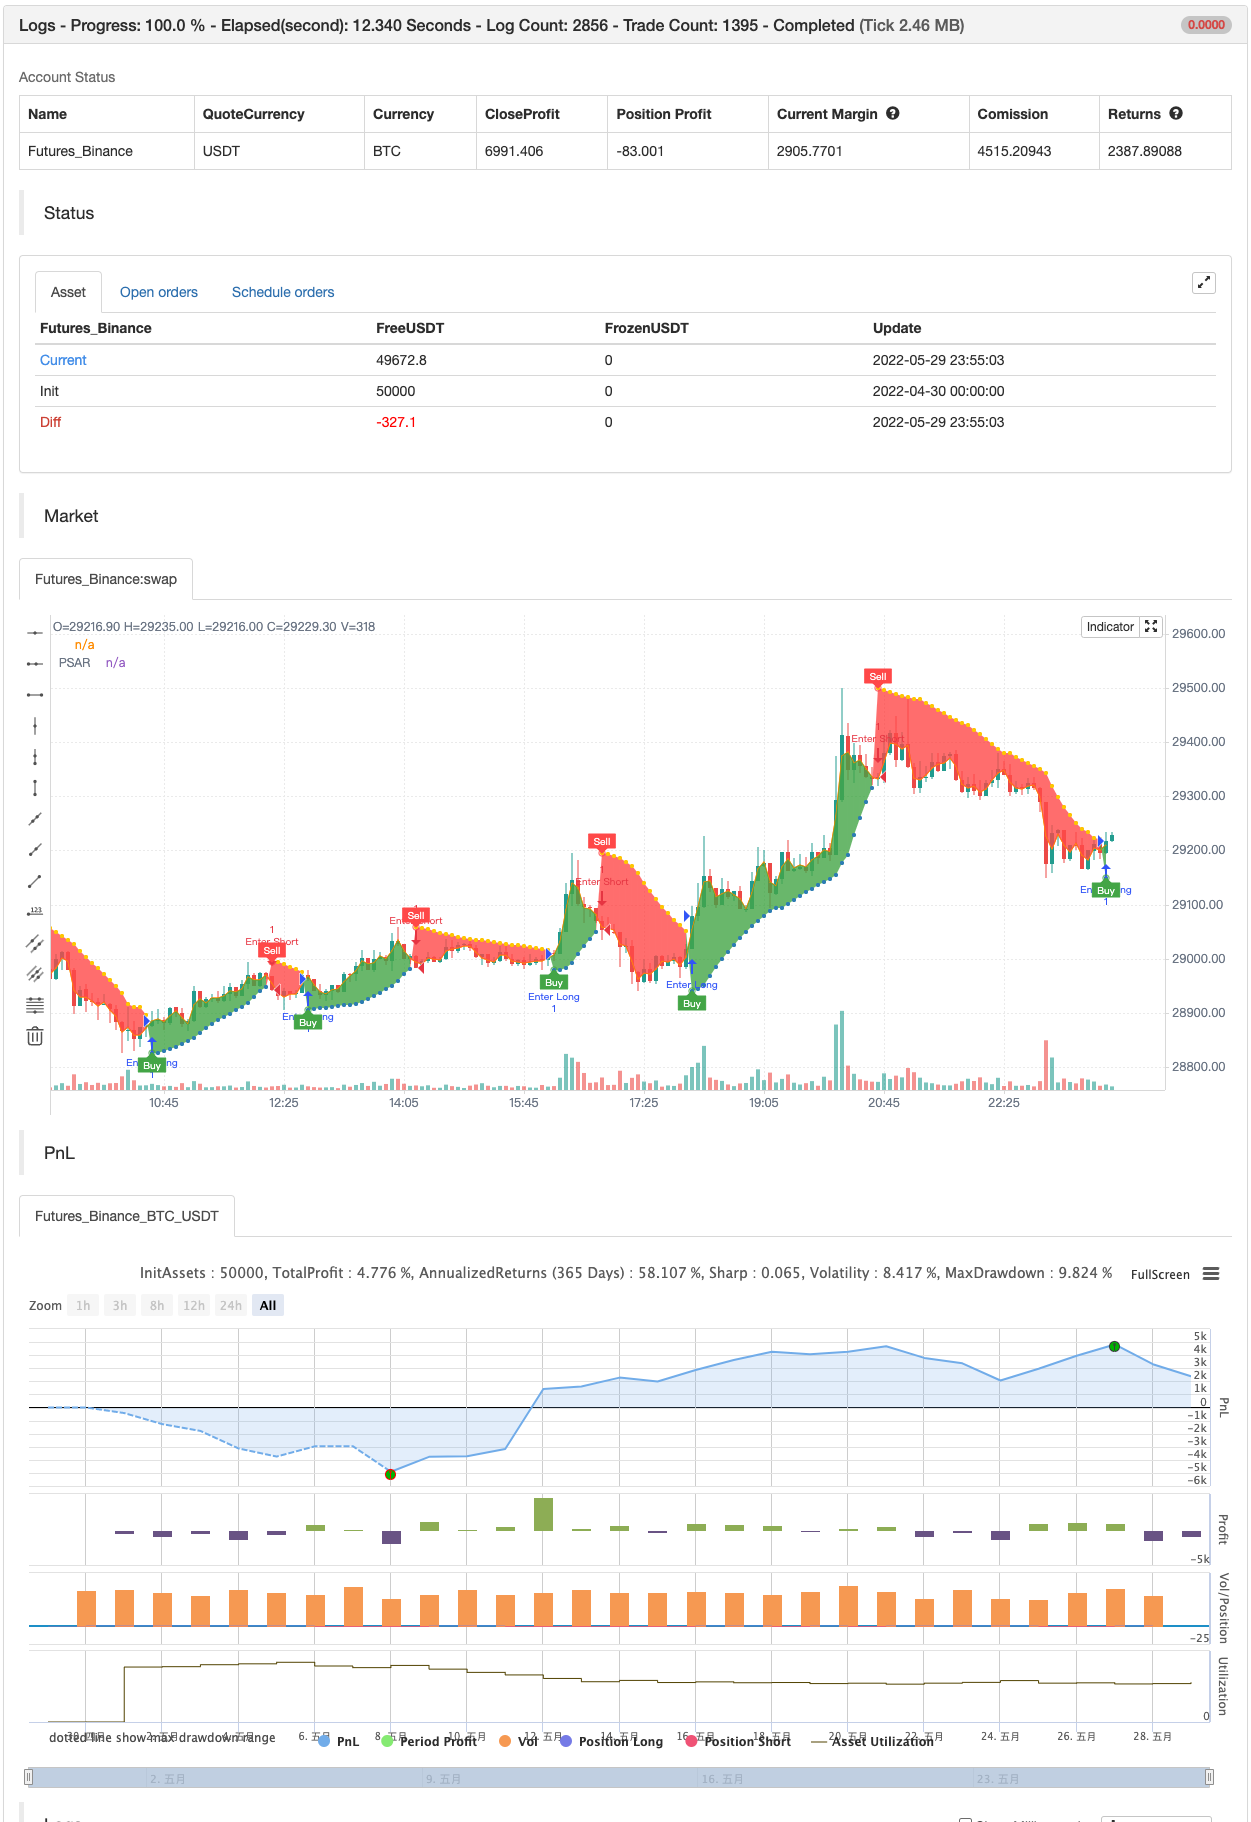
/*backtest
start: 2022-04-30 00:00:00
end: 2022-05-29 23:59:00
period: 5m
basePeriod: 1m
exchanges: [{"eid":"Futures_Binance","currency":"BTC_USDT"}]
*/

//@version=4
// Copyright (c) 2019-present, Alex Orekhov (everget)
// Parabolic SAR script may be freely distributed under the terms of the GPL-3.0 license.
study("Parabolic SAR", shorttitle="PSAR", overlay=true)

start = input(title="Start", type=input.float, step=0.001, defval=0.02)
increment = input(title="Increment", type=input.float, step=0.001, defval=0.02)
maximum = input(title="Maximum", type=input.float, step=0.01, defval=0.2)
width = input(title="Point Width", type=input.integer, minval=1, defval=2)
highlightStartPoints = input(title="Highlight Start Points ?", type=input.bool, defval=true)
showLabels = input(title="Show Buy/Sell Labels ?", type=input.bool, defval=true)
highlightState = input(title="Highlight State ?", type=input.bool, defval=true)

psar = sar(start, increment, maximum)
dir = psar < close ? 1 : -1

psarColor = dir == 1 ? #3388bb : #fdcc02
psarPlot = plot(psar, title="PSAR", style=plot.style_circles, linewidth=width, color=psarColor, transp=0)

var color longColor = color.green
var color shortColor = color.red

buySignal = dir == 1 and dir[1] == -1
plotshape(buySignal and highlightStartPoints ? psar : na, title="Long Start", location=location.absolute, style=shape.circle, size=size.tiny, color=longColor, transp=0)
plotshape(buySignal and showLabels ? psar : na, title="Buy Label", text="Buy", location=location.absolute, style=shape.labelup, size=size.tiny, color=longColor, textcolor=color.white, transp=0)

sellSignal = dir == -1 and dir[1] == 1
plotshape(sellSignal and highlightStartPoints ? psar : na, title="Short Start", location=location.absolute, style=shape.circle, size=size.tiny, color=shortColor, transp=0)
plotshape(sellSignal and showLabels ? psar : na, title="Sell Label", text="Sell", location=location.absolute, style=shape.labeldown, size=size.tiny, color=shortColor, textcolor=color.white, transp=0)

midPricePlot = plot(ohlc4, title="", display=display.none)

fillColor = highlightState ? (dir == 1 ? longColor : shortColor) : na
fill(midPricePlot, psarPlot, title="Trade State Filling", color=fillColor)

changeCond = dir != dir[1]
alertcondition(changeCond, title="Alert: PSAR Direction Change", message="PSAR has changed direction!")
alertcondition(buySignal, title="Alert: PSAR Long", message="PSAR Long")
alertcondition(sellSignal, title="Alert: PSAR Short", message="PSAR Sell")


if buySignal
    strategy.entry("Enter Long", strategy.long)
else if sellSignal
    strategy.entry("Enter Short", strategy.short)
Verwandt
- Elliott-Wellen-Theorie 4-9 Impulswellen automatische Detektion Handelsstrategie
- SAR - hoch und niedrig
- HIGH LOW SAR
- Parabolische SAR Kauf und Verkauf
- 15min BTCUSDTPERP BOT
Mehr
- TUE ADX/MACD Konfluenz V1.0
- Filter mit doppelter Reichweite
- SAR - hoch und niedrig
- Genaues Swing Trading System
- Lineare Entwicklung
- Fibonacci-Zeitmuster
- Darvas Box Kauf verkaufen
- Demark-Einstellungsindikator
- Bollinger-Bänder Stochastischer RSI Extreme
- Aktiengeschäft
- RSI-Divergenzindikator
- OBV-MACD-Indikator
- Pivot-Trend
- Preisdivergenzstrategie v1.0
- Unterstützungs-Widerstands-Ausbruch
- Anpassungsfähiger gleitender Durchschnitt der Steigung
- Der Ausgleichsbetrag für den Ausgleichsbetrag für den Ausgleichsbetrag für den Ausgleichsbetrag für den Ausgleichsbetrag
- Low Scanner Strategie Krypto
- [Blackcat] L2 Umkehrung Etiketten Strategie
- SuperB