The quantity-price relationship is an important indicator!
Author: The Little Dream, Created: 2016-12-24 11:32:51, Updated: 2016-12-24 11:40:22The quantity-price relationship is an important indicator!
Quantity price relationship is an important indicator, which can be used in the buying and selling of wave operation, belongs to a kind of technical judgment, and is the most crucial indicator. Because short-term quantity price can be deceiving, long-term quantity price relationship is difficult to do. You can light big disc, heavy stock. But if you want to judge the big disc, the basic is macroeconomic policy, etc., while the technical aspect requires the price. As it is said, the army is unmoved, the grain comes before the grain. As for the volume of trade, it has always been considered to be the straw that feeds the investment market, and the price is the manifestation of the market after the transaction. Quantity prices are fundamental to the technical side. In the market economic cycle, quantity price relations are also a regular manifestation. Take the example of the real estate industry in my own industry, which needs to go through recession, depression, recovery and boom four stages, respectively, corresponding to each stage of the relationship is a contraction of the price flat (recession), a contraction of the price flat (depression), a contraction of the price flat (depression), a steady recovery of the price flat (depression), a rise in the price flat (prosperity); and the stock market, as a rainy day of the economy.
In the later stages, I will combine the actual situation of a stock to tell you about the corresponding specific situation. Before explaining the example, it is necessary to explain to you first what is a gap between the two sides. Multi-party refers to investors who are optimistic about the stock market, expecting the stock price to go up, so they take advantage of the low price to buy the stock, wait for the stock to rise to a certain price and then sell it to get the difference.
-
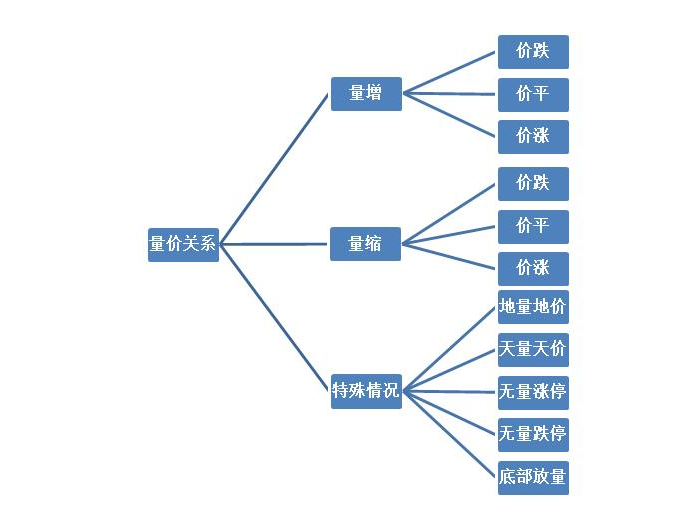
(a) The increase in quantity and the decrease in price
A drop in the price of a stock is a phenomenon in which the price of a stock increases when the price of the stock decreases, which means that there is a large divergence between the opinions of the two sides.
Situation one: the stock price is at a phased bottom. The volume price decline is often a manifestation of the continued strength of the upside, which indicates that the market buyer, although there is a split, but the downside force is greater, which leads to the force of the buyers of the market is not as much as the strength of the upside, and therefore there is a phenomenon of volume price decline. The appearance of such a phenomenon, often means that the real bottom is coming, as long as the energy of the upside is consumed as much as possible, there will be no falling down, that is, the special situation of the geographic volume price, often means that the turning point of the stock price is coming.
Scenario 2: The stock price is at a phased peak. The increase in price falls indicates that the main force has begun to ship, and the airline has increased the sales force. Due to the continuous rise in the stock price in the previous period, which has attracted many unknowns, the volume of transactions is often higher than the volume of transactions in the past.
-
(b) The price increase is flat
A volume-price parity refers to a situation in which the stock price fluctuates at a certain price level when the volume is increased. It means that there are many, empty parties, and there is no absolute control situation, such a phenomenon often occurs in horizontal shocks.
Scenario one: the stock price is at a phased bottom. The long-term volume price increase is flat, which means that many parties start to enter the performance, mainly to absorb the chips. Because it is in the early stages of building the warehouse, the main force is not obvious in the speed of eating goods, not causing excessive increases. At the same time, it is also assumed that most of the empty orders, resulting in an increase in the volume of transactions, but the price does not rise.
Scenario 2: The stock price is at a phased peak. The increase in volume is often a sign of the beginning of the strengthening of the head. When the stock price has a large increase, the empty side begins to ship in order to meet the needs, while many parties are still eager to buy chips, which leads to the stock to increase in turnover without a significant increase in price.
-
(iii) The increase in quantity
Quantitative price inflation is a phenomenon in which the price of a stock increases with the volume of trade. This means that there are many, empty opinions on both sides, but many still dominate.
Scenario one: The stock price is at a phased bottom. The increase in the price is often a manifestation of a multi-party attack and a multi-party positive trend. The retail market is not favorable in the after-market due to the urgent need to raise the price, so in the event that the price rises all the way, the process of washing up is accompanied by the process, while the retailers are in a hurry to deliver the chips, resulting in a situation of increased trading volume and a simultaneous rise in prices.
Scenario two: The stock price is at a phased peak. The quantity price increase is often a harbinger of the main force for the knock out. When the stock price is running at a high level, only the main force has a large number of chips, shaped the order, and at a high level it is difficult to take these chips, which will inevitably cause the stock price to fall. But now the stock price is rising, so the main force is a reasonable explanation for the knock out.
-
(iv) The price decreased
A decrease in the price of a stock is a measure of the price of a stock that decreases with a decrease in the volume of trading. It means that there are many, empty parties without branches, consistent downward look, that is, there are few successors.
Scenario one: The stock price is at a phased bottom. This situation indicates that there are many, empty parties collectively falling, there are many droppers, but not many pickers. This situation indicates that the empty energy has not yet been released, the stock price is likely to continue to fall, and it is necessary to continue to observe, until the price stabilizes under the apparent support of quantity.
Situation 2: The stock price is at a phased peak. Such a situation indicates that the stock has been highly controlled by the main force, not the main force that does not want to sell, but the main force that cannot find someone to take over the market. So the main force is left to a small number of retailers or the market, or see a buyer sell a chip below, so there is a phenomenon of a decrease in the price.
-
(v) The price is flat.
A liquidity situation is one in which the price of a stock decreases slightly, but the volume of trade decreases. Such a situation is more likely to be a case of leveraged buyout in order to find support for the stock price.
Scenario one: the stock price is at a phased bottom. The representative stock price will continue to bottom out, or the volume has already seen the bottom will have an opportunity to reverse. When the stock price stops falling, the early stages of the rebound if the phenomenon of flattening the price of the stock, representative of the bullish momentum has not yet been established, the majority must try to supplement the upside, otherwise the rise will not be too big.
Scenario 2: The share price is in the upward phase. In such a situation, the main institution should test the support position in a scaled down price level at the appropriate support, and the support position test can be linear.
-
(vi) Quantitative reduction of the price
Quantitative contraction is a phenomenon in which a stock's price rises significantly in the event of a decrease in trading volume, which means that there is a large, consensus of opinion on the expectation of a later increase.
Situation one: the stock price is at a phased bottom. The volume decrease in the price is indicative of a lot of, empty collective opinion on both sides, which leads to the sale is not easy to occur. It can also be shown that the chip is concentrated early in the main force hands, the main force has been highly controlled, the market circulation of the chip is very few, the main force is only slightly pushed, the stock price starts to rise.
Scenario two: the stock price is at a phased peak. This situation shows that the main force is highly controlling the market, but not that the main force does not want to sell, but that no one is willing to take delivery at such a high price, so the main force acts on its own and continues to maintain the rise in the stock. The main purpose of the main force at this stage is to ship, not to release any of the small takeovers.
-
(vii) The price of land
The ground price refers to the fact that the stock has also created a new low in a very low trading volume. This means that the stock is still not active and is an important sign that the stock has reached the bottom. The ground price means that the trading volume has been the lowest trading volume since the phase, and the ground price also refers to the novelty of the stock phase.
If the stock price has been continuously falling during the process, and there is no continuous bearish decline or phased bearish decline, then even if there is a so-called ground price, it does not mean that the market has appeared at the bottom, because the energy of the fall of the empty head has not yet been released, and the market is likely to fall further. Generally, the market must continue to fall until several heads completely lose confidence, the decline may stop, and the ground price will appear.
-
8) The price of the sky
The price of a stock is usually relatively high when a large amount of stock is traded, which is the extreme case of a volume increase in price. This means that the stock price is at the end of the upward trend. The price of a stock is the largest trading volume since the phased increase; the price of a stock corresponds to the highest price since the increase.
The price of the sky is often seen at the end of the upswing, indicating that the market is extremely crazy. Some people sell, but also a large number of people take over, thus creating a historic new high. Most cases are affected by irrational behavior. This also means that after the sky, the market gradually returns to rationality, then the stock price may fall, entering the adjustment phase.
-
(iv) The number of stops
A stock price freeze is a phenomenon that occurs when a stock is trading at a low volume. It is an extreme case of a stock price freeze, which means that there is basically no pressure, but at the same time there is a huge envelope. Such a situation often occurs when a company has a significant advantage, especially small and medium-sized stocks, which are preferred by landowners.
-
Ten, the number of crashes
A drop-off in the price of a stock is an extreme form of a drop in the price of a stock that occurs when there is little trading volume. It often occurs in stocks with significant news. This is mainly due to the fact that after some stocks have significant news, funds will not take into account the cost of flight, but no one takes over, causing the seller to buy less.
-
(Eleventh) The lower volume
Bottom volume refers to the phenomenon of a stock suddenly releasing a huge amount at a relatively low bottom, at which time the stock price may rise or fall. Because the bottom is often a relatively peaceful place, there is a lot of space at this time, but there is a huge difference of opinion between the two sides, because the bottom volume is also a special phenomenon.
This phenomenon often occurs when the decline of the stock is not yet completely digested, but suddenly there is a significant news impact, so there is a lot of uncertainty, and there is a huge divergence of opinion on both sides, which leads some people to see more after the market, some people see more after the market. If the majority of the incoming underwriters are retailers, then the latter will still continue to fall; if the incoming underwriters are mainstream institutions, then the latter may rise all the way.
Of course, the quantity-price relationship above is the most basic relationship, and the relationship between quantity and price evolves very differently, so we learn the basics first, and then move on to other more complex relationships. Although it is technical analysis, can it be applied to quantitative reference auxiliary analysis?
Source The web
- A synergistic understanding of intuition
- The hidden Markov model
- Interested in understanding the simplicity of Bayes
- 2.11 API: Simple example of use of Chart function (graph function)
- Details of the currency pair
- Beware of the Linear Mind Trap
- I've heard that reading like this can make a lot of money.
- The story of the escape and the survival of the gambler and the gambler
- 30 lines of code that takes you into the world of quantitative investing (python version)
- Gambling is a form of high-tech business
- A strong demand for the platform to add do-as-you-go retargeting
- How to read the Big Three financial statements in a way that's interesting and interesting?
- Mathematical thinking in investment finance, how many have you done?
- Why slippage occurs in programmatic transactions
- The core of money management -- the choice of leverage
- Financial knowledge
- Causes and uses of ionization rates
- What are the advantages of leveraged trading?
- Here are 20 questions you didn't know about futures trading tips!
- Robots often report mistakes and disconnect