2.11 API: Simple example of use of Chart function (graph function)
Author: The Little Dream, Created: 2016-12-27 16:39:31, Updated: 2017-10-11 10:22:22API: Simple example of use of Chart function (graph function)
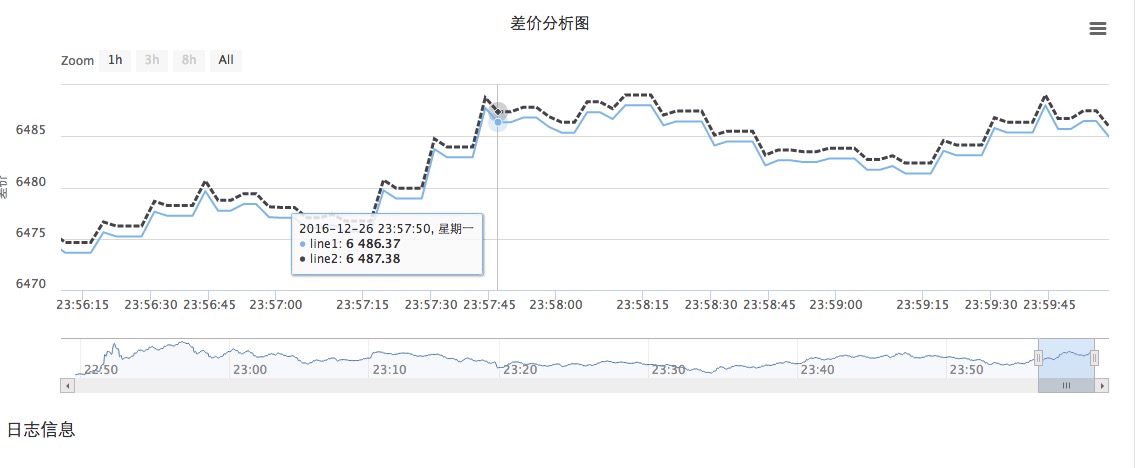
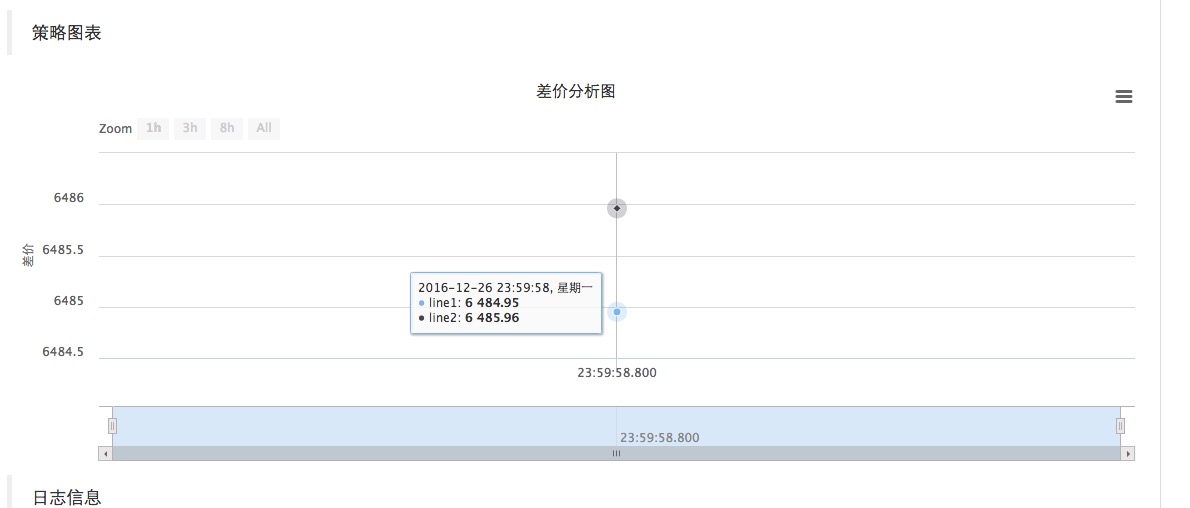
Some new students may feel uncomfortable when using the Chart function to display data. Here is the simplest example for reference and easy to expand.
-
The code is:
var chart = { // 这个 chart 在JS 语言中 是对象, 在使用Chart 函数之前我们需要声明一个配置图表的对象变量chart。
    __isStock: true,                                    // 标记是否为一般图表,有兴趣的可以改成 false 运行看看。
    tooltip: {xDateFormat: '%Y-%m-%d %H:%M:%S, %A'},    // 缩放工具
    title : { text : '差价分析图'},                       // 标题
    rangeSelector: {                                    // 选择范围
        buttons:  [{type: 'hour',count: 1, text: '1h'}, {type: 'hour',count: 3, text: '3h'}, {type: 'hour', count: 8, text: '8h'}, {type: 'all',text: 'All'}],
        selected: 0,
        inputEnabled: false
    },
    xAxis: { type: 'datetime'},                         // 坐标轴横轴 即:x轴, 当前设置的类型是 :时间
    yAxis : {                                           // 坐标轴纵轴 即:y轴, 默认数值随数据大小调整。
        title: {text: '差价'},                           // 标题
        opposite: false,                                // 是否启用右边纵轴
    },
    series : [                                          // 数据系列,该属性保存的是 各个 数据系列(线, K线图, 标签等..)
        {name : "line1", id : "线1,buy1Price", data : []},  // 索引为0, data 数组内存放的是该索引系列的 数据
        {name : "line2", id : "线2,lastPrice", dashStyle : 'shortdash', data : []}, // 索引为1,设置了dashStyle : 'shortdash' 即:设置 虚线。
    ]
};
function main(){
    var ObjChart = Chart(chart);  // 调用 Chart 函数,初始化 图表。
    ObjChart.reset();             // 清空
    while(true){
        var nowTime = new Date().getTime();   // 获取本次轮询的 时间戳,  即一个 毫秒 的时间戳。用来确定写入到图表的X轴的位置。
        var ticker = _C(exchange.GetTicker);  // 获取行情数据
        var buy1Price = ticker.Buy;           // 从行情数据的返回值取得 买一价
        var lastPrice = ticker.Last + 1;      // 取得最后成交价,为了2条线不重合在一起 ,我们加1
        ObjChart.add([0, [nowTime, buy1Price]]); // 用时间戳作为X值, 买一价 作为Y值 传入 索引0 的数据序列。
        ObjChart.add([1, [nowTime, lastPrice]]); // 同上。
        ObjChart.update(chart);                  // 更新图表以显示出来。
        Sleep(2000);
    }
}
-
The add function: ObjChart.add (([0, [nowTime, buy1Price]]);
The above is written as adding a data point to the graph.
ObjChart.add (([0, [nowTime, buy1Price], -1])); ObjChart.add is the name of the object. This is written as updating the last point. Just updating, not adding new points, so the graph always runs like this:
- A short history of risk (5) Bayes, a man who lives only in his textbooks
- A brilliant explanation for the alternative to stop loss
- 2.13 Common error messages, exchange API error codes, various problems encountered by digital currency robots!
- OkCoin China API error code requested
- The real volatility applied to the market basis of thinking about shushupengli trading ideas with pen
- 2.12 _D (()) Function and Timestamp
- python: Please be careful in these places.
- A synergistic understanding of intuition
- The hidden Markov model
- Interested in understanding the simplicity of Bayes
- Details of the currency pair
- Beware of the Linear Mind Trap
- I've heard that reading like this can make a lot of money.
- The story of the escape and the survival of the gambler and the gambler
- 30 lines of code that takes you into the world of quantitative investing (python version)
- Gambling is a form of high-tech business
- The quantity-price relationship is an important indicator!
- A strong demand for the platform to add do-as-you-go retargeting
- How to read the Big Three financial statements in a way that's interesting and interesting?
- Mathematical thinking in investment finance, how many have you done?
gzliangjianhuaI'm testing in Google Browser, as if the graph doesn't refresh in real time, it needs to refresh the browser manually to add new markets, and I don't know how to get it to automatically refresh in real time.
shandianliyuCan I add two pictures at the same time, please?
The Little DreamIs the data added using the Add method? ObjChart.update(chart); function calls are refreshed unless you directly modify the series data series in the chart of the chart configuration object. I'm not sure if this is the right way to do it.
Old cat likes fishThis is a drawing of multiple tables, can you draw a diagram?
The Little DreamWhen inputting the JSON.stringify() function, input [table1, table2], and that's it, there are instances in the API documentation.
Old cat likes fishCan you add a div yourself? I'm not sure how to do this.
shandianliyuOkay, I got it, thank you.
The Little DreamYou can also display a chart in the form of a page break, for example: This is a list of all the different ways Dn-filebox.qbox.me/4bbeb1ad63919280561 is credited in the database. You can see that there is a pie chart, a price chart, etc.; the simultaneous display is not yet implemented.