Inventors describe the mechanism of quantitative analogue level retesting
Author: The Little Dream, Created: 2017-02-07 13:04:57, Updated: 2023-09-07 17:49:15Inventors describe the mechanism of quantitative analogue level retesting
-
1, the back-measurement architecture
The inventor's quantified reticle strategy is a complete control process, where the program is continuously consulted at a certain frequency. The data returned by the various markets and trading APIs is also called at the time of the call, simulating the actual running situation. It belongs to the onTick level, not to the onBar level of other reticle systems.
-
2, Difference between analogue-level and real-dish level retesting
-
Simulated level retesting
Analogue-level backtesting is the simulation of ticker data input values to this Bar in the time sequence of the underlying K-line data of the backtesting system, according to a certain algorithm in the framework of the numerical composition of the highest, lowest, opening and closing prices of the underlying K-line Bar.
-
Repeat at the real disk level
Real disk-level retrieval is true ticker-level data in the time sequence of Bar. Using real disk-level retrieval is closer to true for ticker-level data-based strategies. The ticker is the actual data recorded, not the analogue generated.
-
-
3, analogue level retesting mechanism for the bottom K-line
There is no underlying K-line option for real disk-level retesting (because ticker data is real and is not simulated using the underlying K-line). In analogue-level retrieval, a ticker is generated based on the K-line data; this K-line data is the bottom K-line. In actual use of analogue-level retrieval, the bottom K-line cycle must be smaller than the period of the API to obtain the K-line when the policy is running. Otherwise, due to the large number of tickers generated, the data will be truly lost when the API to obtain the specified period is called.
-
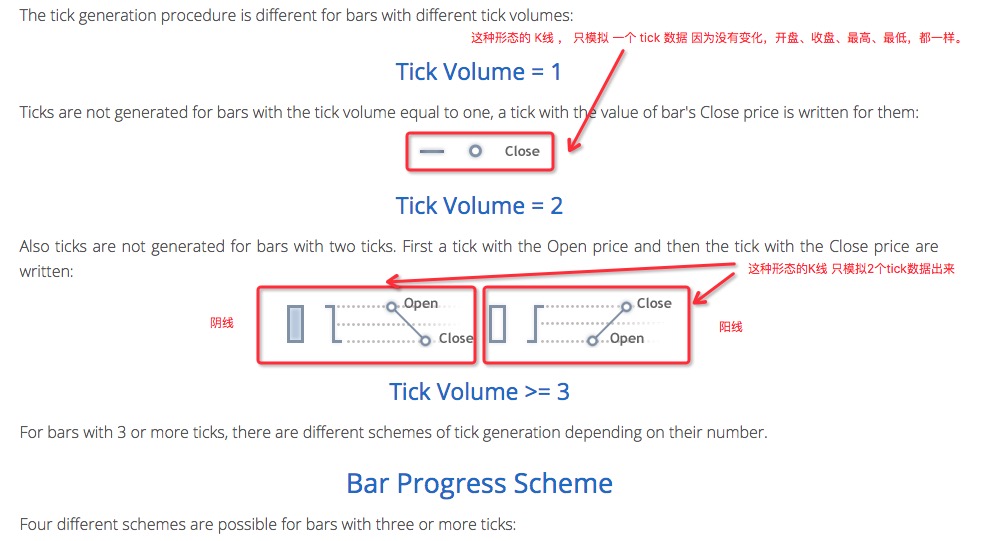
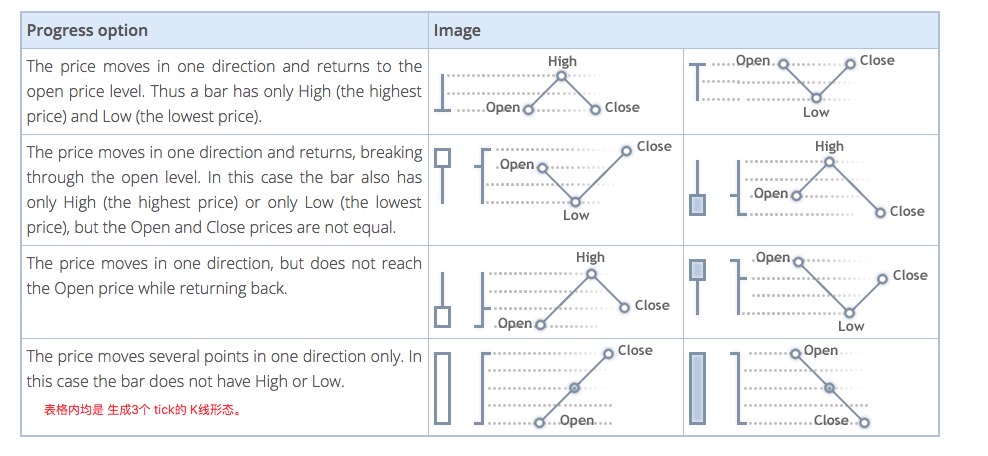
4 How the bottom K-line generates ticker data
The underlying K-line generates analog tickers the same way as MT4.
-
5, the algorithm code that generates ticker data
A specific algorithm to simulate tick data from the bottom K-line data:
function recordsToTicks(period, num_digits, records) {
if (records.length == 0) {
return []
}
var ticks = []
var steps = [0, 2, 4, 6, 10, 12, 16, 18, 23, 25, 27, 29]
var pown = Math.pow(10, num_digits)
function pushTick(t, price, vol) {
ticks.push([Math.floor(t), Math.floor(price * pown) / pown, vol])
}
for (var i = 0; i < records.length; i++) {
var T = records[i][0]
var O = records[i][1]
var H = records[i][2]
var L = records[i][3]
var C = records[i][4]
var V = records[i][5]
if (V > 1) {
V = V - 1
}
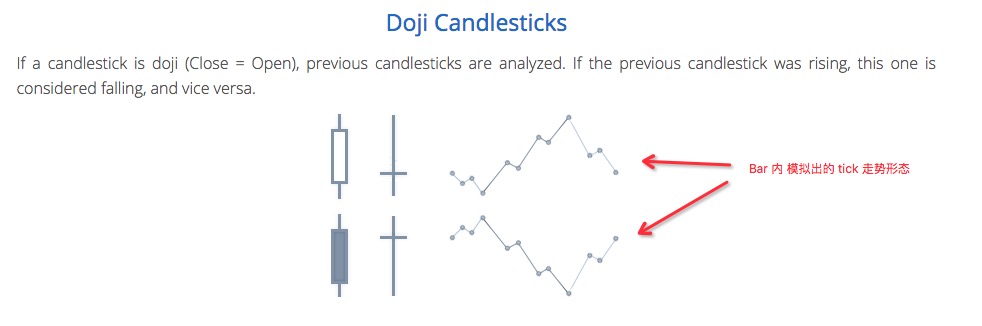
if ((O == H) && (L == C) && (H == L)) {
pushTick(T, O, V)
} else if (((O == H) && (L == C)) || ((O == L) && (H == C))) {
pushTick(T, O, V)
} else if ((O == C) && ((O == L) || (O == H))) {
pushTick(T, O, V / 2)
pushTick(T + (period / 2), (O == L ? H : L), V / 2)
} else if ((C == H) || (C == L)) {
pushTick(T, O, V / 2)
pushTick(T + (period * 0.382), (C == L ? H : L), V / 2)
} else if ((O == H) || (O == L)) {
pushTick(T, O, V / 2)
pushTick(T + (period * 0.618), (O == L ? H : L), V / 2)
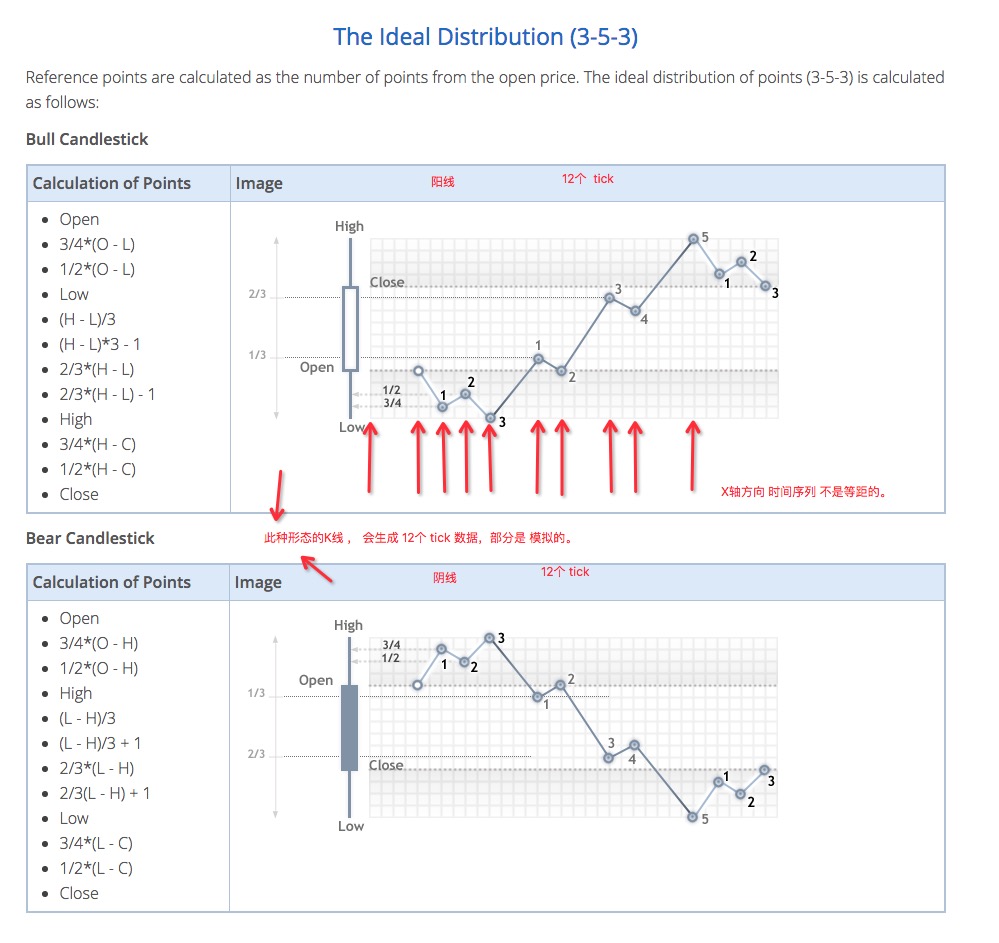
} else {
var dots = []
var amount = V / 11
pushTick(T, O, amount)
if (C > O) {
dots = [
O - (O - L) * 0.75,
O - (O - L) * 0.5,
L,
L + (H - L) / 3.0,
L + (H - L) * (4 / 15.0),
H - (H - L) / 3.0,
H - (H - L) * (6 / 15.0),
H,
H - (H - C) * 0.75,
H - (H - C) * 0.5,
]
} else {
dots = [
O + (H - O) * 0.75,
O + (H - O) * 0.5,
H,
H - (H - L) / 3.0,
H - (H - L) * (4 / 15.0),
H - (H - L) * (2 / 3.0),
H - (H - L) * (9 / 15.0),
L,
L + (C - L) * 0.75,
L + (C - L) * 0.5,
]
}
for (var j = 0; j < dots.length; j++) {
pushTick(T + period * (steps[j + 1] / 30.0), dots[j], amount)
}
}
pushTick(T + (period * 0.98), C, 1)
}
return ticks
}
Therefore, when using analogue-level retracement, there is a price jump in the time sequence.
- It's incredible how easy it is to make a profit on futures.
- 2.10.2 Variable values in the API documentation
- Your biggest enemy is inertial thinking.
- Foolish trading: the power of rules
- 2.7.1 Windows 32-bit system Python 2.7 environment Install the talib index library
- Details of futures options
- Why are many commodity futures contracts primarily traded in January, May and September each year?
- China's four largest futures exchanges exposed
- 1.4 Futures Basics of knowledge
- Not support market order error
- The K-Line is not compatible with mainstream channels.
- Quantitative trading "reverse investment from the mean to the return"
- I've been reading a lot about equity, counter-equity, the profit formula, the gambler's loss theorem (very inspiring).
- The Deutsche Bank study notes several common mistakes in the quantification strategy
- Bitcoin contracts for okcoin: the dollar-renminbi exchange rate problem
- The more complex the method, the more it deviates from the essence of the transaction.
- Quantified trading strategies for the CCI indicator
- Commodity futures reassessment price changes are not continuous
- About data storage
- Summary of fees related to digital currency exchanges ((updated on 02/13/2017))
I'm not sure.Why does the K line with the down shadow line simulate 12 ticks?
Spartan play quantifiedIs it possible to add custom tick points, the tick points generated at the current analog level are very different from the actual ones
Infinite space under the moonIs it possible to simulate a boom in contract retesting?
FangBeiIn the simulated feedback cycle, 1 hour later is directly 1 day, so why not 2 hours, 4 hours, 6 hours, 12 hours, these commonly used cycles?
The Little DreamThe underlying K-line cycle uses one minute and the data grain is very small. It can be retested at the disk level, or it can provide the data collected by itself using a custom data source.
The Little DreamThe system itself does not have a burst detection mechanism, but it can add burst detection in its own strategy. Holding a loss greater than the available assets in the account is a burst.
The Little DreamThe retrieval system sets some of the more commonly used cycles, and if you need a K-line with any cycle, you can look at the square bracket. There are some templates that can convert K-line cycles.